Three-dimensional modeling of the asymmetric blast wave from the 2006 outburst of RS Ophiuchi: Early X-ray emission
Abstract
Context. Chandra/HETG observations of the recurrent nova RS Ophiuchi at day 13.9 of its 2006 outburst reveal a spectrum covering a large range in plasma temperature and characterized by asymmetric and blue-shifted emission lines (2008ApJ...673.1067N; drake07).
Aims. We investigate the origin of asymmetries and broadening of the emission lines observed with Chandra/HETG. We explore possible diagnostics of the early blast wave and of the circumstellar medium (CSM) in which the explosion occurred.
Methods. We perform 3-D hydrodynamic simulations of the blast wave from the 2006 outburst, propagating through the inhomogeneous CSM. The model takes into account the thermal conduction (including the effects of heat flux saturation) and the radiative cooling. From the simulations, we synthesize the X-ray emission and derive the spectra as they would be observed with Chandra/HETG.
Results. The simulated nova remnant is highly aspherical and the blast wave is efficiently collimated by the inhomogeneous CSM. Our model reproduces the observed X-ray emission in a natural way if the CSM in which the outburst occurred is characterized by an equatorial density enhancement. Our “best-fit” model predicts that most of the early X-ray emission originates from a small region propagating in the direction perpendicular to the line-of-sight and localized just behind the interaction front between the blast wave and the equatorial density enhancement. The model predicts asymmetric and blue-shifted line profiles remarkably similar to those observed. These asymmetries are due to substantial X-ray absorption of red-shifted emission by ejecta material.
Conclusions. The comparison of high quality data of Chandra/HETG with detailed hydrodynamic modeling has allowed us to unveil, for the first time, the details of the structure emitting in the X-ray band in early phases of the outburst evolution, contributing to a better understanding of the physics of interactions between nova blasts and CSM in recurrent novae. This may have implications for whether or not RS Ophiuchi is a Type Ia SN progenitor system.
Key Words.:
shock waves – binaries: symbiotic – stars: individual (RS Ophiuchi) – novae, cataclysmic variables – X-rays: binariese-mail: orlando@astropa.inaf.it
1 Introduction
RS Ophiuchi (RS Oph) is a symbiotic recurrent nova that went into its latest outburst on 2006 February 12.83 UT (2006IAUC.8671....2N); previous outbursts were recorded in 1898, 1933, 1958, 1967, and 1985111Two possible outbursts were also observed in 1907 (2004IAUC.8396....2S) and 1945 (1993JAVSO..22..105O). (see 1987rorn.conf....1R; 1987rorn.conf...27R and references therein). RS Oph is thought to be a binary system, comprising a red giant star that does not fill its Roche lobe, and a white dwarf of mass near the Chandrasekhar limit (1994AJ....108.2259D; 1996ApJ...456..717S; 2000AJ....119.1375F); the system has a period of days (2000AJ....119.1375F). Current theory tells us that, in this class of binaries, the outbursts occur on the white dwarf due to thermonuclear runaway of hydrogen-rich material transferred from the companion red giant onto the surface of the white dwarf (e.g. 1991ApJ...369..471K; 1999A&A...344..177A; 2000NewAR..44...81S).
The strong interest in studying RS Oph originates mainly from the belief that recurrent novae are progenitors of Type Ia supernovae (SNe Ia). Two possible scenarios have been proposed: i) matter from the red giant is accreted by the white dwarf, causing the latter to increase in mass until it reaches the Chandrasekhar limit and explodes as an SN Ia; ii) two white dwarf stars merge, with the combined mass momentarily exceeding the Chandrasekhar limit, causing an SN Ia explosion. Which of these two scenarios is the more plausible is still under debate, so studying the nova outbursts from RS Oph can provide important insight into SNe Ia.
During the 2006 outburst an intensive international observing campaign was organized, incorporating observations ranging from radio to X-ray wavelengths, and monitoring the outburst since the early phases of its evolution. The results included the detection of X-ray emission from hot gas, evolving from a dominant plasma temperature of KeV few days after the eruption (2006Natur.442..276S) to KeV 10 days after optical maximum (2006ApJ...652..629B; 2006Natur.442..276S). It has been suggested that bright X-ray emission arises from the shock-heated extended outer atmosphere of the red giant (e.g. 1985MNRAS.217..205B; 2006ApJ...652..629B; 2008ApJ...673.1067N; drake07).
Chandra/HETG observations at day 13.9 revealed a rich spectrum of emission lines indicative of emitting plasma with temperatures ranging between and MK (2008ApJ...673.1067N; drake07). drake07 noted that the lines are too strongly peaked to be explained by a spherically-symmetric shock, suggesting a collimation mechanism of the X-ray emitting plasma in the direction perpendicular to the line-of-sight. The lines also appear asymmetric and slightly blue-shifted, while the red wings of the line profiles become weaker with increasing wavelength. drake07 suggested that the asymmetric nature of the circumstellar medium (CSM) in which the explosion occurred can be responsible for both the broad range in plasma temperature and the shock collimation observed.
Here we investigate the origin of the line asymmetries, broadening and blue-shifts observed with Chandra/HETG. We aim at exploring possible diagnostics of the early blast wave and of the inhomogeneous CSM in which the explosion occurred. To this end, we model the expansion of the blast wave from the 2006 outburst of the recurrent nova RS Oph through the extended outer atmosphere of the companion red giant, using detailed 3-D hydrodynamic simulations. From the simulations we synthesize the X-ray emission and derive the spectra as they would be observed with Chandra/HETG.
In Sect. 2 we describe the hydrodynamic model, the numerical setup, and the synthesis of X-ray emission; in Sect. LABEL:sec3 we discuss the results; and finally in Sect. LABEL:sec4 we draw our conclusions.
2 Model
2.1 Hydrodynamic modeling
The blast wave is modeled by numerically solving the time-dependent fluid equations of mass, momentum, and energy conservation in a 3-D Cartesian coordinate system , taking into account the radiative losses from an optically thin plasma and thermal conduction (including the effects of heat flux saturation):
| (1) |
is the total gas energy (internal energy, , and kinetic energy), is the time, is the mass density, is the mean atomic mass (assuming cosmic abundances), is the mass of the hydrogen atom, is the hydrogen number density, is the electron number density, u is the gas velocity, is the temperature, is the conductive flux, and represents the radiative losses per unit emission measure (e.g. rs77; mgv85; 2000adnx.conf..161K). We use the ideal gas law, , where is the adiabatic index.
To allow for a smooth transition between the classical and saturated conduction regime, we followed 1993ApJ...404..625D and defined the conductive flux as (see also 2005A&A...444..505O)
| (2) |
Here represents the classical conductive flux (spi62)
| (3) |
where is the Boltzmann constant, is the electron mass, is the electron charge, is the average atomic number, is the Coulomb logarithm, and parameters depend on the chemical composition, and in a proton-electron plasma: and . The saturated flux, , is (cm77)
| (4) |
where is the isothermal sound speed, and is a number on the order of unity. We set according to the values suggested for a fully ionized cosmic gas: (1984ApJ...277..605G; 1989ApJ...336..979B, 2002A&A...392..735F, and references therein).
In order to trace the motion of the material ejected by the violent eruption, we consider a passive tracer associated with the ejecta. To this end, we add the equation
| (5) |
to the standard set of hydrodynamic equations. is the mass fraction of the ejecta inside the computational cell. The ejecta material is initialized with , while in the ambient medium. During the shock evolution, the ejecta and the ambient medium mix together, leading to regions with . At any time the density of ejecta material in a fluid cell is given by .
The calculations described in this paper were performed using flash, an adaptive mesh refinement multiphysics code (for00). The hydrodynamic equations are solved using the flash implementation of the piecewice-parabolic method (cole84). The code was designed to make efficient use of massively parallel computers using the message-passing interface (MPI) for interprocessor communications. The code has been extended with additional computational modules to handle radiative losses and thermal conduction (see 2005A&A...444..505O for the details of the implementation).
As an initial condition, we assume a spherical Sedov-type blast wave with radius AU and with total energy , originating from the thermonuclear explosion on the white dwarf. The initial total energy of the explosion is partitioned so that 1/4 of the energy is contained in thermal energy, and the other 3/4 in kinetic energy. The initial total mass of the ejecta is . The blast propagates through the extended outer atmosphere (the wind) of the companion red giant and is off-set from the origin of the wind density distribution by 1.5 AU (i.e. the system orbital separation; 1994AJ....108.2259D). We follow 2006Natur.442..279O and assume the gas density in the red giant wind proportional to (where is the radial distance from the giant) and its temperature K. Note that the temperature values of the red giant wind (in symbiotic stars), , can range between few K up to K closer to the red giant (1983A&A...126..407F). To evaluate the effects of on the results of our simulations, we compared simulations with K with simulations with K and found that the results do not change.
In addition to the density distribution, we include also an equatorial density enhancement (hereafter EDE) in the red giant wind, as suggested by VLBA radio synchrotron observations (2006Natur.442..279O) and by HST observations (2007ApJ...665L..63B) of the 2006 blast wave, and as predicted by detailed hydrodynamic modeling (1999ApJ...523..357M; 2008A&A...484L...9W). The mass density distribution of the unperturbed CSM is given by:
| (6) |
where is the mass density at a distance of 1 AU from the red giant, is the radial distance from the giant in AU, is the density enhancement at the equatorial plane, is the height above the equatorial plane and is a characteristic length scale.
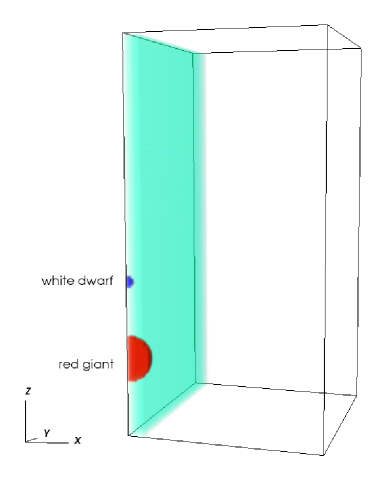
In our 3-D simulations, the symmetry of the problem allows us to solve the hydrodynamic equations in one quadrant of the spatial domain (see Fig. 1). The coordinate system is oriented in such a way that both the white dwarf and the red giant lie on the axis. The red giant is at the origin of the coordinate system, , and the computational domain extends 60 AU in the direction, and 30 AU in both the and directions; the white dwarf is arbitrarily located to the north on the axis () at AU (i.e. the system orbital separation; 1994AJ....108.2259D).
At the coarsest resolution, the adaptive mesh algorithm used in the flash code (paramesh; mom00) uniformly covers the 3-D computational domain with a mesh of blocks, each with cells. We allow for 8 nested levels of refinement during the first 3 days of evolution and for 6 levels in the rest of the simulation, with resolution increasing twice at each refinement level. The refinement criterion adopted (loehner) follows the changes in density, temperature, and tracer of ejecta. This grid configuration yields an effective resolution of AU at the finest level during the first 3 days of evolution (when the radius of the nova remnant was AU) and AU at later times, corresponding to an equivalent uniform mesh of and grid points, respectively. The higher spatial resolution during the first 3 days of evolution is required to describe properly the development of initially small structures dominated by radiative cooling. We use reflecting boundary conditions at and (consistent with the adopted symmetry) and zero-gradient conditions at the other boundaries.
We follow the expansion of the blast wave through the red giant wind for days, considering two sets of simulations: with or without the EDE. In both cases, we explore a parameter space defined by the initial mass of ejecta in the range , the initial energy of the explosion in the range erg (namely the published estimates for the ejected mass and energy of the explosion, e.g. 2005ApJ...623..398Y; 2006Natur.442..276S; 2006Natur.442..279O), and the particle number density of the red giant wind at 1 AU in the range cm (e.g. 1994AJ....108.2259D). In the set of simulations with the EDE, we set cm (consistent with the values found by 2008A&A...484L...9W) and we explore the case of and 2 AU (see Eq. 6). Table 1 summarizes the physical parameters characterizing the simulations.
| run | |||||
|---|---|---|---|---|---|
| [] | [erg] | [cm] | [cm] | [AU] | |
| ND-E43-N7 | 0 | - | |||
| ND-E44-N7 | 0 | - | |||
| ND-E43-N8 | 0 | - | |||
| ND-E44-N8 | 0 | - | |||
| ND-E43-N10 | 0 | - | |||
| ND-E44-N10 | 0 | - | |||
| YD-E43-N7-L2 | 2 | ||||
| YD-E44-N7-L2 | 2 | ||||
| YD-E43-N8-L2 | 2 | ||||
| YD-E44-N8-L2 | 2 | ||||
| YD-E44-N7-L1 | 1 |
Initial mass of ejecta;
Initial energy of the explosion;
Particle number density of the red giant wind at 1 AU;
Particle number density enhancement at the equatorial plane;
Characteristic length scale in Eq. 6.