On the nature of faint Low Surface Brightness galaxies in the Coma cluster ††thanks: Based on observations obtained with MegaPrime/MegaCam, a joint project of CFHT and CEA/DAPNIA, at the Canada-France-Hawaii Telescope (CFHT) which is operated by the National Research Council (NRC) of Canada, the Institute National des Sciences de l’Univers of the Centre National de la Recherche Scientifique of France, and the University of Hawaii.
Abstract
Context. This project is the continuation of our study of faint Low Surface Brightness Galaxies (fLSBs) in one of the densest nearby () galaxy regions known, the Coma cluster.
Aims. Our goal is to improve our understanding of the nature of these objects by comparing the broad band spectral energy distribution with population synthesis models, in order to infer ages, dust extinction and spectral characteristics.
Methods. The data were obtained with the MEGACAM and CFH12K cameras at the CFHT. We used the resulting photometry in 5 broad band filters (u*, B, V, R, and I), that included new u*-band data, to fit spectral models. With these spectral fits we inferred a cluster membership criterium, as well as the ages, dust extinctions, and photometric types of these fLSBs.
Results. We show that about half of the Coma cluster fLSBs have a spectral energy distribution well represented in our template library (Best Fit fLSBs, BF) while the other half present a flux deficit at ultraviolet wavelengths (Moderately Good Fit fLSBs, MGF). Among the BF fLSBs, 80 are probably part of the Coma cluster based on their spectral energy distribution. BF fLSBs are relatively young (younger than 2.3 Gyrs for 90 of the sample) non-starburst objects. The later their type, the younger fLSBs are. A significant part of the BF fLSBs are quite dusty objects (1/3 have AV greater than 1.5). BF fLSBs are low stellar mass objects (the later their type the less massive they are), with stellar masses comparable to globular clusters for the faintest ones. Their characteristics are partly correlated with infall directions, confirming the disruptive origin for at least part of them.
Key Words.:
galaxies: clusters: individual (Coma)1 Introduction
Faint Low Surface Brightness Galaxies (fLSBs) are a class of galaxies residing both in rich clusters and in the field. This class of galaxies is defined on the basis of its R band total magnitude (MR-14) and its low surface brightness (R central surface brightness fainter than 24, see Adami et al. 2006a for more details). While they are not easily detectable, their presence can strongly constrain both hierarchical galaxy formation and evolution and the amount of dark matter present in clusters (e.g. Ulmer et al. 1996).
In terms of how fLSBs connect to the study of galaxy evolution in clusters, Adami et al. (2006a) proposed the existence of three different populations of fLSBs. One population is analogous to the red sequence of the color magnitude relation (CMR) found at much brighter magnitudes by e.g. López-Cruz et al. (2004). This is probably the primordial fLSB population in the cluster. The second is much redder and the third much bluer. Adami et al. (2006a) assumed that galaxies falling on the extended CMR had passively evolved and were formed at the same time as most of the larger galaxies (excluding recent infalls). In agreement with the standard model used to explain the CMR (e.g. Kodama & Arimoto, 1997), this means that these CMR fLSBs underwent an initial burst of star formation that consumed enough gas to stop any further star formation. The metallicity of the CMR fLSBs is then expected to produce less red colors than those of galaxies of the same age that could have retained their gas better. In this picture, the fLSBs that fall on the red side of the CMR would originate from giant stripped galaxies that were able to retain their metals better before being disrupted. The fLSBs on the blue side of the CMR probably come from recently infalling blue galaxies that are just undergoing induced star formation, explaining the blue colors.
The primordial galaxies lying on the CMR would make up the low mass tail of the galaxy mass distribution, as resulting from hierarchical galaxy formation in CDM models (see for example, White & Rees 1978; White & Frenk, 1991). In those models many low mass galaxies have never coalesced into larger galaxies. This scenario can be directly compared to observations. The results have been a point of contention as to whether there are enough observed dwarf galaxies compared to the predictions of CDM models or not (see for example, Davies et al 2004, Kravtsov et al. 2004, Roberts et al. 2004, 2007 and references therein). Hence, the study of low mass galaxies is directly linked to cosmology, models of galaxy evolution, and large scale structure formation.
In order to examine the hypotheses on the origin of the fLSBs found in Adami et al. (2006a) we extend our initial study (based on deep B and R data) to include the analysis of deep u*, V, and I images. We require that fLSBs be detectable in all bands. With 5 bands we are able to fit spectral distribution models from about 3500 Å to 9000 Å. We then compare our new results with the basic hypotheses that were presented in Adami et al. (2006a) by fitting spectral energy distribution (SED) models to our 5 colors.
Furthermore, Coma itself is special, not only from an observational point of view since it is the closest dense cluster that is well out of the galactic plane, but it contains one of the hottest, densest intra cluster media and shows evidence for recent subcluster infall (e.g. Neumann et al. 2003 or Adami et al. 2005a). We thus expect to find evidence for the effects of these properties on the fLSB population, which in turn gives us insight on the formation of these fLSBs.
The redshift of Coma is 0.023, and for this paper we will assume a distance to Coma of 100 Mpc, H0 = 70 km s-1 Mpc-1, , , distance modulus = 35.00, and therefore the scale is 0.46 kpc arcsec-1. All magnitudes are given in the Vega system.
2 Data and analysis method
In the Adami et al. (2006a) work based on B and R band data, we used statistical arguments and a comparison with blank fields to show that 95 of the detected fLSBs were most probably members of the Coma cluster. In the present paper we adopt a different approach to check this result, using a photometric redshift technique, based on the optimal wavelength coverage achieved by the u*BVRI data (see Fig. 1). The u* band filter is particularly useful here because it allows to encompass the 4000Å break, which is the most important spectral feature in the considered redshift range for both photometric redshifts and spectral classification of galaxies. Therefore, instead of using statistical considerations (e.g. Adami et al. 2006a), we derive the likelihood of being a cluster member for each fLSB in this field.
2.1 Data
The data on which this paper is based are extensively described in Adami et al. (2006b, B, V, R, and I bands) and in Adami et al. (2008, u* band, hereafter A08). We only give here the salient points.
We observed the Coma cluster with the CFHT. First, we obtained a 2 field mosaic with the CFH12K camera in 4 bands (B, V, R and I) in 1999 and 2000. These data cover a total field of 5242 arcmin2 centered on the two dominant cluster galaxies with a completeness level close to R24. These data are available at http://cencosw.oamp.fr.
Second, we obtained u∗ band data including the previous field in 2006 and 2007 with MegaPrime/MegaCam. The total exposure time was 9.66 hours, obtained by combining 58 individual spatially dithered exposures of 10 min each. The data reduction was performed with the Terapix tools (http://terapix.iap.fr/), the standard procedure applied for example to the CFHTLS fields (McCracken et al. 2008), and a 1 deg2 image was produced.
2.2 Spectral template fitting method

Photometric redshifts and derived parameters were computed for fLSB galaxies using a modified version of the public code Hyperz111http://webast.obs-mip.fr/hyperz/ (Bolzonella et al. 2000; Ienna & Pelló 2008), with the same settings as for the whole Coma catalog (A08). Hyperz is based on the fitting of the photometric SED. With respect to the public version, the modified version222http:www.ast.obs-mip.fr/users/roser/hyperz includes a refined routine for flux integration which improves the previous one in two different ways. The filter transmission curves are given in photon units when needed, instead of the previous default value in flux units (the user can actually combine both transmission definitions within the same SED). The spectral resolution is better suited for templates including strong narrow features. Several additional outputs have been included to improve the cluster membership determination, such as the integrated probability around the cluster redshift. Other modifications mainly concern the inclusion of additional outputs (e.g. the automatic classification of input rest-frame SEDs based on a library of reference templates, the capability of deriving absolute magnitudes in different filters based on two different scaling modes, as well as the integrated probability around the best-fit photometric redshift, and the normalized probability distribution in redshift), and parameters (e.g. a galactic reddening correction for each object in the input catalog instead of a global E(B-V), new templates and template types, and the scaling of SEDs into physical units allowing the user to easily compute stellar masses). This modified version is intended to replace the previous public one.
Photometric redshifts were computed in the range , using a large set of templates covering a broad domain in parameter space, mainly defined by the spectral type, the age of the stellar population, and the intrinsic reddening. The spectral library includes 14 templates for galaxies:
-
•
Eight evolutionary synthetic SEDs computed with the last version of the Bruzual & Charlot code (Bruzual & Charlot 1993, 2003), with the Chabrier (2003) initial mass function (IMF) and solar metallicity: a delta burst [single-burst stellar population (SSP)], a constant star-forming system, and 6 -models with exponentially decaying star formation rate (SFR), roughly matching the observed colors of local field galaxies from E to Im types.
-
•
A set of 4 empirical SEDs compiled by Coleman et al. (1980) to represent the local population of galaxies, extended to wavelengths Å and Å with the Bruzual & Charlot spectra.
-
•
Two starburst galaxies (SB1 and SB2) from the Kinney et al. (1996) template library.
SED fits were obtained with solar metallicity templates. Low-resolution SEDs do not contain enough information to reliably fit all the parameters, given the degeneracies in the parameter space. Here we have fixed the IMF and metallicity, given their relatively smaller impact on the SED fitting results exploited in this paper as compared to the other relevant parameters, i.e. SFR, reddening and age of the stellar population, and their negligible impact on the photometric redshifts (see e.g. Bolzonella et al. 2000). Assuming smaller metallicities for the mean stellar population leads to older stellar ages and/or more extinction for the same SED fitting quality. Although the small strength of this effect does not change the observed behavior of this sample, one must bear in mind this limitation.
The internal reddening is considered as a free parameter with ranging between 0 and 2.0 magnitudes (E(B-V) between 0 and 0.6 mags), according to Calzetti et al. (2000). We do not know if fLSBs are very dusty objects and they could exhibit different properties compared to well studied galaxies.
fLSBs in this sample are detected in all the filters, and no prior was imposed in absolute magnitude.
For each object we also obtained an estimate of its stellar mass based on the best-fit of its SED at the redshift of Coma, using the Bruzual & Charlot templates mentioned above. A rough classification of the rest-frame SED of galaxies into 5 different photometric types (spectral types hereafter) was also obtained, based on the best fit with the simplest empirical templates: (1) E/S0, (2) Sbc, (3) Scd, (4) Im and (5) Starburst galaxies.
2.3 Limitations
There are four limitations of the described method: possible uncertainties in the fLSB magnitude extraction, lack of adapted templates to this peculiar class of galaxies, photometric redshift probability distribution functions with complex shapes, and possible degeneracies between output parameters.
2.3.1 Magnitude uncertainties
fLSBs are by definition very difficult objects to observe due to their low surface brightness, usually close to the sky level. Simply using a classical source extraction method (as the SExtractor package, Bertin Arnouts 1996) would probably lead to biased results due to the difficulty to subtract the background level. In order to solve this problem we applied a dedicated extraction code that already proved to be efficient (see Ulmer et al. 1996 or Adami et al. 2006a for details) for these purposes. In a few words, this IDL based package ingests a SExtractor input catalog to select potential fLSB candidates and measure their magnitudes. This measure is done by fitting dedicated surface brightness profiles (gaussians or exponentials depending on the object characteristics and data seeing) and estimating the background in hand-made external annuli. Each object requires manual inspection, thus allowing for a given object to deal with peculiar problems such as close neighbors or CCD defects.
This process was followed homogeneously in the five bands (u*, B, V, R, and I) with the same settings as in Adami et al. (2006a) and this ensures the best possible estimates for the fLSBs magnitudes. These magnitudes were fed into the photometric redshift code.
2.3.2 Templates
In view of their faintness (R21) fLSBs are up to now basically spectroscopically unknown objects. The template library may therefore be incomplete. It is beyond the scope of this paper to determine the SEDs of the whole fLSB population (spectroscopically or with extensive narrow-band photometry), so we chose to study only the fLSBs that were reasonably represented in our template library.
This was made in two steps. First, we assumed the Adami et al. (2006a) results showing that nearly all fLSBs along the Coma cluster line of sight were likely to be cluster members. We therefore assigned the Coma cluster redshift to all fLSBs. Then, we compared the observed magnitudes with our template library, computing the best fit reduced and probability P(). This analysis shows that part of our fLSBs exhibit a flux deficit in the u* band compared to the mean spectral type of these objects (Sbc or type 2).
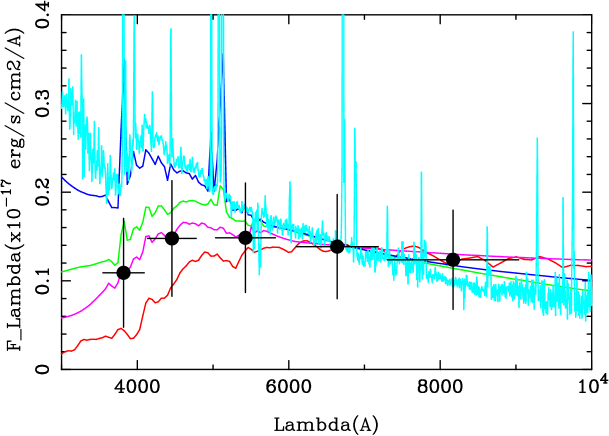
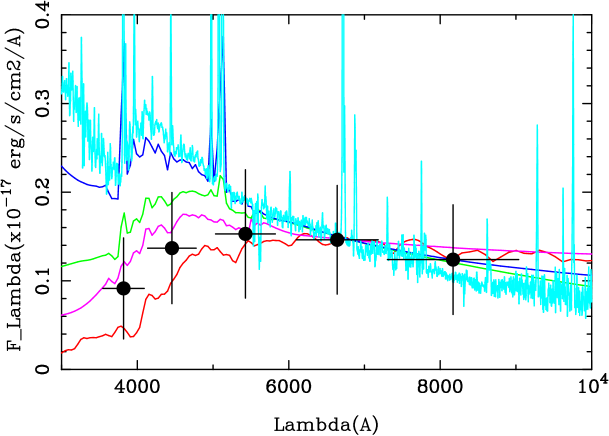
This led us to split our sample in two parts: the best fit sample (hereafter BF: not showing the UV deficit, see Fig. 2) and the moderately good fit sample (hereafter MGF: showing this deficit, see also Fig. 2) of the synthetic templates to the observed SEDs (on the basis of and P() being greater or lower than 1.7 and 10 respectively). Note that error bars in the SED displayed in Fig. 2 correspond to 1 rms values with respect to the mean fluxes of the fLSB populations.
Regarding the MGF fLSBs, we will study these objects without using the template fit parameters (as spectral type, age, or extinction). This class includes by definition the small percentage of fLSBs (predicted in Adami et al. 2006a) that are not Coma members. We removed all these galaxies from the master sample (MS in the following). The MS will therefore contain only BF fLSBs (312 galaxies).
2.3.3 Redshift probability distribution function
In order to test the fLSB Coma membership, we could have considered the direct photometric redshift estimate. The quality of photometric redshifts achieved for the present photometric catalog has been studied in detail in A08, using both Hyperz and LePhare (e.g. Ilbert et al. 2006). However, as also discussed in A08, direct photometric redshift estimates are subject to several biases, in particular when the photometric redshift probability distribution function presents several peaks along the redshift interval. We therefore prefered to consider (as in A08) the redshift Probability Distribution Function (PDF: a function giving the probability for a given galaxy to be at a given redshift). This allowed us to compute the integrated probability for each galaxy of being at the cluster redshift (actually within the interval), based on their normalized probability distributions within the interval.
We cannot exclude galaxies in the interval and not belonging to the Coma cluster. However, if we consider the luminosity functions of Ilbert et al. (2005) between R=21 and 24 (the approximate magnitude interval in this paper) and assume that fLSBs follow the normal galaxy luminosity function, we can show that the number of field galaxies in the cosmological comoving volume included in our field of view and at redshift lower than 0.12 is 15 times lower than the number of Coma cluster galaxies. Moreover, we have shown in Adami et al. (2006a) that field fLSBs are much rarer than in the Coma cluster. This implies that the ratio between the number of Coma cluster fLSBs and fLSBs is probably even larger than 15. We therefore estimate than less than 5 of the fLSBs classified as Coma members are in fact non cluster members at z0.12.
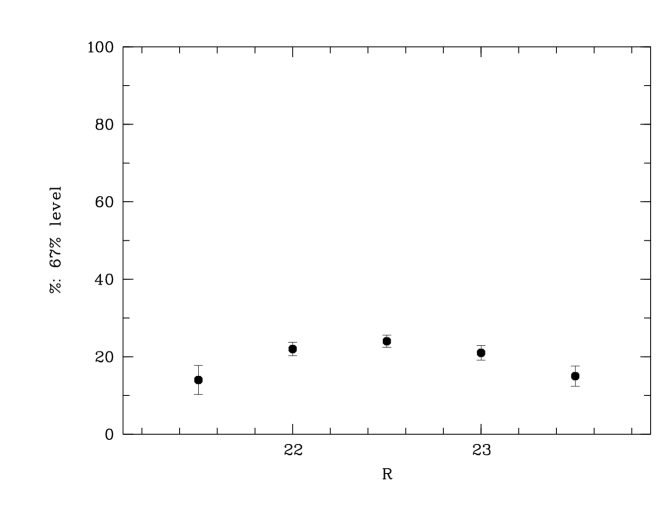
Fig. 3 gives the percentage of the BF sample that can be excluded from being in the interval at the 67% confidence level (we exclude a given fLSB from the sample if the probability that it is in the interval is smaller than 67) as a function of the galaxy magnitude. Even if this result is consistent with a large fraction of the BF fLSBs being genuine Coma members, as previously demonstrated in Adami et al. (2006a), the galaxies with a membership probability lower than 67% will be removed from the MS.
At this point, the MS includes 256 BF fLSBs which are very likely Coma members.
2.3.4 Degeneracies between output parameters
Our experience shows that the only significant degeneracy can occur between the age and AV. Starting from the MS (fLSBs likely to be at the Coma redshift and well represented in our template library), we have then computed likelihood maps in the parameter space defined by galaxy type, age and reddening. In particular, likelihood maps in the (age, AV) parameter plane were obtained for each galaxy and for each evolutionary Bruzual & Charlot template given above.
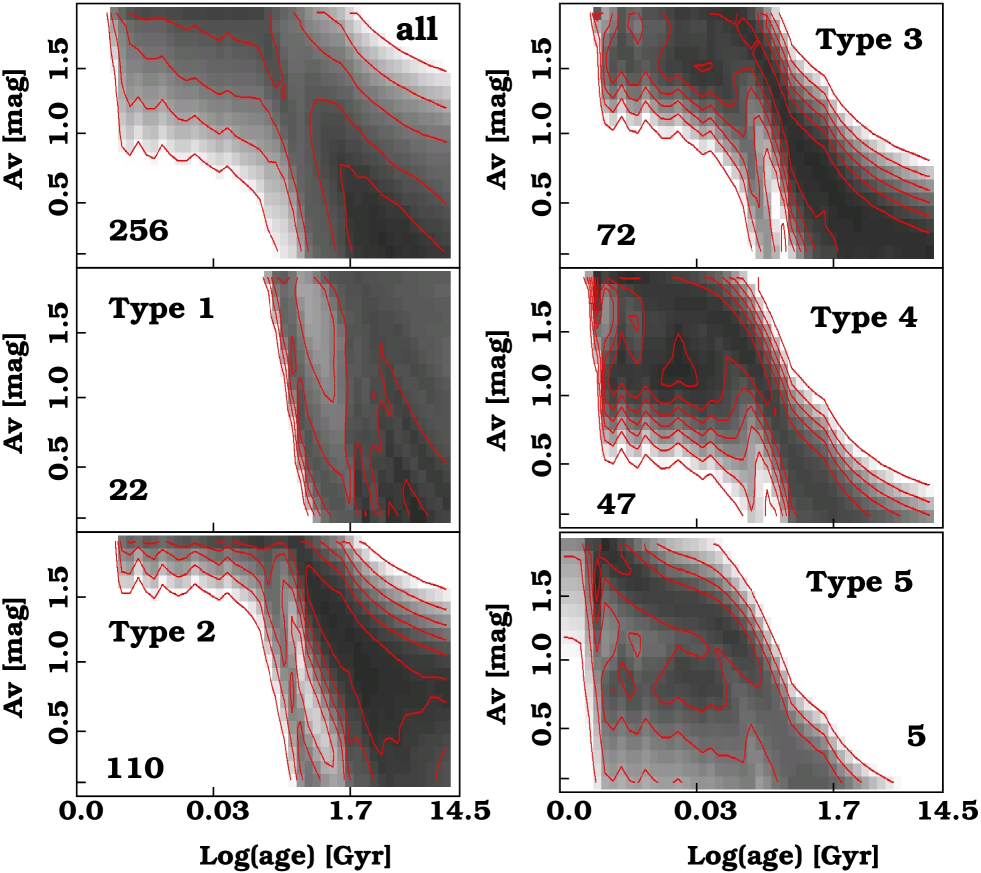
The fitting parameter ages and values of AV are partly degenerate in the sense that fits of comparable qualities can be obtained for different sets of parameters. However, a large fraction of the Coma fLSBs is best fit with reddening values above A. To investigate these degeneracies further, we have stacked together all the combined (age, AV) likelihood maps, for all and for different fLSB populations according to their best-fit spectral types. Results are shown in Fig 4. Each (age, AV) map in this figure is an averaged combination of individual maps for all fLSBs in a given class. Before combining the maps, each individual map was normalized to a value of 1 at the minimum value. Maps displaying a low contrast indicate a high dispersion in the individual maps, whereas maps with a high contrast correspond to the regions where the galaxy populations tend to concentrate.
Although template fitting can formally reach ages as old as 17.5 Gyr, in the following we limit the age of the stellar population to the age of the universe. This assumption has no consequence on the final conclusions.
3 General results
In this section, we first briefly describe the MGF fLSBs and we mainly concentrate on BF fLSBs, the only ones for which spectral fitting results can really be trusted.
3.1 Moderately Good Fit (MGF) fLSBs
The MGF fLSBs represent 59 of the initial sample. The spectral shape of these objects is typical of galaxies having experienced their last star burst several Gyrs in the past as shown by the UV flux deficit. This is in good agreement with Adami et al. (2006a) who suggested that 2/3 of the total sample could be galaxies formed in low mass dark matter halos. These objects would have experienced a short burst of star formation, rapidly halted by their inability to retain their gas against supernova winds. These objects would then have passively evolved after the burst. The spatial distribution of the MGF fLSBs is not significantly different (at the 99 level) from the complete sample of fLSBs, from a Kolmogorov-Smirnov 2D test. There is no visible spatial concentration. This is not surprising, as this population is probably relatively old (probably part of the primordial fLSBs of the cluster) and had a long time to homogenize. Even if MGF fLSBs do not allow accurate spectral parameters determination, we can still quote that predicts a mean age of 2.23.7 Gyrs for this population. This is of the order of the age of the oldest BF fLSB (see below).
We will now concentrate on the BF fLSBs.
3.2 Best Fit (BF) fLSBs compared to the Adami et al. (2006a) classes
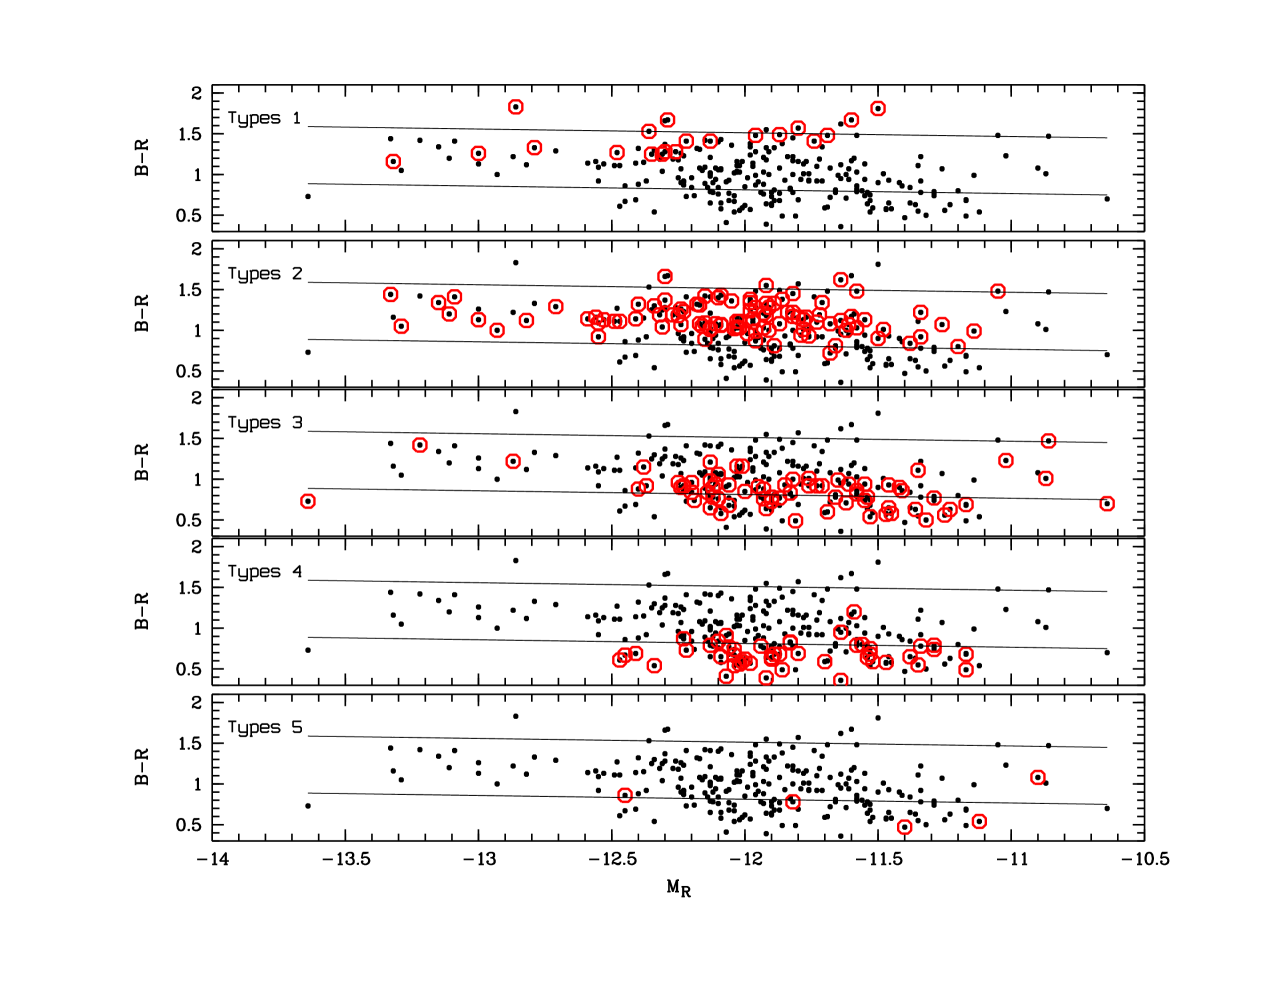
We defined in Adami et al. (2006a) three classes of fLSBs (bluer than the Coma red sequence, on the Coma red sequence, and redder than the Coma red sequence) that we tentatively identified with debris from disrupted disk galaxies, with old and passively evolving primordial cluster fLSBs, and with depleted cores of early type galaxies respectively. In order to give the relation between these three types and the five spectral types defined in the present paper for MS, we show in Fig. 5 the location of the different spectral types in the color magnitude relation defined in Adami et al. (2006a). We see that types 4 and 5 are mainly part of the blue fLSB class of Adami et al. (2006a). Types 3 are distributed between the blue and the red sequence fLSBs of Adami et al. (2006a). Types 2 are essentially red sequence fLSBs from Adami et al. (2006a). Types 1 are distributed between the red and the red-sequence fLSBs of Adami et al. (2006a).
3.3 BF fLSB spectral characteristics
We see in Fig. 4 that type 1 fLSBs are older than 0.5 Gyrs, whatever AV. Type 2 fLSBs are also older than 0.5 Gyrs, except when considering strong AV. Type 3 fLSBs have various ages, but are preferentially relatively old objects except, again, when considering strong AV. Type 4 fLSBs also have various ages but are preferentially younger than 0.5 Gyrs. Finally, type 5 fLSBs are clearly young objects (in good agreement with being starburst galaxies) whatever AV. These results are consistent with the general idea of galaxies being younger when the type increases. Comparing our Fig. 2 with Fig. 1 of Asari et al. (2007) also shows that type 1 fLSBs are probably high metallicity objects while late type fLSBs have lower metallicities. However, we will not push this comparison further as we will show that we are dealing here with significantly lower stellar masses than Asari et al. (2007).

The mean extinction is moderate and equal to 1.020.60. However, this includes quite dusty objects: 32 have Av greater than 1.5.
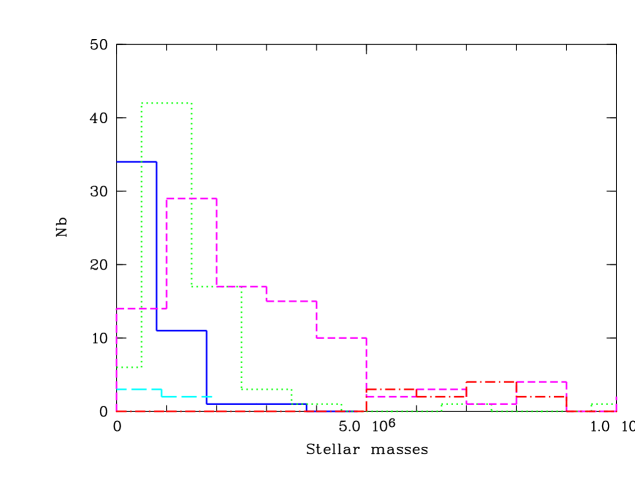
fLSBs in this sample exhibit absolute magnitudes ranging between M and . Since absolute magnitudes are directly related to stellar mass, we show in Fig. 6 the histograms of the MS fLSB stellar masses. First we confirm that we deal with a very low stellar mass galaxy population, comparable to globular clusters for a large part of the sample. We also see that the earlier the type, the more massive the fLSBs in terms of stellar mass.
Very few galaxies among the fLSB population display SEDs consistent with starburst galaxies. Therefore, most of them are not undergoing an active process of star formation. On the other hand, the MS fLSBs contain on average quite a young stellar population (see Figs. 4 and 9), the 90 youngest galaxies of the sample being younger than 2.3 Gyrs; they are even found to be younger than 1.45 Gyrs when excluding types 1, and younger than 0.7 Gyr when excluding types 1 and 2. Therefore these populations formed recently in the cluster history.
The spatial distribution of the five starburst BF fLSBs does not show any particular pattern or correlation on large scales. However, there is a strong correlation between these types and the presence of close neighbors. Indeed, all these starburst BF fLSBs have a close neighbor, suggesting that these starbursts are induced by galaxy-galaxy interactions. Spectroscopy will, however, be needed to go further in this study, in particular to determine whether these close neighbors are physically linked. This task is difficult because fLSBs are faint and diffuse objects, and therefore this discussion is out of the scope of the present paper.
4 MS fLSB spatial distribution
In the next three subsections, we investigate the spatial distribution of BF fLSBs (MS) as a function of parameter values (absolute magnitude, age, and spectral type). In order to achieve this goal we computed the mean value of a given parameter as a function of location in the field. This was done with an adaptative kernel technique (e.g. Adami et al. 1998) that produces a map of the mean parameter values, discretizing the field of view in several pixels. This technique is a good balance between the spatial resolution and the uncertainty on the mean parameter value at a given place.
4.1 Spatial distribution of MS fLSBs as a function of parameter values: Absolute magnitude
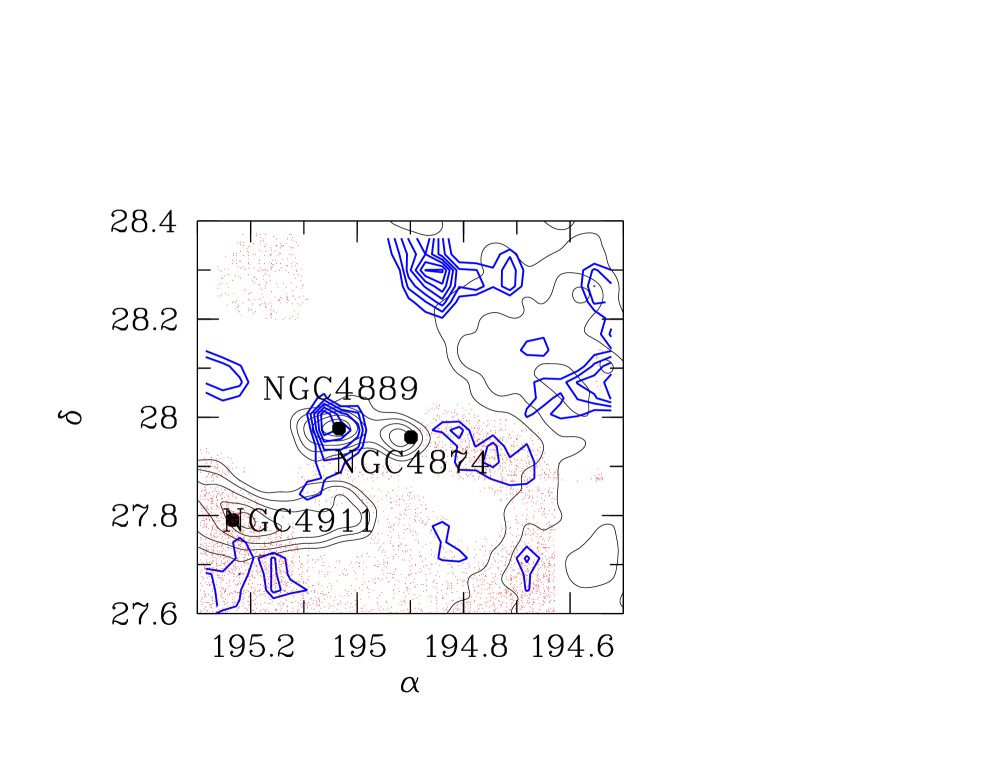
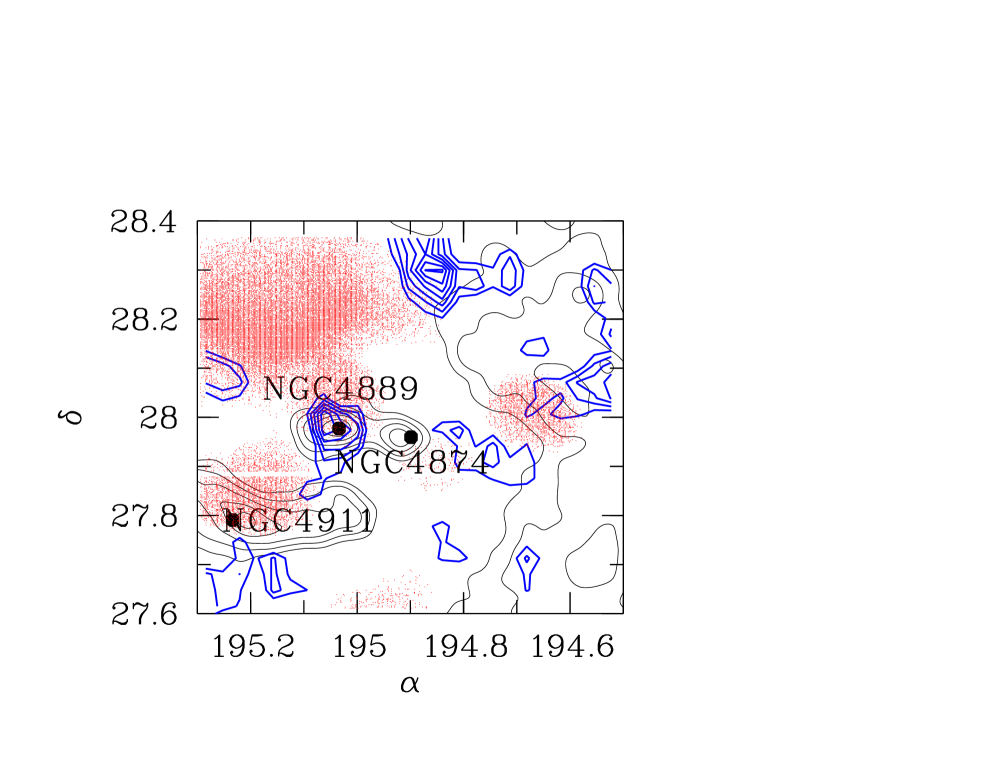
The faintest fLSBs (Fig. 8, R-12) are mainly distributed in the south of the cluster. In the northern part of the cluster, the mean R magnitude per pixel is almost always brigther than -12. This could be put in perspective with the fact that this is also the less populated region of the cluster in terms of faint galaxies (not only fLSBs: see Adami et al. 2007). We therefore would like to know if the masses of the potential MS fLSB progenitor galaxies have an influence on the MS fLSB magnitudes. More violent interactions are likely to take place in the south part of the cluster (because of the NGC 4839 and NGC 4911 infalls) and could also produce smaller and fainter galaxies. For example, Yoshida et al. (2008, based on Subaru imaging data) have shown an example of such a violent interaction in the south of the Coma cluster. This interaction produced knots as faint as M. However, such a general scenario still clearly needs to be assessed for example by numerical simulations, even if this is a demanding task (it requires to detect total masses of the order of 107 M⊙ in simulations, see Adami et al. 2007).
The detection of fainter objects in the south (compared to the north) of the cluster could also be due to instrumental effects since our southern exposures are deeper in some bands, e.g. in the R band (Adami et al. 2005b). However this is unlikely to explain completely the previous effect, as we show in the same paper that LSB detection levels are very similar in the north and south regions.
4.2 Age
In section 2.3.4. we showed the degeneracy between age and extinction. Here we assume that the internal extinction of these galaxies is not atypically high and that the age of the stellar population is the key physical reason for the spectral differences among our sample. The oldest objects (Fig. 9) are located to the west of NGC 4874, between NGC 4911 and NGC 4889 and to the north-east of NGC 4889. NGC 4874 is probably the oldest dominant galaxy in the cluster (e.g. Adami et al. 2005a). Therefore, we expect to have a relatively old population in its vicinity and this is, at least partially, the case. However, ages between 0.8 and 3 Gyrs are not that old and this speaks in favor of a relatively recent formation of these galaxies, with destruction of infalling giant galaxies as a possible origin. The same explanation is also possible for the region between NGC 4911 and NGC 4889 because this area is close to the cluster center and probably subject to strong tidal forces that could be able to destroy relatively bright galaxies.
4.3 Spectral type
The latest type BF fLSBs (Fig. 10) are mainly located in front of the infalling layers at the west of the cluster, and at the extreme south-east close to NGC 4911. Finding the latest types in the west infalling layers and along the NGC 4911 motion axis is in good agreement with the origin suggested for the blue fLSBs detected in Adami et al. (2006a): debris from spiral galaxies coming from the field.

4.4 Spatial smoothing of the fLSBs
We show in Figs. 8, 9, and 10 that fLSB properties are most of the time correlated with the main characteristic directions of the cluster (NGC 4911, NGC 4839, western infalling layers and north-east direction). However, other areas also exhibit peculiar fLSB populations in terms of AV, magnitude, age, or spectral type, without being located on any infall directions. This is only possible through a rapid spatial smoothing of the fLSBs. Populating the whole south part of the cluster with the faintest fLSBs (Fig. 8) requires for example a spatial migration of 650 kpc. The fLSB ages being mostly lower than 2.3 Gyrs, such a migration is only possible if fLSBs have a velocity greater than 350 km/s. fLSBs can be primordial objects in the cluster or disruptive galaxies (produced by larger galaxy disruptions).
Primordial fLSBs have velocity dispersions typical of galaxies with similar masses. Adami et al. (1998) have shown that Coma cluster galaxies fainter than M have a velocity dispersion of the order of 1200 km/s. This is clearly sufficient to explain a 650 kpc migration in 2.3 Gyrs.
Regarding disruptive fLSBs, their initial velocity has to be greater than their parent galaxy escape velocity (otherwise fLSBs originating from a major galaxy disruption will never escape) and the escape velocity then has to be greater than 350 km/s. This puts a constrain on the mass of these fLSBs progenitors. Wu et al. (2008) show for example that the escape velocity at the periphery of the Milky Way (1.9 1012 M⊙ in their paper) is 350 km/s. Less massive galaxies (e.g. NGC 4861 or NGC 2366, of the order of 2 1011 M⊙, see van Eymeren et al. 2007) have a lower escape velocity, lower than 50 km/s. This rough calculation therefore shows that disruptive fLSBs progenitors are probably more massive than a few 1012 M⊙.
5 Summary and conclusions
We show in this paper that about half of the Coma cluster fLSBs have a spectral energy distribution well represented in our template library (BF fLSBs) while the other half present a flux deficit in the ultraviolet wavelengths (MGF fLSBs).
MGF fLSBs are probably galaxies having experienced their last burst of star formation several Gyrs ago. They are homogeneously distributed in the cluster and are probably part of the Coma primordial fLSBs.
Among the BF fLSBs, 80 of these objects are probably part of the Coma cluster based on their spectral energy distribution. Their type closely links them with the class defined in Adami et al (2006a). BF fLSBs are relatively young (younger than 2.3 Gyrs for 90 of the sample) non-starburst objects. The later their type, the younger fLSBs are. A significant part of BF fLSBs are quite dusty objects (1/3 have AV greater than 1.5). They are low stellar mass objects (the later their type the less massive they are), with stellar masses comparable to globular clusters for the faintest fLSBs. Their characteristics are partly correlated with infall directions, confirming the disruptive origin for at least part of them.
We therefore confirm and refine a large part of the Adami et al. (2006a) conclusions. The next step will be to get spectroscopy of the fLSBs. This will give us a direct measure of the possible star-forming activity of these objects and allow us to draw a more complete picture of the fLSB behavior in the Coma cluster.
Acknowledgements.
The authors thank the referees for their time, and for useful and constructive comments. The authors are grateful to the CFHT and Terapix (for the use of QFITS, SCAMP and SWARP) teams, and to the French CNRS/PNG for financial support. Some of the authors also acknowledge support from NASA Illinois space grant NGT5-40073, from Northwestern University and from NSF grant AST-0205960.References
- (1) Adami C., Mazure A., Katgert P., Biviano A., 1998, AA 336, 63 (a)
- (2) Adami C., Biviano A., Durret F., Mazure A., 2005, AA 443, 17 (a)
- (3) Adami C., Slezak E., Durret F., et al, 2005, AA 429, 39 (b)
- (4) Adami C., Scheidegger R., Ulmer M., et al, 2006, AA 459, 679 (a)
- (5) Adami C., Picat J.P., Savine C., et al, 2006, AA 451, 1159 (b)
- (6) Adami C., Durret F., Mazure A., et al, 2007, AA 462, 411
- (7) Adami C., Ilbert O., Pelló R., et al, 2008, AA in press, arXiv:0809.2027
- (8) Asari N.V., Cid Fernandes R., Stasińska G., et al, 2007, MNRAS 381, 263
- (9) Bertin E., Arnouts S., 1996, AASS 117, 393
- (10) Bolzonella M., Miralles J-M., Pelló R., 2000, AA 363, 476
- (11) Bruzual A.G., Charlot S., 1993, ApJ 405, 538
- (12) Bruzual A.G., Charlot S., 2003, MNRAS 344, 1000
- (13) Calzetti D., Armus L., Bohlin R.C., et al, 2000, ApJ 533, 682
- (14) Chabrier G., 2003, PASP 115, 763
- (15) Coleman G.D., Wu C.-C., Weedman D. W., 1980, ApJS 43, 393
- (16) Davies J.J., Sabatini S., Roberts S., 2004, PASA 21, 360
- (17) Ienna F., Pelló R., 2008, AA submitted
- (18) Ilbert O., Tresse L., Zucca E., et al., 2005, AA 439, 863
- (19) Ilbert O., Arnouts S., McCracken H.J., et al., 2006, AA 457, 841
- (20) Kinney A. L., Calzetti D., Bohlin R. C., et al, 1996, ApJ 467, 38
- (21) Kodama T., Arimoto N., 1997, AA 320, 41
- (22) Kravtsov A.V., Gnedin O.Y., Klypin A.A., 2004, ApJ 609, 482
- (23) López-Cruz O., Barkhouse W.A., Yee H.K.C., 2004, ApJ 614, 679
- (24) McCracken H.J., Ilbert O., Mellier Y., et al., 2008, AA 479, 321
- (25) Neumann D.M., Lumb D.H., Pratt G.W., Briel U.G., 2003, AA 400, 811
- (26) Roberts S., Davies J., Sabatini S., et al, 2004, MNRAS 352, 478
- (27) Roberts S., Davies J., Sabatini S., Auld R., Smith R., 2007, MNRAS 379, 1053
- (28) Ulmer M.P., Bernstein G.M., Martin D. R., et al, 1996, AJ 112, 2517
- (29) van Eymeren J., Bomans D.J., Weis K., Dettmar R.-J., 2007, AA 474, 67
- (30) White S.D.M., Rees M.J., 1978, MNRAS 183, 341
- (31) White S.D.M., Frenk C.S., 1991, ApJ 379, 52
- (32) Wu X., Farnaey B., Gentile G., et al.., 2008, MNRAS 386, 2199
- (33) Yoshida M., Yagi M., Komiyama Y., et al., 2008, arXiv:0807.2573