Chandra and Swift observations of the quasi-persistent neutron star transient EXO 0748–676 back to quiescence
Abstract
The quasi-persistent neutron star X-ray transient and eclipsing binary EXO 0748–676 recently started the transition to quiescence following an accretion outburst that lasted more than 24 years. We report on two Chandra and twelve Swift observations performed within five months after the end of the outburst. The Chandra spectrum is composed of a soft, thermal component that fits to a neutron star atmosphere model with keV, joined by a hard powerlaw tail that contributes of the total 0.5-10 keV unabsorbed flux. The combined Chandra/Swift data set reveals a relatively hot and luminous quiescent system with a temperature of keV and a bolometric thermal luminosity of . We discuss our results in the context of cooling neutron star models.
keywords:
accretion, accretion disks - binaries: eclipsing - stars: individual (EXO 0748-676) - stars: neutron - X-rays: binaries1 Introduction
Neutron star X-ray transients spend the vast majority of their time in quiescence, in which they are dim with typical luminosities of erg s-1, but occasionally show an immense X-ray brightening in which their luminosity can rise to levels of erg s-1 (e.g., Chen et al., 1997). Their quiescent X-ray spectra are observed to consist of one or two components; a soft, thermal component ( keV), and/or a hard power-law tail (dominating above 2 keV, photon index 1-2; e.g., Asai et al., 1996).
Several explanations have been put forward to describe the quiescent emission of neutron star transients, such as low-level accretion (e.g., Zampieri et al., 1995; Menou et al., 1999) or emission mechanisms connected to the magnetic field of the neutron star (see e.g., Campana, 2003). However, the soft spectral component is most often interpreted as thermal emission emerging from the neutron star surface (Brown et al., 1998). During accretion outbursts, a series of nuclear reactions deposit heat in the neutron star crust (e.g., Haensel & Zdunik, 1990, 2008; Gupta et al., 2007), which spreads over the neutron star. The gained heat is radiated as thermal emission from the surface once the system returns to quiescence. In this interpretation the quiescent thermal emission depends on the time-averaged accretion rate of the system (e.g., Brown et al., 1998), as well as on the neutrino emission mechanism that operates in the core, which regulates the cooling (e.g., Yakovlev et al., 2003).
There exists a small group of quasi-persistent X-ray transients, which undergo prolonged accretion outbursts with a duration of years to decades rather than the usual weeks to months (e.g., Wijnands, 2004a). In these systems, the neutron star crust is substantially heated and becomes thermally decoupled from the core. Once the outburst ends, the crust will cool down primarily through heat conduction towards the core, until eventually thermal equilibrium is re-established (e.g., Rutledge et al., 2002a). This thermal relaxation depends strongly on the properties of the crust, such as the thermal conductivity.
In recent years, the quasi-persistent X-ray binaries KS 1731–260 and MXB 1659–29 have been monitored during the transition towards quiescence with Chandra and XMM-Newton following accretion outbursts with a duration of and yrs respectively (Wijnands et al., 2001, 2002, 2003, 2004b; Cackett et al., 2006, 2008). For both systems, these observations revealed a lightcurve that decayed exponentially from a bolometric luminosity of a few months after the outburst, leveling off to several years later (Cackett et al., 2006, 2008). Whereas the initial stages of this decaying curve are set by the properties of the crust, the quiescent base level reflects the thermal state of the core (e.g., Brown & Cumming, 2008). Confronting the observed cooling curves with thermal evolution models suggests that the neutron stars in both KS 1731–260 (Shternin et al., 2007) and MXB 1659–29 (Brown & Cumming, 2008) have a highly conductive crust. This idea is supported by theoretical plasma simulations of Horowitz et al. (2007), who demonstrated that the accreted matter will arrange itself in a lattice structure with a high thermal conductivity.
1.1 EXO 0748–676
Recently, the quasi-persistent neutron star X-ray transient EXO 0748–676 also started the transition to quiescence. This low-mass X-ray binary was initially discovered with EXOSAT in February 1985 (Parmar et al., 1986), although it appears as an EXOSAT slew survey source several times before this date (Reynolds et al., 1999, the earliest detection dates back to 1984 July 15). Prior to its discovery, EXO 0748–676 was serendipitously observed with EINSTEIN in May 1980, from which Garcia & Callanan (1999) deduced a 0.2 keV blackbody source spectrum with a 0.5-10 keV luminosity of . The system displays X-ray dips and exhibits eclipses with a duration of min every 3.82 hr (Parmar et al., 1986).
Since its discovery, EXO 0748–676 has been consistently detected with luminosities exceeding by various satellites. In particular, regular monitoring with RXTE has shown that the source maintained a relatively steady 2-20 keV flux of since 1996 (; Wolff et al., 2008a). However, observations with the Proportional Counter Array (PCA) obtained on 2008 August 12 signaled a decrease in 2-20 keV source flux down to (; Wolff et al., 2008a). This decline was confirmed when Swift observations with the X-ray Telescope (XRT) performed on 2008 September 28 found the source at a 0.5-10 keV flux of (see Table 2, ). The next set of RXTE/PCA observations, carried out on 2008 October 5, failed to detect EXO 0748–676 (Wolff et al., 2008b), consistent with the flux level observed with Swift/XRT. Optical and near-IR observations performed in October 2008 of the optical counterpart of EXO 0748–676, UY Vol, detected a decrease in its optical brightness compared with the active X-ray state (Hynes & Jones, 2008; Torres et al., 2008).
The observed large decline in X-ray and optical luminosity suggest that EXO 0748–676 is returning to quiescence after having actively accreted for 24 yrs. With its long outburst duration, EXO 0748–676 is a good candidate to look for thermal relaxation of the accretion heated neutron star crust now that the system is returning to quiescence. In this Letter we report on Chandra and Swift observations of EXO 0748–676 performed within the first five months after the accretion outburst ceased.
2 Observations, analysis and results
2.1 Chandra data
As part of our Chandra Target of Opportunity (TOO) proposal EXO 0748–676 was observed with Chandra/ACIS-S on 2008 October 12-13 22:09-02:51 UTC (obsID 9070) and on 2008 October 15 12:46-17:13 UTC (obsID 10783), for on-source times of respectively. We used the CIAO tools (v. 4.0) and standard Chandra analysis threads to reduce the data. No background flares were found, so all data were used for further analysis. The ACIS-S3 CCD was operated in a 1/8 sub-array to circumvent any possible pile-up problems. For the resulting frame-time of 0.4 s and the observed fluxes (see Table 1), the pile-up fraction was .
Source spectra and lightcurves were extracted from a circular region with a radius of 3″ centered on the position of EXO 0748–676. Background events were obtained from an annular region with an inner (outer) radius of 10″ (25″). The lightcurves of both Chandra observations display one eclipse at times consistent with the ephemeris of Wolff et al. (2008c). During the eclipses, only one photon was detected from the source region and a similar amount was found for the normalized background. This indicates that X-rays from the neutron star are not detected during the eclipses. To calculate the correct non-eclipse time-averaged fluxes, we reduced the exposure times of the fits files by 500 s (the approximate duration of the eclipses; Parmar et al., 1986; Wolff et al., 2008c). Using the FTOOL grppha we re-binned the spectra to contain a minimum of 20 photons per bin.
| Parameter | 5.0 kpc | 5.0 kpc | kpc | kpc | 5.0 kpc | 5.0 kpc | kpc | kpc | |
|---|---|---|---|---|---|---|---|---|---|
| (eV) | |||||||||
| (1.4) | (1.4) | (1.4) | (1.4) | (1.4) | (1.4) | ||||
| (10) | (10) | ||||||||
| (0.5-10 keV) | |||||||||
| (0.01-100 keV) | |||||||||
| (0.01-100 keV) | |||||||||
-
Note. – The quoted errors represent 90% confidence levels and the reduced for all fits is 1.1 (for 173 dof). represents the total unabsorbed 0.5-10 keV flux, while gives the bolometric NSATMOS flux (both in units of ). is the bolometric luminosity (for the model distance) of the NSATMOS component in units of .
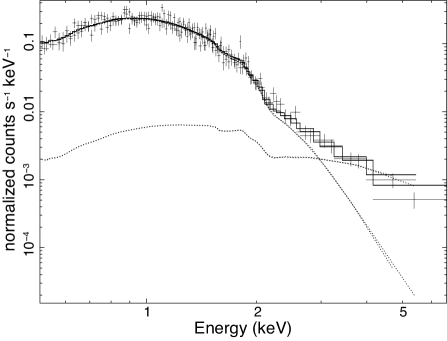
The resulting spectra were fitted using XSPEC (v. 12.0; Arnaud, 1996). The Chandra observations were performed days apart, and we did not find any significant spectral changes between the two when fitting the data sets separately. Therefore, we tied all spectral parameters between the two observations. We fitted the data with a neutron star atmosphere model NSATMOS (Heinke et al., 2006). The normalisation of this model was always fixed to one, which corresponds to the entire neutron star surface emitting. Using only the NSATMOS model, the data above keV cannot be fit properly. If we add a powerlaw component, this improves a fit with the neutron star mass and radius fixed at and km from to (an F-test suggests a probability of achieving this level of improvement by chance). The NSATMOS model calculates the effective temperature in the neutron star frame. We converted this to the effective temperature as seen by an observer at infinity according to , where is the gravitational redshift parameter, is the gravitational constant and the speed of light.
When the neutron star mass and radius are fixed to canonical values of and km, the best-fit yields kpc, , and eV. The fitted distance is lower than the best estimate of 7.4 kpc (with an allowed range of 5-8.3 kpc), which was inferred from analysis of type-I X-ray bursts (Galloway et al. 2008a, but see Galloway et al. 2008b for possible additional uncertainties). If we keep the mass and radius at canonical values and in addition fix the distance to either D=7.4 kpc or D=8.3 kpc, we obtain . However, for kpc we obtain , and eV.
Finally, we explored fits with the distance fixed at 5, 7.4 or 8.3 kpc, but with either the mass or the radius left to vary freely (and the other kept at its canonical value). Since the powerlaw slope is not well constrained, this parameter was fixed to or . The free parameters for each fit are then the hydrogen column density (), the effective temperature (), the normalization of the powerlaw component and either the mass () or radius ().
We deduced unabsorbed fluxes in the 0.5-10 keV energy band and calculated the bolometric flux of the thermal component by extrapolating the NSATMOS model (using a zero normalization for the powerlaw) for the energy range 0.01-100 keV. The powerlaw contribution to the total 0.5-10 keV unabsorbed flux is for the fits with and if . The results are summarized in Table 1. For kpc and kpc the fits with the radius fixed at km resulted in neutron star masses of , i.e., exceeding the causality limit of for a neutron star radius of 10 km; these fits are not listed in Table 1. The spectra of both Chandra observations are plotted in Figure 1.
| ObsID | Date | Exposure time (ks) | (eV) | () | Red. | ||
|---|---|---|---|---|---|---|---|
| 51300025 | 2008-09-28 | 0.93 | 1.7 (2 dof) | ||||
| 31272001* | 2008-10-07 | 1.49 | 0.1 (2 dof) | ||||
| 31272003/4* | 2008-10-29/30 | 5.01 | 1.4 (10 dof) | ||||
| 31272005* | 2008-11-02 | 4.78 | 1.4 (10 dof) | ||||
| 31272007 | 2008-11-28 | 3.04 | 1.0 (5 dof) | ||||
| 31272008* | 2008-12-05 | 3.40 | 0.8 (6 dof) | ||||
| 31272009 | 2008-12-20 | 4.22 | 1.9 (9 dof) | ||||
| 31272012 | 2009-01-10 | 3.71 | 1.1 (7 dof) | ||||
| 31272013 | 2009-01-16 | 4.16 | 1.2 (8 dof) | ||||
| 31272014 | 2009-01-23 | 1.45 | 0.1 (1 dof) | ||||
| 31272015* | 2009-01-30 | 3.95 | 0.8 (8 dof) |
-
Note. – The quoted errors represent 90% confidence levels. represents the 0.5-10 keV total model flux (described in the text) and gives the 0.01-100 keV NSATMOS flux (both unabsorbed and in units of ). gives the 0.01-100 keV luminosity of the NSATMOS model component (assuming a source distance of 7.4 kpc). The exposure times of observations marked with an asterisk were corrected for (parts of) eclipses.
2.2 Swift data
In addition to the Chandra data, we obtained Swift/XRT TOO observations of EXO 0748–676 returning to quiescence (see Table 2 for an overview). The XRT data, collected in the Photon Counting mode, were processed using standard Swift analysis threads. We extracted source spectra (using Xselect v. 2.3) from a circular region with a radius of 15″, while background spectra were obtained from an annular region with an inner (outer) radius of 50″ (100″). The spectra were grouped to contain bins with a minimum number of 10 photons. We reduced the exposure times of those observations that contained eclipses according to the ephemeris of Wolff et al. (2008c) to calculate the correct non-eclipse time-averaged fluxes (see Table 2).
We fitted all grouped Swift spectra with a combined NSATMOS and powerlaw model, were we fixed all parameters except the effective temperature. Different fits to the Chandra spectral data yield similar values, so there is no preferential model to use for the Swift data (see Table 1). We picked the fit with kpc (the best distance estimate), , , and . The powerlaw normalization was adjusted for each observation so that this component contributes of the total 0.5-10 keV flux. To improve the statistics, we tied the spectral parameters between observations 31272003 and 31272004, which were performed only one day apart. The results are presented in Table 2.
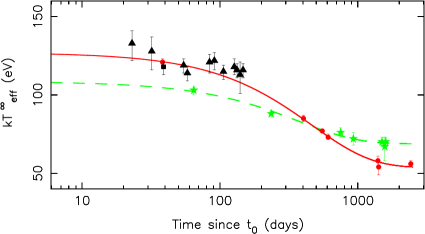
Figure 2 displays the effective temperatures and thermal bolometric fluxes derived from the Chandra and Swift data. The Chandra observations (obtained days apart) are plotted as a single data point (with an error on the time to indicate the spread of the two observations). The Swift observations 31272003 and 31272004 are also plotted as a single point. The bottom panel displays the evolution of the effective temperature of EXO 0748–676 together with the data points and curve fits of KS 1731–260 and MXB 1659–29 (taken from Cackett et al., 2006, 2008). Cackett et al. (2006) set the reference time, , for KS 1731–260 and MXB 1659–29 to the day of the last detection with RXTE/PCA. For EXO 0748–676 we set at 2008 September 5, which is in between the last detection with RXTE/PCA (August 12) and the first Swift observation (September 28).
3 Discussion
We obtained two Chandra and twelve Swift observations within five months after the cessation of the very long (24 yrs) active period of EXO 0748–676. We found (assuming a neutron star atmosphere model NSATMOS) a relatively hot and luminous quiescent system with a temperature of keV and a thermal bolometric luminosity of . In addition to a soft, thermal component, the Chandra data reveal a hard powerlaw tail, which contributes to the total 0.5-10 keV luminosity of .
Comparing the evolution of the effective temperature of EXO 0748–676 with that of KS 1731–260 and MXB 1659–29 (bottom panel Figure 2) illustrates that the current data of EXO 0748–676 is consistent with the fit through the data of MXB 1659–29 (as well as with KS 1731–260 if the temperatures would be scaled). This suggests that the neutron star crust may thermally relax in the coming years, revealing a cooling curve as has been observed for KS 1731–260 and MXB 1659–29. The current data set can then provide an unique insight into the early stages of neutron star cooling, and can possibly put constraints on the amount of heating in the outer crustal layers (Brown & Cumming, 2008).
However, the top and middle panel of Figure 2 suggest that the effective temperature and thermal bolometric flux of EXO 0748–676 have not decreased during the past three months (see also Table 2). The 0.5-10 keV luminosity remains approximately constant at , which is close to the value deduced from an Einstein observation in 1980 (see Section 1.1). There are several explanations that can account for the current high luminosity of EXO 0748–676 and are consistent with the Einstein detection of EXO 0748–676 in 1980.
Firstly, we cannot exclude the possibility that we detect low-level accretion from EXO 0748–676, since the resulting radiation spectrum may have a shape similar to that expected from crustal heating (e.g., Zampieri et al., 1995). We made Fast Fourier Transforms of the Chandra data (excluding the eclipses), but did not find any short-timescale ( sec) variability that might indicate continued accretion (Rutledge et al., 2002b).
If the observed thermal emission is due to crustal heating, then the constant luminosity might imply that the crust and core have already reached thermal equillibrium. The neutron star in EXO 0748–676 would then be relatively hot compared to other quiescent systems (see e.g., figure 4 of Heinke et al., 2009). Such a high quiescent luminosity can be explained by standard core cooling. Since enhanced neutrino emission mechanisms are suppressed only when the density in the core is relatively low, this scenario would imply that the neutron star in EXO 0748–676 is not very massive and has not had enough time to accrete a significant amount of matter (the exact mass limit for enabling enhanced core cooling mechanisms is model dependent).
A high time-averaged mass-accretion rate can also give rise to a high quiescent luminosity. Parmar et al. (1986) stated that between 1970 and 1980 no outburst reaching was observed for EXO 0748–676 using Uhuru, Ariel V and HEAO-1, indicating that in the 10 yrs prior to the Einstein detection the source was in quiescence (at least, no similar long outburst as the most recent one occurred; shorter outbursts of weeks or even months cannot be excluded). Besides this, we cannot put any additional constraints on the duty cycle of EXO 0748–676. Normally, X-ray transients reside significantly longer in quiescence than in outburst, but for EXO 0748–676 the quiescence state might be similar in duration to the outburst episodes. The neutron star core temperature could then be maintained by repeated accretion episodes at a significantly higher level than would be the case if it would spend most of its time in quiescence.
Furthermore, a high quiescent luminosity can be accounted for if the neutron star crust has a low thermal conductivity, so that it will cool on a time scale of decades rather than a few years and remains hot for a long time (Rutledge et al., 2002a; Shternin et al., 2007). A drawback of this explanation is that there is no obvious reason why the neutron star in EXO 0748–676 would be so different in this respect from KS 1731–260 and MXB 1659–29, for which a low crust conductivity can be ruled out (Shternin et al., 2007; Brown & Cumming, 2008). This would also oppose independent molecular dynamics simulations that predict a regular crystal lattice structure (Horowitz et al., 2007).
More Chandra observations of EXO 0748–676 are scheduled for this year and these will provide insight into the different scenarios discussed above.

Acknowledgments
We are grateful to the referee, Nathalie Webb, for very useful comments. This work was supported by NWO. We acknowledge the use of the Swift public data archive. EMC was supported by NASA through the Chandra Fellowship Program. MTW, PSR and KSW acknowledge the United States Office of Naval Research. J.H. and W.H.G.L. gratefully acknowledge support from Chandra grant GO8-9045X.
References
- Arnaud (1996) Arnaud K. A., 1996, ASPC, 101, 17
- Asai et al. (1996) Asai K., Dotani T., Mitsuda K., Hoshi R., Vaughan B., Tanaka Y., Inoue H., 1996, PASJ, 48, 257
- Brown et al. (1998) Brown E. F., Bildsten L., Rutledge R. E., 1998, ApJ Lett, 504, L95
- Brown & Cumming (2008) Brown E. F., Cumming A., 2008, ApJ, submitted, preprint 0901.3115
- Cackett et al. (2006) Cackett E. M., Wijnands R., Linares M., Miller J. M., Homan J., Lewin W. H. G., 2006, MNRAS, 372, 479
- Cackett et al. (2008) Cackett E. M., Wijnands R., Miller J. M., Brown E. F., Degenaar N., 2008, ApJL, 687, L87
- Campana (2003) Campana S., 2003, ArXiv e-print astro-ph/0311212
- Chen et al. (1997) Chen W., Shrader C. R., Livio M., 1997, ApJ, 491, 312
- Galloway et al. (2008a) Galloway D. K., Muno M. P., Hartman J. M., Psaltis D., Chakrabarty D., 2008a, ApJS, 179, 360
- Galloway et al. (2008b) Galloway D. K., Özel F., Psaltis D., 2008b, MNRAS, 387, 268
- Garcia & Callanan (1999) Garcia M. R., Callanan P. J., 1999, AJ, 118, 1390
- Gupta et al. (2007) Gupta S., Brown E. F., Schatz H., Möller P., Kratz K.-L., 2007, ApJ, 662, 1188
- Haensel & Zdunik (1990) Haensel P., Zdunik J. L., 1990, A&A, 229, 117
- Haensel & Zdunik (2008) Haensel P., Zdunik J. L., 2008, A&A, 480, 459
- Heinke et al. (2006) Heinke C. O., Rybicki G. B., Narayan R., Grindlay J. E., 2006, ApJ, 644, 1090
- Heinke et al. (2009) Heinke C. O., Jonker P. G., Wijnands R., Deloye C. J., Taam R. E., 2009, ApJ, 691, 1035
- Horowitz et al. (2007) Horowitz C. J., Berry D. K., Brown E. F., 2007, PhRvE, 75, 066101
- Hynes & Jones (2008) Hynes R., Jones E., 2008, ATel, 1816, 1
- Menou et al. (1999) Menou K., Esin A. A., Narayan R., Garcia M. R., Lasota J.-P., McClintock J. E., 1999, ApJ, 520, 276
- Parmar et al. (1986) Parmar A. N., White N. E., Giommi P., Gottwald M., 1986, ApJ, 308, 199
- Reynolds et al. (1999) Reynolds A. P., Parmar A. N., Hakala P. J., Pollock A. M. T., Williams O. R., Peacock A., Taylor B. G., 1999, AAPS, 134, 287
- Rutledge et al. (2002a) Rutledge R. E., Bildsten L., Brown E. F., Pavlov G. G., Zavlin V. E., Ushomirsky G., 2002a, ApJ, 580, 413
- Rutledge et al. (2002b) Rutledge R. E., Bildsten L., Brown E. F., Pavlov G. G., Zavlin V. E., 2002b, ApJ, 577, 346
- Shternin et al. (2007) Shternin P. S., Yakovlev D. G., Haensel P., Potekhin A. Y., 2007, MNRAS, 382, L43
- Torres et al. (2008) Torres M. A. P., Jonker P. G., Steeghs D., Seth A. C., 2008, ATel, 1817, 1
- Wijnands et al. (2001) Wijnands R., Miller J. M., Markwardt C., Lewin W. H. G., van der Klis M., 2001, ApJ Lett, 560, L159
- Wijnands et al. (2002) Wijnands R., Guainazzi M., van der Klis M., Méndez M., 2002, ApJ Lett, 573, L45
- Wijnands et al. (2003) Wijnands R., Nowak M., Miller J. M., Homan J., Wachter S., Lewin W. H. G., 2003, ApJ, 594, 952
- Wijnands (2004a) Wijnands R., 2004a, ArXiv e-print astro-ph/0405089
- Wijnands et al. (2004b) Wijnands R., Homan J., Miller J. M., Lewin W. H. G., 2004b, ApJ Lett, 606, L61
- Wolff et al. (2008a) Wolff M. T., Ray P. S., Wood K. S., 2008a, ATel, 1736, 1
- Wolff et al. (2008b) Wolff M. T., Ray P. S., Wood K. S., Wijnands R., 2008b, ATel, 1812, 1
- Wolff et al. (2008c) Wolff M. T., Ray P. S., Wood K. S., Hertz P. L., 2008c, ApJS, in press, preprint 0812.1034
- Yakovlev et al. (2003) Yakovlev D. G., Levenfish K. P., Haensel P., 2003, A&A, 407, 265
- Zampieri et al. (1995) Zampieri L., Turolla R., Zane S., Treves A., 1995, ApJ, 439, 849