-
The Barium Isotopic Abundance in the Metal-Poor Star HD140283
Abstract: We derive the mixture of odd to even barium isotopes in the atmosphere of the metal-poor subgiant HD140283 from the analysis of the Ba ii transition at 4554 Å in a high-resolution high signal-to-noise spectrum of the star. The detailed shape of this spectral line depends on the relative contributions of odd and even isotopes via isotopic and hyperfine splitting. We measure the fractional abundance of odd Ba isotopes by modelling the formation of the Ba ii 4554 Å line profile with the use of both a classical 1D hydrostatic and a 3D hydrodynamical model atmosphere of HD140283. We interpret the results in terms of contributions by the slow (-) and rapid (-) neutron-capture processes to the isotopic mix. While the result of the 1D analysis of the Ba ii feature indicates a % contribution of the -process to the isotopic mix, the 3D analysis points toward a mere % contribution from this process, that is consistent with a solar-like mixture of barium isotopes.
Keywords: hydrodynamics — line: profiles — stars: atmospheres — stars: abundances — stars: individual: HD140283.
1 Introduction
Elements beyond the Fe peak are predominantly produced through successive neutron-capture reactions in two processes known as the slow (-) and the rapid (-) process. The distinction between the - and - process depends on whether the time-scale for neutron captures is longer or shorter, respectively, than the time-scale of radioactive decay of freshly synthesized unstable nuclei. Observational evidence and theoretical studies have identified the -process site in low- to intermediate-mass (– M⊙) stars in the asymptotic giant branch (AGB). In particular, the He-shell of thermally pulsating low-mass AGB stars is believed to be the site of the so-called main -process, which synthesizes nuclides heavier than Sr (see, e.g., Busso et al. 1999). The -process instead is usually associated with the explosive environment of Type II supernovae (SNeII), although this astrophysical site hasn’t been fully confirmed yet (see, e.g., Sneden et al. 2008).
Massive stars that end their evolution as SNeII are shorter-lived compared with low-mass stars that eventually evolve into the AGB phase. One therefore expects the -process to dominate the enrichment of the interstellar medium (ISM) in terms of heavy elements during the early stages of Galactic chemical evolution111Assuming, of course, that SNeII indeed are the site of the -process. According to this picture, the oldest most metal-poor stars should then only contain heavy elements in the relative proportions determined by the -process (Truran 1981).
Magain (1995) used a novel approach to infer the relative contributions of the - and -process spectroscopically by looking at the detailed shape of the Ba ii Å resonance line. The odd Ba isotopes contribute to broaden the line and alter the symmetry of its profile via hyperfine splitting. As the - and -process produce rather different mixtures of odd and even Ba isotopes, the actual width and shape of the Ba ii Å line are therefore dependent on the relative contribution of the two neutron-capture processes. Based on the analysis of solar abundances (Anders & Grevesse 1989) by Arlandini et al. (1999), one expects a value of for the fractional abundance of the odd isotopes of barium222, in case of a pure -process mixture, and in case of a pure -process one. Magain challenged the Galactic chemical evolution scenario depicted above by deriving a fractional abundance of odd Ba isotopes for the metal-poor subgiant HD140283 ([Fe/H]): this value is fully compatible with a pure -process production and excludes any significant contribution from the -process. Magain’s result cannot indeed be reconciled with the predictions of standard Galactic chemical evolution models (e.g., Travaglio et al. 1999) which indicate that the -process signature in stars should become manifest only at higher metallicities ([Fe/H]). More recently, Lambert & Allende Prieto (2002) re-observed and re-analysed the Ba ii Å line in the spectrum of HD140283 and derived, in contrast to Magain, a fractional abundance of odd Ba isotopes , consistent with a pure -process isotopic mixture. Lambert & Allende Prieto (2002) used a spectrum of superior quality than Magain’s both in terms of resolution () and signal-to-noise ratio (S/N); their analysis, however, was still based on 1D model stellar atmospheres.
Classical spectroscopic analyses based on 1D model atmospheres, however, rely on a number of tunable fudge parameters. In particular, they cannot account for Doppler broadening due to photospheric convective motions without introducing the micro- and macro-turbulence parameters. Moreover, convective flows also induce asymmetries and overall wavelength shifts in spectral line profiles, which cannot be reproduced by ordinary 1D analyses.
Three-dimensional hydrodynamical simulations of stellar surface convection, on the other hand, can self-consistently predict photospheric velocity fields and correlated temperature and density inhomogeneities (Stein & Nordlund 1998; Asplund et al. 1999); line shapes, asymmetries, and wavelength shifts can be accurately reproduced by using such simulations as 3D hydrodynamical model atmospheres, without relying on ad hoc free parameters (Asplund et al. 2000). In the present contribution, we re-derive the fractional abundance of the odd Ba isotopes in HD140283 by means of both a 1D and a 3D analysis of the Ba ii Å line in the spectrum obtained by Lambert & Allende Prieto (2002) at the W. J. McDonald Observatory (Mt Locke, Texas). In particular, we use a 3D model atmosphere of the metal-poor subgiant star to adequately disentangle the contributions of photospheric convective flows and hyperfine splitting to the broadening and asymmetry of the Ba ii Å line.
| Isotope | Wavelength (Å) | Relative strength |
|---|---|---|
| 134Ba: | 4554.0314 | 1.0000 |
| 135Ba: | 4554.0003 | 0.1563 |
| 4554.0015 | 0.1562 | |
| 4554.0019 | 0.0625 | |
| 4554.0473 | 0.4375 | |
| 4554.0500 | 0.1563 | |
| 4554.0512 | 0.0313 | |
| 136Ba: | 4554.0317 | 1.0000 |
| 137Ba: | 4553.9975 | 0.1563 |
| 4553.9986 | 0.1562 | |
| 4553.9988 | 0.0625 | |
| 4554.0498 | 0.4375 | |
| 4554.0531 | 0.1563 | |
| 4554.0542 | 0.0313 | |
| 138Ba: | 4554.0330 | 1.0000 |
2 Methods
We synthesize the Ba ii Å line profile with the help of both a 1D and a 3D model atmosphere of HD140283, varying the Ba isotopic mixture to produce the best fit to the observed feature. We account for the isotopic and hyperfine splitting components of the Ba ii Å line listed in table 1. Isotopic wavelength shifts are actually too small to be resolved even with the highest-resolution spectrographs currently available: in the present analysis, therefore, we effectively do not make any distinction between the even isotopes as well as between the three odd isotopes.
For the 1D analysis, we employ a plane-parallel hydrostatic LTE marcs model atmosphere (Gustafsson et al. 1975; Asplund et al. 1997) of the subgiant star with the following stellar parameters: K, (cgs), and [Fe/H]. Spectral line profiles are computed under the assumption of LTE. We stress that, contrary to the overall barium abundance, isotopic abundances derived from the Ba ii Å line are expected to be insensitive to departures from LTE and to the actual choice of stellar parameters. In the 1D calculations, we adopt a micro-turbulence km s-1, based on the LTE analysis of the Fe i and Fe ii lines given in Tab. 2 of Lambert & Allende Prieto (2002). With the above value, the iron abundance becomes independent from the equivalent width and chemical equilibrium is fulfilled ( and ).
Before proceeding with the synthesis of the Ba ii Å line we need to estimate the broadening from mechanisms other than hyperfine splitting. In order to do this, we fit the Fe lines from the same sample used by Lambert & Allende Prieto (2002) (Tab. 3 in their article) by assuming a rotational velocity km s-1 and varying the iron abundance, the central wavelength, and the FWHM of a Gaussian which we use toconvolve the line profiles. The convolution with a Gaussian accounts for macro-turbulent and instrumental broadening (and, possibly, residual rotational broadening). We account for natural and linear Stark broadening and we model collisional broadening with neutral hydrogen atoms using the quantum mechanical calculations by Barklem et al. (2000). From the analysis of the Fe lines, we derive an average value of km s-1 for the FWHM of the Gaussian broadening. Using this estimate of the Gaussian broadening, we compute synthetic flux profiles of the Ba ii Å line for different barium isotopic mixtures. We quantify the comparison between the theoretical and observed profiles by means of a -analysis similar to the one carried out by Asplund et al. (1999) to investigate 6Li/7Li ratios in metal-poor halo stars. We compute the according to the expression , with and denoting the observed and synthetic flux at wavelength point , respectively, and is the inverse signal-to-noise ratio. The most likely isotopic mix is the one that minimizes .
For the 3D analysis, we use a simulation of stellar surface convection by Asplund et al. (1999), constructed for the same stellar parameters as for the 1D case, as a time-dependent 3D hydrodynamical model atmosphere. We select a -minute long sequence of simulation snapshots sampled at regular time intervals and downgrade the resolution of the original simulation to grid-points prior to the spectral line formation calculations. We compute LTE flux profiles in 3D by solving the radiative transfer equation along rays (four -angles, eight -angles, and the vertical) for all grid-points at the surface, performing then a disk integration and a time average over all snapshots. As we already account for the effect of Doppler shifts induced by the velocity fields in the 3D simulation, we ignore altogether the micro- and macro-turbulence parameters. We then determine the amount of broadening contributed by processes other than hyperfine splitting: we fit the profiles of the Fe lines similarly as in the 1D analysis above but varying the rotational velocity instead of the Gaussian broadening, which, in 3D, we keep fixed and equal to the instrumental broadening (corresponding roughly to a FWHM km s-1, as estimated from the resolution of the observed spectrum). Natural and collisional broadening are included and treated in the same way as in the 1D calculations. From the 3D analysis of the Fe lines, we estimate an average rotational velocity of km s-1. We then follow the same -minimization procedure as in the 1D analysis to determine the most probable barium isotopic mix from the fitting of the observed Ba ii Å line profile.
3 Results
3.1 1D analysis
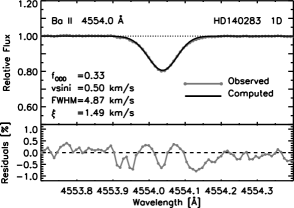
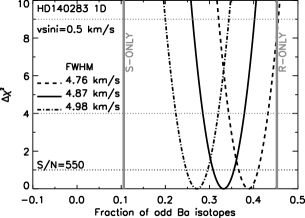
Figure 1 shows the best-fitting synthetic profile to the observed Ba ii Å line in the 1D case. The derived fractional abundance of odd Ba isotopes in 1D is , which suggests a contribution predominantly from the -process (namely %) to the barium isotopic mix. Figure 2 shows the curves considered in the -minimization procedure. The , , and confidence limits correspond to , , and , respectively (indicated by the dotted lines in the figure). The half-width of the interval for which is a measure of the uncertainty in fractional abundance of odd isotopes due to the finite signal-to-noise; for S/N the uncertainty on is . Figure 2 also shows how the position of the minimum depends on the Gaussian broadening: a change of km s-1 translates into a change of in . The fractional abundance of odd Ba isotopes is also sensitive to the choice of micro-turbulence parameter (which affects the Gaussian broadening determination) and to the adopted surface gravity (which affects pressure broadening of the lines). For the present analysis, we adopt the estimates of and by Lambert & Allende Prieto (2002) of the errors on due to the uncertainties on micro-turbulence ( km s-1) and ( dex), respectively. Our estimated total uncertainty on is then which directly corresponds to an uncertainty in the contribution of -process fraction of Ba isotopes of about %.
3.2 3D analysis
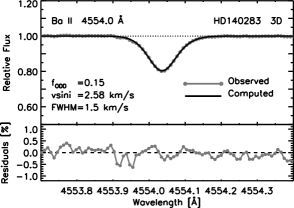
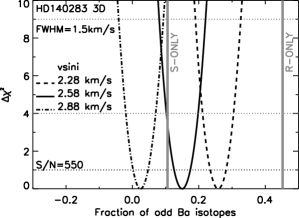
The best-fitting synthetic Ba ii Å line profile in the 3D analysis is shown in Fig. 3. It is clear from the comparison of the residuals, that the synthetic profile in 3D gives a significantly better fit to the observed spectral line than the synthetic 1D profile. The estimated fractional abundance of odd Ba isotopes in the 3D analysis is , which —contrary to the 1D case— points toward a predominantly -process isotopic mix (only % contribution from the -process). Figure 4 shows the curves considered for the -minimization procedure in the 3D analysis. Similarly as for the 1D case, we use the information in the figure to quantify the uncertainties on due to the finite signal-to-noise and the error on the estimated rotational velocity: these are and , respectively. For the error on due to the uncertainty on surface gravity, we adopt the same value as in the 1D case. We caution that a change in surface gravity in practice also affects the velocities predicted by the simulation. In this preliminary 3D analysis of the Ba ii Å line, however, we neglect this aspect; we defer the study of the effects of changes in stellar parameters on the estimate of the uncertainty on to a future and more comprehensive work. Finally, we do not consider any contribution to the error on from micro-turbulence, since this parameter is absent in the 3D analysis. The estimated total uncertainty on in the 3D analysis is then which directly corresponds to an uncertainty in the contribution of -process fraction of about %.
4 Discussion
The fractional abundance of odd Ba isotopes derived in the present 1D analysis is in excellent agreement with the result obtained by Lambert & Allende Prieto (2002). Contrary to the finding of Magain (1995), our 1D estimate of indicates a large contribution from the -process (%) to the barium isotopic mix in HD140283 and seems to exclude at a 3 level a pure -process contribution.
Interestingly, the 3D analysis of the same feature leads to a radically different result, namely that the Ba ii Å line profile is best-fitted assuming instead a solar-like barium isotopic mix with only a % (%) contribution from the -process. Moreover, in 3D, a pure -process isotopic mixture can be excluded at a 2 level from the analysis. The reason for the difference between the results of the 1D and 3D analyses is essentially due to the differences between the 1D and 3D modelling of line broadening and asymmetries as sketched in Sec. 2. For instance, in the 3D calculations, the simulation’s velocity fields naturally induce a “C-shaped” asymmetry in the flux profile of the line. This implies that a different fraction of odd barium isotopes is necessary in 3D comparing to the 1D case to properly model the shape of the Ba ii Å line profile. We would like to caution at this point the reader that the our result for HD140283 cannot be applied straightforwardly to the 1D analysis of the Ba ii Å feature in the spectra of other stars. The sign and magnitude of the 3D1D correction to the derived fractional abundance of odd isotopes may depend in general on the strength and detailed shape of the observed Ba ii Å profile.
Our 3D analysis of the Ba ii Å feature in the spectrum of HD140283 seems unable to settle down the controversy raised by Magain (1995) in favour of standard Galactic chemical evolution scenarios. On the contrary, our result seems to corroborate the possibility that the metal-poor star HD140283 possesses a strong -process signature in terms of isotopic Ba abundance against the expectations from theoretical models of Galactic chemical evolution. We would like to stress however that, although our and Magain’s result are apparently in agreement with each other, our finding is based on rather different premises. First, we rely on a higher-resolution and higher signal-to-noise spectrum, Second, we use a 3D hydrodynamical model atmosphere of the star to synthesize the profiles of the Ba ii Å feature and other Fe lines, which implies that our modelling of non-thermal broadening is more robust and, contrary to the 1D analysis, independent on the tunable micro- and macro-turbulence parameters.
As a final note, we cannot completely rule out the possibility that HD140283 has been polluted by -process material from an AGB star and may not be representative of halo stars at the same metallicity in terms of isotopic Ba abundance. Further investigation is therefore necessary to draw any significant comparison with Galactic chemical evolution models. We intend to extend in an upcoming paper the 3D1D analysis of the Ba ii Å feature to a larger sample of halo stars and study in particular the barium isotopic abundance as a function of metallicity.
Acknowledgments
The authors would like to thank C. Allende Prieto for kindly making parts of the McDonald spectrum of HD140283 available to us for the present analysis.
References
- Anders & Grevesse (1989) Anders, E. & Grevesse, N. 1989, Geochim. Cosmochim. Acta, 53, 197
- Arlandini et al. (1999) Arlandini, C., Käppeler, F., Wisshak, K., Gallino, R., Lugaro, M., Busso, M., & Straniero, O. 1999, ApJ, 525, 886
- Asplund et al. (1997) Asplund, M., Gustafsson, B., Kiselman, D., & Eriksson, K. 1997, A&A, 318, 521
- Asplund et al. (1999) Asplund, M., Nordlund, Å., Trampedach, R., & Stein, R. F. 1999, A&A, 346, L17
- Asplund et al. (2000) —. 2000, A&A, 359, 743
- Barklem et al. (2000) Barklem, P. S., Piskunov, N., & O’Mara, B. J. 2000, A&AS, 142, 467
- Busso et al. (1999) Busso, M., Gallino, R., & Wasserburg, G. J. 1999, ARA&A, 37, 239
- Gustafsson et al. (1975) Gustafsson, B., Bell, R. A., Eriksson, K., & Nordlund, Å. 1975, A&A, 42, 407
- Lambert & Allende Prieto (2002) Lambert, D. L. & Allende Prieto, C. 2002, MNRAS, 335, 325
- Magain (1995) Magain, P. 1995, A&A, 297, 686
- Sneden et al. (2008) Sneden, C., Cowan, J. J., & Gallino, R. 2008, ARA&A, 46, 241
- Stein & Nordlund (1998) Stein, R. F. & Nordlund, Å. 1998, ApJ, 499, 914
- Travaglio et al. (1999) Travaglio, C., Galli, D., Gallino, R., Busso, M., Ferrini, F., & Straniero, O. 1999, ApJ, 521, 691
- Truran (1981) Truran, J. W. 1981, A&A, 97, 391
- Villemoes et al. (1993) Villemoes, P., Arnesen, A., Heijkenskjöld, F., & Wännström, A. 1993, J. Phys. B, 26, 4289
- Wendt et al. (1984) Wendt, K., Ahmad, S. A., Buchinger, F., Mueller, A. C., Neugart, R., & Otten, E. W. 1984, Z. Phys. A, 318, 125