Molecular gas and star formation in the red-sequence counter-rotating disc galaxy NGC 4550
Abstract
We present observations of the CO(1-0) emission in the central 750 pc (10″) of the counter-rotating disc galaxy NGC 4550, obtained at the Institut de Radioastronomie Millimétrique (IRAM) Plateau de Bure Interferometer. Very little molecular gas is detected, only , and its distribution is lopsided, with twice as much molecular gas observed at positive relative velocities than at negative relative velocities. The velocity gradient in the CO(1-0) emission shows that the molecular gas rotates like the thicker of the two stellar discs, which is an unexpected alignment of rotations if the thinner disc was formed by a major gas accretion event. However, a simulation shows that the gas rotating like the thicker disc naturally results from the coplanar merger of two counter-rotating disc galaxies, demonstrating the feasibility of this scenario for the formation of NGC 4550. We investigate various star formation tracers to determine whether the molecular gas in NGC 4550 is currently forming stars. UV imaging data and optical absorption linestrengths both suggest a recent star formation episode; the best-fitting two population model to the UV-optical colours yields a mass of young stars of M☉ with an age of 280 Myr. The best information on the current star formation rate is a far infrared-based upper limit of only 0.02 M☉ yr-1. We are thus witnessing NGC 4550 either in a dip within a bursty star formation period or during a more continuous low-level star formation episode.
keywords:
galaxies: individual: NGC4550 – galaxies: elliptical and lenticular, cD – galaxies: ISM – ultraviolet: galaxies – galaxies: kinematics and dynamics – galaxies: stellar content1 Introduction
Deciphering star formation histories of early-type galaxies is important for understanding their formation and evolution. While early-type galaxies were traditionally considered to be simple single stellar populations, it is now clear that their star formation histories must be more complicated. Both absorption linestrengths (e.g. Trager et al., 2000) and UV-optical colours (Yi et al., 2005; Kaviraj et al., 2007) indicate that a significant portion of early-type galaxies have recently formed stars ( from the UV-optical colours). Reassuringly, molecular gas, the raw material for star formation, is also found in early-type galaxies (Henkel & Wiklind, 1997). Two recent surveys give detection rates of 28% for E/S0s in the SAURON sample (Combes, Young & Bureau, 2007) and 78% for S0s in a volume-limited sample (Sage & Welch, 2006).
NGC 4550 is an unusual galaxy (see Table 1), containing two coplanar counter-rotating stellar exponential discs with nearly identical scale lengths (Rubin, Graham & Kenney, 1992; Rix et al., 1992). However, integral field unit data shows that one disc is thicker and has a higher velocity dispersion than the other (Kenney et al., 2000; Emsellem et al., 2004). Schwarzschild modelling by Cappellari et al. (2007) confirms the difference in scale heights and additionally shows that the two discs have equal mass within the SAURON field-of-view. The presence of these two discs with different scale heights may cause the failure of some bulge-disc decompositions. Rix et al. (1992) find a bulge to disc ratio of only 0.19 while Scorza et al. (1998) report a ratio of 5. The Sérsic fit of Ferrarese et al. (2006) gives a best-fit Sérsic shape parameter of 1.7, demonstrating that the surface brightness profile is not dominated by a de Vaucouleurs bulge. With an effective colour of 0.890 mag, NGC 4550 is very likely a red sequence galaxy, which would make it one of a very small population of disc-dominated red-sequence galaxies.
Two main scenarios exist for explaining the counter-rotating stellar discs in NGC 4550. Rubin et al. (1992) first suggested that accretion of counter-rotating gas and subsequent star formation could create a second disc rotating as observed. This gas accretion scenario has been investigated by Thakar & Ryden (1998), who find it difficult to create extended, exponential gas discs in their simulations. However, recent observations of NGC 5719 show an extended counter-rotating and star-forming gas disc clearly accreted from external gas (Vergani et al., 2007), demonstrating the feasibility of this origin. The second scenario invokes a coplanar major merger of two counter-rotating disc galaxies. While requiring a precise alignment of the two discs to avoid excessive heating, this merger scenario has been shown to produce resultant galaxies resembling NGC 4550 (Puerari & Pfenniger, 2001).
The ionised gas in NGC 4550 co-rotates with the thicker disc (Rubin et al., 1992; Sarzi et al., 2006), not with the thinner, colder disc. An irregular dust distribution is also observed within the central 20″ in diameter. The dust is distributed in clumpy arcs and is stronger on the northern half of the galaxy (Wiklind & Henkel, 2001). HI observations have not detected neutral gas in NGC 4550, the strictest upper limit being from Duprie & Schneider (1996). Molecular gas was first discovered in NGC 4550 by Wiklind & Henkel (2001) using the IRAM 30m telescope. They reported a small mass of molecular gas, , noting that the distribution of the molecular gas is likely to resemble that of the dust, due to a strong asymmetry in the observed CO emission line toward positive relative velocities.
Here we present interferometric observations of the CO emission in NGC 4550, deriving the extent, kinematics and total mass of the molecular gas. To investigate what the kinematics of the gas reveal about the formation history of this unusual galaxy, we run a major merger simulation (importantly including gas) and describe the features of its evolution, comparing the results to observations. We also analyse various star formation indicators to determine whether the molecular gas in NGC 4550 alerts us to another early-type galaxy with ongoing star formation, or whether the molecular gas instead appears to be stable.
| Quantity | Value | Ref. |
|---|---|---|
| R.A. (J2000.0) | 12h 35m 30.6s | 1 |
| Dec. (J2000.0) | +12∘ 13 15 | 1 |
| Heliocentric velocity | km s-1 | 2 |
| Distance | Mpc | 3 |
| Scale | pc | 3 |
| Type | SB0 | 4 |
| Corrected apparent B mag | 5 | |
| Corrected absolute B mag | 5 | |
| (B-V)e | 0.89 | 5 |
| LB | L☉ | 6 |
| LFIR | L☉ | 6 |
| LFIR/LB | 6 | |
| LFIR/M | L☉/M☉ | 6 |
2 Plateau de Bure observations
2.1 Observations
| Type | Calibrators |
|---|---|
| Bandpass | 3C273 |
| Phase | 3C273, 1156+295 |
| Flux | 3C273, 1156+295, 0528+134, 3C84 |
NGC 4550 was observed in the 12CO(1-0) line with the IRAM Plateau de Bure Interferometer (PdBI) on August 10, 2007. The observations were taken in the D configuration with 5 antennas and used the new generation dual-polarization receivers at 3 mm. The spectral correlators were centred at 115.12 GHz, the transition frequency of CO(1-0) roughly corrected for the heliocentric velocity of NGC 4550. The correlator configuration used four 320 MHz-wide (834 km s-1) units with a frequency resolution of 2.5 MHz (6.6 km s-1), covering a total usable bandwidth of 950 MHz (2475 km s-1). The correlator was regularly calibrated by a noise source inserted in the IF system.
We obtained visibilities with series of thirty 45 s integrations on source, followed by three s phase and amplitude calibrations on each of the two phase calibrators (see Table 2). To flux calibrate, we set the flux density of 3C273 to the expected value (15 Jy), then checked that the fluxes found for the other flux calibrators were reasonable. The uncertainty in our flux calibration is %.
The data were reduced with the Grenoble Image and Line Data Analysis System (gildas) software packages clic and mapping (Guilloteau & Lucas, 2000). We calibrated the data using the standard pipeline in clic. After calibration, we used mapping to create data cubes centred at 115.104 GHz (corrected more precisely for a systemic velocity of 435 km s-1) with velocity planes separated by 20 km s-1. Natural weighting was used. The primary beam size is for CO(1-0) and we chose the spatial dimensions of the datacube to be about twice the diameter of the primary beam, . The synthesized beam is , so we choose spatial pixels of . Continuum subtraction was unnecessary (see below). The dirty beam has small side lobes that necessitated cleaning the datacube. The cleaning was done using the Högbom method (Högbom, 1974); we stopped cleaning in each velocity plane after the brightest residual pixel had a value lower than the rms noise of the uncleaned datacube.
To constrain the continuum emission, we selected frequencies at least 40 km s-1 away from the lowest and highest velocity channels with any line emission in the cleaned datacube (-80 and 80 km s-1, respectively). The very edges of the bandwidth were also avoided, resulting in a 683 MHz wide continuum window. We mapped this data with the same spatial parameters as the line data. No emission could be seen in the map with an rms noise of 0.54 mJy beam-1, giving a 3 upper limit of 1.62 mJy assuming a point source.
2.2 Results
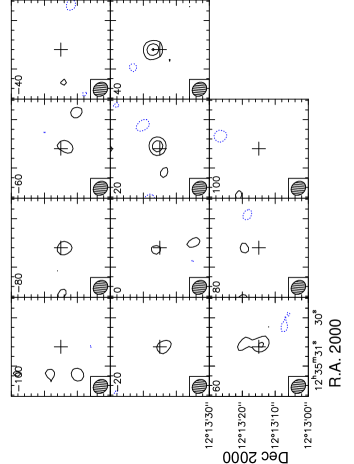
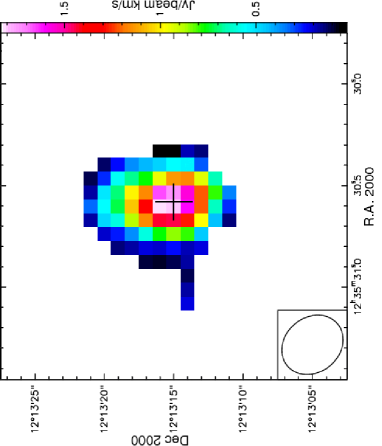
The channel maps (Fig. 1) show CO(1-0) emission around the galaxy centre. The emission is just over the 3 level, with stronger emission in the 20, 40 and 60 km s-1 channels. The channel velocity values are all given with respect to systemic velocity. In the channel maps, a mild velocity gradient is observed, with more of the emission at positive relative velocities to the north of the galaxy centre and more of the emission at negative relative velocities to the south. The 60 km s-1 channel is an exception with a peak slightly south of the galaxy centre, although the emission clearly also extends to the north. To pick up more extended emission, we created an integrated intensity map and a mean velocity field map (Fig. 2) using the smoothed-mask method. To make these maps, we first created a smoothed cube by smoothing with a 2D circular gaussian spatially (FWHM of 4″or about one synthesized beam width). Then we hanning smoothed by 3 channels in velocity. The moments were computed only using pixels in the original cube that corresponded to pixels above 3 in the smoothed cube.
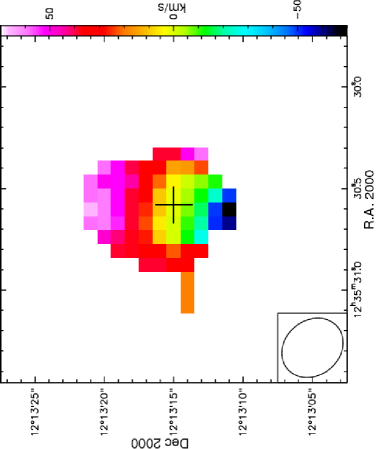
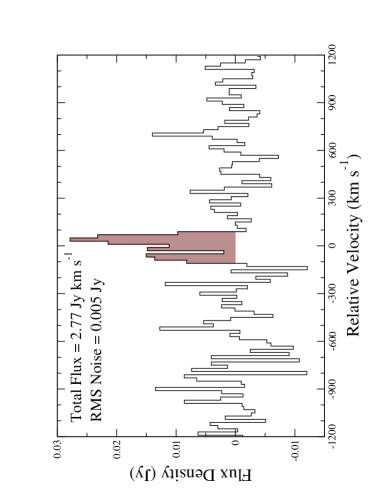
The integrated intensity map shows that the emission is limited to the central 750 pc (10″) in diameter and is slightly stronger in the north. The mean velocity map shows a north-south gradient, as expected from the shift observed in the channel maps. Assuming the velocity gradient indicates rotation around the centre of the galaxy, the molecular gas rotates like the observed ionized gas and the thicker disc. Spatially integrating the entire datacube over the region with observed emission results in the spectrum shown in Fig. 3. This spectrum shows that the emission is present in all channels between -80 and 80 km s-1, but is strictly limited to these channels.
While the lopsidedness of the CO emission was discovered by Wiklind & Henkel (2001), the degree of asymmetry was exaggerated due to their use of an incorrect systemic velocity. The systemic velocity listed in NASA Extragalactic Database (NED) for NGC 4550 and that used by Wiklind & Henkel (2001) is km s-1. This value is based on the HI measurement of Peterson (1979). More recent and more sensitive HI observations have not detected HI (DuPrie & Schneider, 1996; Morganti et al., in preparation), making the Peterson (1979) value very questionable. In addition, recent absorption line studies seem to be converging to a value of around 435 km s-1 (Rubin et al. (1997) find 434 km s-1, Falco et al. (1999) list km s-1, Wegner et al. (2003) find km s-1 and the velocity in the central pixel of the SAURON velocity map is km s-1). We have adopted this value for our work. Then, the flux from positive relative velocities is 1.64 Jy km s-1, around twice as much as the flux from negative relative velocities of 0.91 Jy km s-1. The ionised gas does not show the same bias as the molecular gas, with fairly symmetric emission in both space and velocity. In addition, the extent of the ionised gas is much greater than that observed in the molecular gas (see Fig. 4). As shown in Wiklind & Henkel (2001), however, the dust favours the north, in agreement with the molecular gas bias.
Integrating the spectrum over the velocity range with observed emission, i.e. from -80 to 80 km s-1, we obtain a total CO flux of 2.77 Jy km s-1. The total flux is used to compute the total molecular hydrogen mass using the formula , where D is the distance measured in Mpc and is the total CO(1-0) flux. This formula comes from using the standard CO to H2 conversion ratio cm-2, where is the column density of H2 and is the CO(1-0) intensity in K km s-1. We note that the actual conversion ratio for NGC 4550 is unknown and can be expected to vary by a factor of at least two (e.g. Leroy et al., 2007). However, using the specified conversion ratio, the total H2 mass detected by our interferometric observations is M☉.
Using the same value of and the same distance to NGC 4550, the single-dish measurement of Wiklind & Henkel (2001) gives a molecular mass of , slightly less than twice the value we obtain. However, they integrate over a much larger velocity range (225 to 535 km s-1), likely including much noise as positive emission (our velocity range is only 355 to 515 km s-1). Over a similar velocity range, our estimates for the molecular mass in NGC 4550 would be in suitable agreement, considering calibration uncertainties (%). Reflecting the calibration uncertainty and the much larger uncertainty in the conversion ratio, we report the molecular mass in NGC 4550 as , which is the value we will use for the rest of the paper.
3 Numerical Simulation
While both the gas accretion and coplanar major merger scenarios seem to be able to produce at least the general properties of the two stellar discs in NGC 4550, we would also like to know how the gas in this galaxy came to rotate like the thicker disc. Gas rotating like the thick disc is actually in disagreement with the predictions of the gas accretion scenario, in which the thin disc is formed from the acquired cold gas (Kenney et al., 2000). Any remaining gas would then be expected to rotate like the thin disc. To see what the merger scenario predicts for the gas, we have performed a numerical simulation, described below.
3.1 Method and initial conditions
Our merger simulation for NGC 4550 has been run with the same TREE-SPH technique as described in Di Matteo et al. (2007). The two merging galaxies are initially of the same type (Sb) and mass (each has a total mass M⊙ including dark matter). The bulges and halos are modelled as Plummer spheres, of masses 1.15 and M⊙, and characteristic radii 1 and 12 kpc, respectively. The stellar discs have masses of M⊙ and radial scale lengths of 5 kpc. The gas to stellar disc mass ratio is 0.2.
The initial separation between the two galaxies is 100 kpc. We choose an orbit for the galaxies such that they would have a parabolic encounter if they were both point masses. If the galaxies followed the parabolic orbit, the first pericentre would be 8 kpc and their relative velocity at this point would be 707 km s-1. Of course, the model galaxies do not follow this keplerian orbit. Instead, given the strong dynamical friction, merging occurs rapidly. The orbital angular momentum is initially oriented in the positive z-axis as is the spin of one of the two galaxies (hereafter called the prograde galaxy). The other galaxy has negative spin (and will be called the retrograde galaxy).
The total number of particles is 240 000, with 120 000 in each galaxy, divided between 40 000 in the gas, 40 000 in the stars and 40 000 in the dark matter halo. We use the Schmidt law and hybrid particles to take star formation into account as in Di Matteo et al. (2007). In the following, when we refer to the “gas component”, this means the sum of the gas particles and the very young stars formed since the merger.
3.2 Analysis and Results
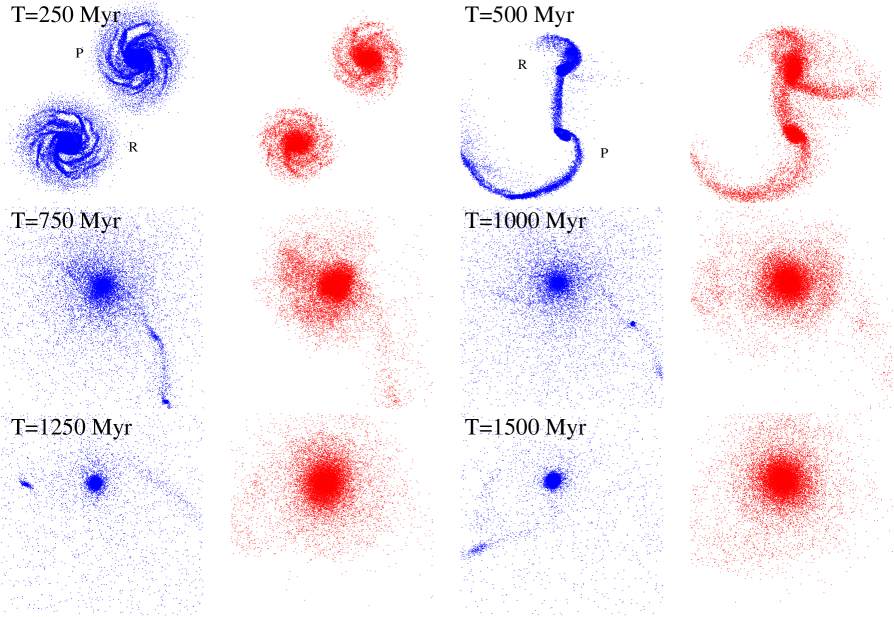
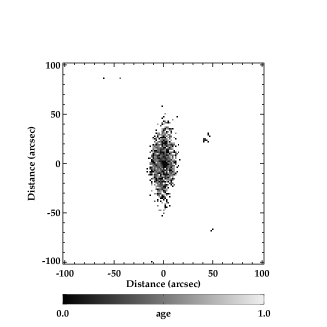
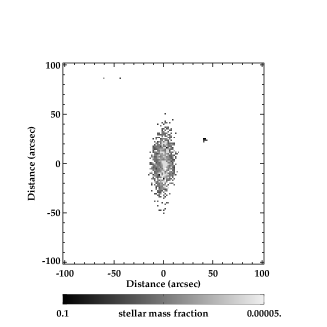
Figure 5 shows the gas and stellar particles for six snapshots from 250 to 1500 Myr. The simulation was run until T=4000 Myr (with a timestep of 0.5 Myr), but the evolution after 1500 Myr is only secular relaxation of the merger remnant.
With the spin of one galaxy aligned with the orbital motion and the spin of the other anti-aligned, the interaction is strongly asymmetric despite the equal mass of the galaxies. The prograde galaxy develops long tidal tails, while the retrograde is less heavily influenced by the interaction. As the merger evolves, the central regions become dominated by the stars from the retrograde galaxy as it remains more compact. However, the gas behaves differently due to its collisional nature. While two counter-rotating systems of stars can coexist, one of the gas systems must dominate. Initially, the gas from the prograde galaxy expands in tidal tails and even tidal dwarfs. However, this gas then falls back and settles in the disc of the merger remnant due to its dissipative nature. Since the orbital angular momentum is positive, the prograde gas increases its angular momentum and the retrograde gas loses some of its angular momentum in the encounter. This results in the gas rotating with positive angular momentum after the gas from the two discs has interacted and fully settled down.
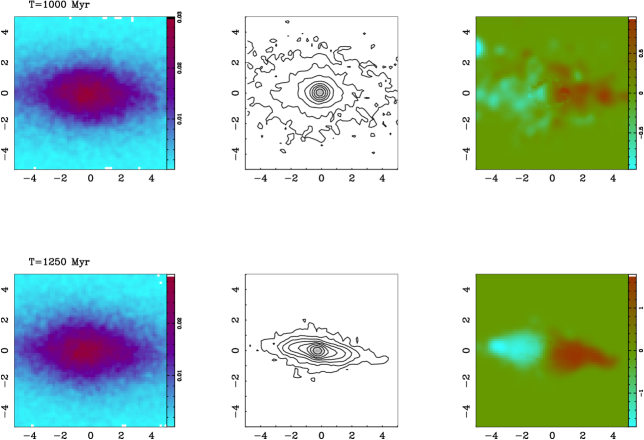
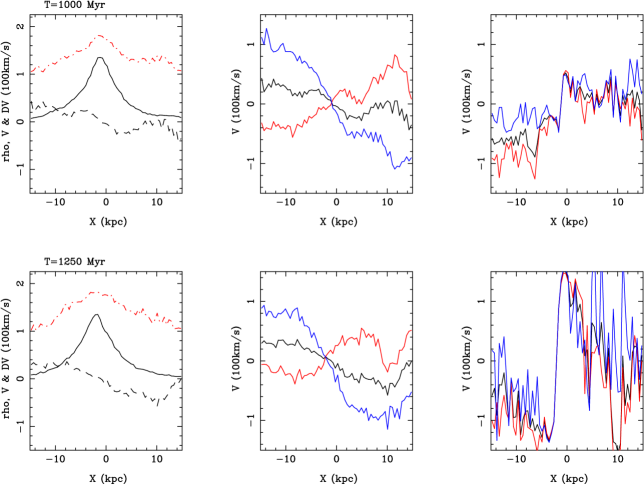
Figure 6 displays both the edge-on gas density and velocity map for two time steps: it explicitly reveals how the gas settles into a thin disc while re-ordering its kinematics to prograde rotation. More quantitatively, Figure 7 shows the global rotation curves along an edge-on projection, splitting the rotational profiles according to the various components, the gas and stars in the two galaxies. The rotation curves make it very clear that the stars in the retrograde galaxy retain their direction of rotation, dominating the total rotation curve in the centre of the galaxy. The stars from the prograde galaxy show a lower amplitude of rotation, as they have been strongly heated in the encounter. The merger has thus created a disc galaxy with one dynamically hotter disc of stars, one dynamically cooler counter-rotating disc of stars and a gaseous component rotating like the thick disc. As the alignment of the orbital angular momentum with the prograde galaxy causes both the heating of this galaxy and the settling of the gas into prograde rotation, we predict that in such systems the gas will always be in corotation with the most perturbed stellar system, i.e. with the hotter disc. NGC 4550 clearly exhibits this phenomenon with both the molecular and ionised gas rotating like the thicker stellar disc.
However, in the present simulation with perfectly coplanar galaxies, we note that there is not much heating in the perpendicular direction. The thickness of the stars with positive angular momentum (those that would observationally be considered in the prograde disc) is comparable to the thickness of the stars with negative angular momentum. While the lack of a bona fide thicker disc limits the direct comparison to NGC 4550, we expect more resonant heating in the perpendicular direction if the interaction were not perfectly coplanar. Earlier simulations show that the angle between the discs’ orientation and their orbit must be significant before the remnant takes on an elliptical morphology (Bournaud, Jog & Combes, 2005), leaving room for disc thickening before disc destruction. We will explore the possible parameters of low-inclination mergers in a future work.
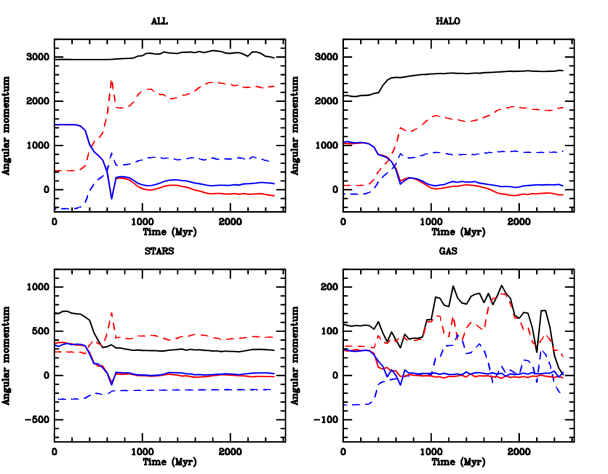
As angular momentum exchange strongly drives the evolution of the merging galaxies, it is interesting to follow the angular momentum exchange between all components present, including the dark matter. Figure 8 shows clearly that the largest angular momentum exchanges occur during the violent merging epoch between 400 and 800 Myr. Afterwards, all momenta evolve more slowly. The main feature is the loss of all the initially positive orbital angular momentum in each component, which is then transferred almost exclusively to the dark matter, except for a tiny fraction transferred to the internal spin of the gas and stars. This exchange is seen in the total global momentum (black full curve) in each panel of Figure 8. It is particularly intriguing to note that both dark haloes acquire a large prograde rotation, an effect even more marked for the halo of the prograde galaxy.
Our simulation agrees with the results of Puerari & Pfenniger (2001) who first showed that a coplanar major merger between two disc galaxies could limit the heating effect and create a NGC 4550 look-alike. In their simulation, they consider either a parabolic or a circular orbit, assuming that the relative energy of the two galaxies coming from infinity has already been absorbed by some outer matter. Both orbits avoid excessive heating, but only the parabolic orbit produces the spectacular counter-rotation observed in NGC 4550. However, their simulations are limited in how they investigate the gas- they include gas in either the prograde galaxy or the retrograde galaxy, but do not consider the case where gas is present in both galaxies as we have done. Of course, the final distribution of the gas within the merger remnant will depend on its initial distribution in the two progenitor galaxies.
Di Matteo et al. (2008) have also studied dynamical mechanisms to produce counter-rotating systems, through the merging of a non-rotating early-type galaxy with a gas-rich spiral. In these types of mergers, the orbital momentum is transferred to the rotation of the early-type galaxy and to the outer parts of the spiral, while the centre of the spiral (gas and stars) keeps its retrograde momentum. The counter rotation is then spatially marked (centre versus the outer parts), which is a different pattern than that observed in NGC 4550, where gas and stars are counter-rotating at the same location. The nature, amount and extent of the observed counter-rotation can thus help to determine the merging history of the system.
4 Star Formation
The CO detected in NGC 4550 indicates the potential for star formation, as stars originate in cold molecular gas. Using the Toomre density criterion, Q, with a conservatively cold velocity dispersion of 6 km s-1 and an epicyclic frequency measured from the rotation of the ionised gas (Sarzi et al., 2006), we calculate a threshold density (Q=1) of 285 pc-2. Determining a gas surface density for NGC 4550 from the CO data is difficult given the lack of resolution, but assuming a uniform-density, symmetric 5″-radius disc, we obtain a surface density of only 18.3 pc-2 for the molecular gas, far below the threshold. Even decreasing the radius to 2″, about the minimum believable extent of the molecular gas, gives a surface density of only 115 pc-2, still below the star formation threshold density. However, if the molecular gas is significantly more clumpy than a uniform density disc, than there may be isolated regions where the critical density is reached. We therefore do not immediately rule out the possibility of star formation in NGC 4550, instead looking for signs in other star formation tracers.
Far-infrared (FIR) emission is often used as a tracer of star formation, as young OB stars efficiently heat their surrounding dust. In late-type galaxies where the ultraviolet (UV) and visible radiation is dominated by young stars, the FIR emission is a very good tracer of star formation. Its use in earlier-type galaxies, however, is more disputable, as the radiation field of old hot stars should also contribute to the dust heating. Yet the relations between other tracers of star formation such as H (e.g. Kewley et al., 2002) and radio continuum (e.g. Gavazzi et al., 1986) hold puzzlingly constant with morphology (at least within spirals), indicating that it is dust proximate to star forming regions which dominates the FIR emission. Converting the IRAS 60 and 100 m fluxes into a star formation rate (SFR) following the prescription of Kewley et al. (2002), we derive a FIR-based SFR of yr-1 for NGC 4550.

As many early-type galaxies without star formation also emit in the FIR (an active galactic nucleus or infrared cirrus can also contribute), we do not want to rely on the FIR emission alone to ascertain ongoing star formation in NGC 4550. Instead, we look to the UV, where young stars are particularly bright. The first diagnostic we consider is the NUV-V colour. Using optical data from the MDM 1.3m telescope (Falcón-Barroso et al. in preparation) and GALEX UV data (Jeong et al. in preparation), we have produced a plot of the NUV-V colour along the major axis of NGC 4550 (Fig. 9). NGC 4550 has a central NUV-V colour of around 5, becoming bluer with increasing radius. While old stars can also emit in the UV, producing the UV-upturn phenomenon seen in old galaxies (e.g. Burstein et al., 1988, see O’Connell 1999 for a review), the bluest NUV-V colour this effect produces is NUV-V5.2 (Yi et al., 2005). Thus, the NUV-V colour in NGC 4550 is more likely from young stars. Furthermore, the decreasing gradient (bluer colour with increasing radius) is not seen in UV-upturn galaxies, reinforcing the idea that the NUV emission comes from young stars.

To investigate this possibility, we have used the method described in Jeong et al. (2007) to fit a two-stage star formation history to the UV-optical colours of NGC 4550. An old population is fixed at an age of 10 Gyr with a composite metallicity, while a younger component at solar metallicity is allowed to vary in age ( Gyr tYC Gyr) and mass fraction ( f). Figure 10 shows the results of these fits, pixel by pixel. The central region appears to host a young stellar population (fitted age around 100 Myr), although the mass fraction is very low at only 0.01%. To increase the signal-to-noise and thus the reliability of our model fits, we computed integrated colours for the central region where the CO emission is detected, using an ellipse with a major axis of , a minor axis of and a position angle of 0∘. The colours from this aperture give a best-fit age of 280 Myr with M☉ of young stars. The fit to the spectral energy distribution (SED) of this central region of NGC 4550 is shown in Figure 11. As seen in the figure, NGC 4550 is slightly bluer in NUV-V than the strong UV-upturn galaxy NGC 4552 and much bluer than the intermediate age compact elliptical M32, indicating that young stars must be responsible for the blue NUV-V colour of NGC 4550. Figure 11 also displays an inset of the chi-square contours for the fit. As can be seen, an age-mass degeneracy is present, with larger mass of slightly older stars (but only up to 500 Myr) or a smaller mass of even younger stars also able to fit the colours.
Absorption linestrengths also give an indication of a young or intermediate age population in NGC 4550. While absorption linestrengths are not sensitive to the very youngest stars, they can easily reveal stellar populations 1 Gyr or older. The age-sensitive linestrength H (measured on the Lick/IDS system) is relatively high in NGC 4550, at a value of 1.99 integrated over an effective radius (Re) and 2.14 integrated over Re/8 (Kuntschner et al., 2006), reaching a value of 2.2 in the very centre (Maier et al., in preparation). Observations with the Multi-Pupil Fiber Spectrograph (MPFS) measured lower H linestrengths, however these were not corrected for the contamination from the H emission line (Afanasiev & Sil’chenko, 2002). These linestrength values are hard to reproduce with only old ( Gyr) stars and more likely indicate a young or intermediate age population, perhaps dating from the time of the merger. As with the UV, there is again an age-mass fraction degeneracy, with a smaller fraction of young stars producing an analogous effect to a larger fraction of intermediate-age stars.
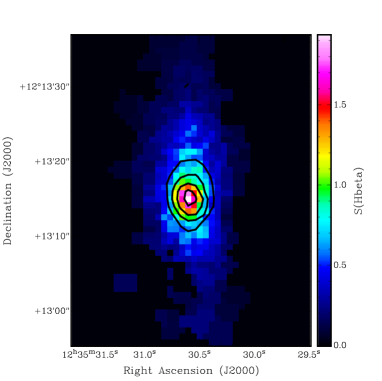
Unfortunately, neither the UV nor the absorption linestrengths can conclude anything about ongoing star formation in NGC 4550, while the FIR only gives an upper limit. To investigate ongoing star formation further, we look at optical emission line ratios and polyaromatic hydrocarbon (PAH) emission. Particularly low ratios of [O III] to H emission lines [log([O III]/H] indicate current star formation ( Myr) as the source of ionisation (Ho et al., 1997). Data from SAURON indicate that log([O III]/H is between 0.15 and 0.5 for NGC 4550 (Sarzi et al., 2006). While gas could be star forming at these high values, it is more probable that shocks, post-asymptotic giant branch stars or an AGN are the dominant source of ionisation (Sarzi et al. in preparation). The greater physical extent of the ionised gas compared to the molecular gas (see Fig. 4) also supports the idea that star formation is not the primary ionisation source. Similarly, although the PAH emission detected in NGC 4550 (Bressan et al., 2006) is suggestive of star formation, the PAH spectrum lacks the distinctive line ratios seen in star-forming regions. This different spectrum may just reflect a very low star formation rate (Galliano et al., 2008), but it may also indicate another source of PAH excitation altogether (Smith et al., 2007). Thus, with the available data, we cannot say more than that the star formation rate in NGC 4550 is less than about M☉ yr-1, as indicated by the FIR emission.
At this rate, the amount of molecular gas we detect in NGC 4550 can fuel star formation for up to 350 Myr. The molecular gas is likely related to the young population (280 Myr) found in the UV, although whether the star formation has proceeded continuously or in a more episodic fashion since then is impossible to say. Depending on the interpretation of the linestrengths, the star formation period may be of an even longer duration (extending back to more than Gyr) or the moderately high linestrengths may reflect a stellar population originating in the merger that formed NGC 4550.
5 Conclusions
We detect a very small amount ( M☉) of molecular gas in the centre of the counter-rotating red disc galaxy NGC 4550. The CO(1-0) emission is limited to the central 750 pc (10″) and is asymmetrically distributed, stronger at positive relative velocities north of the galaxy centre. The molecular gas co-rotates with the thick stellar disc and the ionised gas, counter-rotating with respect to the thin stellar disc.
Our simulation of the merger of two counter-rotating coplanar disc galaxies shows that the main features of NGC 4550 can naturally be explained with such a scenario. The interaction heats the prograde disc more than its retrograde companion and the gas component ends up aligned with the total angular momentum (dominated by the orbital angular momentum), and thus with the prograde disc. Thus, the gas is predicted to always rotate like the dynamically hotter disc, as observed in NGC 4550. As the gas accretion scenario does not provide a natural explanation for the corotation of the gas and thick disc, the merger scenario appears the more likely.
Both the UV and optical-linestrength data indicate that NGC 4550 cannot be made up of a purely old stellar population. The best-fit two-population model to the UV-optical photometry in the region with observed molecular gas gives a young population of 280 Myr and mass of . The optical H linestrength value requires a population at least younger than 5 Gyr. Ongoing star formation in the observed molecular gas is possible if there are locally dense regions that exceed the critical density. The FIR emission gives an upper limit on the current star formation rate of M☉ yr-1. This low star formation rate combined with the small amount of molecular gas present suggest that we are either witnessing a weak period in an extended bursty star formation episode, or a more continuous very low-level star formation episode that will last about another 350 Myr.
Ackowledgments
The authors acknowledge receipt of a Daiwa Anglo-Japanese Foundation small grant and a Royal Society International Joint Project grant, 2007/R2-IJP, which facilitated this work. We would like to thank Philippe Salome for help with the reduction of the Plateau de Bure data. We are also grateful to the SAURON Team for providing SAURON data, including as yet unpublished MDM and GALEX images. LMY acknowledges support from grant NSF AST-0507432 and would like to thank the Oxford Astrophysics Department for its hospitality during sabbatical work. MB acknowledges support from NASA through GALEX Guest Investigator program GALEXGI04-0000-0109. This work was supported by grant No. R01-2006-000-10716-0 from the Basic Research Program of the Korea Science and Engineering Foundation to SKY.
Based on observations carried out with the IRAM Plateau de Bure Interferometer. IRAM is supported by INSU/CNRS (France), MPG (Germany) and IGN (Spain). Also based on observations carried out with the NASA GALEX. GALEX is operated for NASA by the California Institute of Technology under NASA contract NAS5-98034. The NASA/IPAC Extragalactic Database (NED) is operated by the Jet Propulsion Laboratory, California Institute of Technology, under contract with the National Aeronautics and Space Administration. This research made use of HyperLEDA: http://leda.univ-lyon1.fr.
References
- Afanasiev & Sil’chenko (2002) Afanasiev V. L., Sil’chenko O. K., 2002, AJ, 124, 706
- Bournaud, Jog & Combes (2005) Bournaud F., Jog C. J., Combes F., 2005, A&A, 437, 69
- Bressan et al. (2006) Bressan A., et al., 2006, ApJ, 639, L55
- Burstein et al. (1988) Burstein D., Bertola F., Buson L. M., Faber S. M., Lauer T. R., 1988, ApJ, 328
- Cappellari et al. (2007) Cappellari M. et al., 2007, MNRAS, 379, 418
- Combes, Young & Bureau (2007) Combes F., Young L.M., Bureau M., 2007, MNRAS, 377, 1795
- de Vaucouleurs et al. (1991) de Vaucouleurs G., de Vaucouleurs A., Corwin H. G., Buta R. J., Paturel G., Fouque P., 1991, Third Reference Catalog of Bright Galaxies, Vols. 1-3, XII. Springer-Verlag, Berlin (RC3)
- Di Matteo et al. (2007) di Matteo P., Combes F., Melchior A.-L., Semelin B., 2007, A&A, 468, 61
- Di Matteo et al. (2008) di Matteo P., Combes F., Melchior A.-L., Semelin B., 2007, A&A, 477, 437
- Duprie & Schneider (1996) Duprie K., Schneider S. E., 1996, AJ, 112, 937
- Emsellem et al. (2004) Emsellem E., et al., 2004, MNRAS, 352, 721
- Falco et al. (1999) Falco E. E., et al., 1999, PASP, 111, 438
- Ferrarese et al. (2006) Ferrarese L., et al., 2006, ApJS, 164, 334
- Galliano et al. (2008) Galliano F., Madden S. C., Tielens A. G. G. M., Peeters E., Jones A. P., 2008, ApJ,
- Gavazzi et al. (1986) Gavazzi G., Cocito A., Vettolani G., 1986, ApJ, 305, 15
- Guilloteau & Lucas (2000) Guilloteau S., Lucas R., 2000, in Mangum J.G., Radford S.J.E., eds, ASP Conf. Ser. Vol. 217, Imaging at Radio through Submillimeter Wavelengths. Astron. Soc. Pac., San Francisco, p. 299
- Henkel & Wiklind (1997) Henkel C., Wiklind T., 1997, SSRev, 81, 1
- Ho et al. (1997) Ho L. C., Filippenko A. V., Sargent W. L., 1997, ApJS, 98, 477
- Högbom (1974) Högbom J.A., 1974, A&AS, 15, 417
- Jeong et al. (2007) Jeong H., Bureau M., Yi S. K., Krajnović D., Davies R. L., 2007, MNRAS, 376, 1021
- Kaviraj et al. (2007) Kaviraj S. et al., 2007, ApJS, 173, 619
- Kenney et al. (2000) Kenney J. D. P., Faundez S., Murphy E., 2000, in Alloin D., Olsen K., Galaz G., eds, ASP Conf. Ser. Vol. 221, Stars, gas and dust in galaxies: Exploring the Links. Astron. Soc. Pac., San Francisco, p. 253
- Kewley et al. (2002) Kewley L. J., Geller M. J., Jansen R. A., Dopita M. A., 2002, AJ, 124, 3135
- Kuntschner et al. (2006) Kuntschner H., et al., 2006, MNRAS, 369, 497
- Kuntschner et al. (2008) Kuntschner H., et al., 2008, MNRAS, in preparation
- Leroy et al. (2007) Leroy A., Bollato A., Stanimirovic S., Mizuno N., Israel F., Bot C., 2007, ApJ, 658, 1027
- Martin et al. (2001) Martin C. L., Kennicutt R. C. Jr., ApJ, 555, 301
- Mei et al. (2007) Mei S., et al., 2007, ApJ, 655, 144
- Moshir et al. (1990) Moshir M. et al., 1990, IRAS Faint Source Catalog, version 2.0
- O’Connell (1999) O’Connell R. W., 1999, ARA&A, 37, 603
- Peterson (1979) Peterson S. D., 1979, ApJS, 40, 527
- Puerari & Pfenniger (2001) Puerari I., Pfenniger D., 2001, A&SS, 276, 909
- Rix et al. (1992) Rix H.-W., Franx M., Fisher D., Illingworth G., 1992, ApJ, 400, L5
- Rubin et al. (1992) Rubin V. C., Graham J. A., Kenney J. D. P., 1992, ApJ, 394, L9
- Rubin et al. (1997) Rubin V. C., Kenney J. D., Young J. S., 113, 1250
- Sage & Welch (2006) Sage L. J., Welch G. A., 2006, ApJ, 644, 850
- Sarzi et al. (2006) Sarzi M. et al. 2006, MNRAS, 366, 1151
- Schaye (2004) Schaye J., 2004, ApJ, 609, 667
- Schiavon (2007) Schiavon R. P., 2007, ApJS, 171, 146
- Scorza et al. (1998) Scorza C., Bender R., Winkelmann C., Capaccioli M., Macchetto D. F., 1998, A&AS, 131, 265
- Skillman (1987) Skillman E. D., 1987, in Londsdale Persson C. J., ed., Star Formation in Galaxies, NASA, 263
- Smith et al. (2007) Smith J. D., et al., 2007, ApJ, 656, 770
- Thakar & Ryden (1998) Thakar A. R., Ryden, B. S., ApJ, 506, 93
- Trager et al. (2000) Trager S. C., Faber S. M., Worthey G., Gonzalez J. J., 2000, AJ, 119, 1645
- Vergani et al. (2007) Vergani D., Pizzella, A., Corsini E. M., van Driel W., Buson L. M., Dettmar R.-J., Bertola F., 2007, A&A, 463, 883
- Wegner et al. (2003) Wegner G., et al., 2003, AJ, 126, 2268
- Wiklind & Henkel (2001) Wiklind T., Henkel C., 2001, A&A, 375, 797
- Yi et al. (2005) Yi S. K. et al., 2005, ApJ, 619, L111