SPECTROPOLARIMETRIC VARIABILITY AND CO-ROTATING STRUCTURE IN HD 92207
Abstract
We report on low resolution () spectropolarimetry of the A0 supergiant star HD 92207. This star is well-known for significant spectral variability. The source was observed on seven different nights spanning approximately 3 months in time. With a rotation period of approximately 1 year, our data covers approximately a quarter of the star’s rotational phase. Variability in the continuum polarization level is observed over this period of time. The polarization across the Hα line on any given night is typically different from the degree and position angle of the polarization in the continuum. Interestingly, H is not in emission and does not show polarimetric variability. We associate the changes at Hα as arising in the wind, which is in accord with the observed changes in the profile shape and equivalent width of Hα along with the polarimetric variability. For the continuum polarization, we explore a spiral shaped wind density enhancement in the equatorial plane of the star, in keeping with the suggestion of Kaufer et al. (1997). Variable polarization signatures across Hα are too complex to be explained by this simple model and will require a more intensive polarimetric follow-up study to interpret properly.
1 INTRODUCTION
Spectropolarimetry is a valuable tool for studying a number of important properties of stars. Circular polarization is one of the few direct means of measuring stellar magnetic fields (e.g., Babcock 1958). Linear polarization, such as from Thomson scattering in circumstellar envelopes of hot stars, has been important for ascertaining deviations from sphericity in circumstellar media (e.g., the Be stars [Poeckert & Marlborough 1976; McLean & Brown 1978; Wood, Bjorkman, & Bjorkman 1997] and supernovae [Wang et al. 1996; Leonard et al. 2005]). A challenge for this area is that net polarizations tend to be small so that large telescopes are required to obtain sufficiently high quality data for sources that are only moderately faint. Fortunately, astronomers now have access to several 8–10 m class or larger telescopes that are outfitted with polarimeters. With such instrumentation, studies of polarizations across spectral lines – combining good spectral resolution with large telescope collecting areas – have become increasingly popular and important for understanding structure in circumstellar media. Here we present an analysis of variable linear polarization across the Hα line and in the adjacent continuum for the A0 supergiant star HD 92207 at seven epochs over a period of three months.
This particular star was chosen for several different reasons. It has been studied spectroscopically by Kaufer et al. (1996) who found substantial line profile and line equivalent width changes at Hα. These variations appear to be related to the well-known discrete absorption components (or “DACs”) that are commonly seen in UV lines of early-type stars (e.g., Massa et al. 1995; Kaper et al. 1996). HD 92207 is not far removed from the Luminous Blue Variable stars and O supergiants that show variable continuum polarizations (Lupie & Nordsieck 1987; Taylor et al. 1991; Harries, Howarth, & Evans 2002; Davies, Vink, & Oudmaijer 2007). Moreover, the relatively late spectral type of HD 92207 within the early-type class indicates that Hα acts more nearly as a scattering line than a recombination line (Puls et al. 1998), thus making the star a prime candidate for exploring variable polarization across a line dominated by wind emission.
A description of the observations is presented in the following section. An analysis of the data is provided in section 3. A discussion of the implications of the results is given in section 4.
2 OBSERVATIONS AND DATA REDUCTION
The observations of the supergiant HD 92207 were obtained in service mode from 2007 January to 2007 March at the European Southern Observatory with FORS 1 (FOcal Reducer low dispersion Spectrograph), mounted on the 8-m Kueyen telescope of the VLT. This multi-mode instrument is equipped with polarization analyzing optics comprising super-achromatic half-wave and quarter-wave phase retarder plates, and a Wollaston prism with a beam divergence of 22′′ in standard resolution mode. To perform linear polarization measurements, a Wollaston prism and a half-wave retarder waveplate were used. The waveplate was rotated in 22.5∘ steps between 0∘ and 157.5∘, taking two 20 s sub-exposures at each of the eight positions.
The GRISM 600R was used in the FIMS (FORS Instrumental Mask Simulator) observing mode in the wavelength range 4672–6795 Å to cover the hydrogen Balmer lines Hα and Hβ. The spectral resolution of the FORS 1 spectra taken with this setting and a 0.4′′ slit was R3000, corresponding to a velocity resolution of about 100 km s-1.
The readout time was reduced to about 40 s by windowing the CCD, and the use of a non-standard readout mode (A,11,low) provided a broader dynamic range, allowing us to increase the S/N of the individual spectra. Due to the brightness of the target (m) and excellent seeing conditions, a few exposures obtained during the second and the last observing night were saturated. For these phases, only measurements at the retarder waveplate positions between 0∘ and 67.5∘ are available.

| Date | MJD | Hα EW | ||
|---|---|---|---|---|
| () | (%) | (%) | ||
| 2007 Jan 06 | 54106.356 | –4.02 | ||
| 2007 Feb 24 | 54155.189 | –3.16 | ||
| 2007 Feb 26 | 54157.112 | –2.91 | ||
| 2007 Feb 27 | 54158.117 | –2.60 | ||
| 2007 Mar 11 | 54170.291 | –3.50 | ||
| 2007 Mar 25 | 54184.162 | –3.47 | ||
| 2007 Mar 26 | 54185.151 | –2.96 |
a The continuum polarizations in the final two columns are taken from the continuum intervals of and adjacent to the Hα line.
For all seven nights we calculated the values and , where , , and are the Stokes parameters as defined in Shurcliff (1962). The total linear polarization is given by , and the polarization position angle is . The associated errors for the determination of , , , and are estimated from error propagation, based on pure photon noise in the raw data (see Tab. 1).
The spectropolarimetric calibration of FORS 1 was checked with the spectropolarimetric standard NGC 2024-1. On 2007 January 8, 300 s exposures were taken at retarder waveplate angles 0∘, 22.5∘, 45∘, and 67.5∘. These data were reduced in the same manner as those obtained for our target HD 92207. We obtained the values = 9.650.12% and = 136.820.34∘, which are in very good agreement with the previous measurements = 9.530.02% and = 136.750.16∘ by Fossati et al. (2007), who used numerous spectropolarimetric observations of NGC 2024-1 retrieved from the ESO archive.
3 ANALYSIS
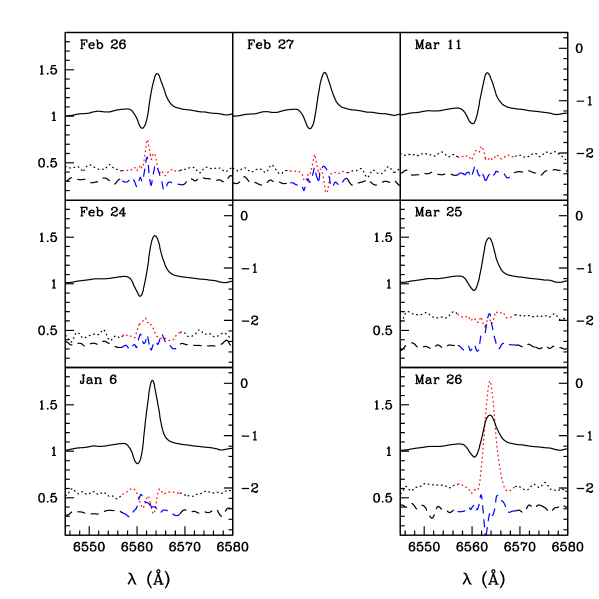
Here we describe the characteristics of the observed polarizations and their implications for the source. Based on previous studies of Hα, it is not surprising that even in low resolution spectra, the P Cygni emission line of Hα of HD 92207 shows significant variability, both in line shape and equivalent width. Figure 1 shows average line profile shapes for the seven spectra with dates labeled. The different spectra have been shifted vertically for better display. The equivalent widths (EWs) were evaluated between km s-1, the terminal speed of the wind (see Tab. 2), and are listed in Table 1. Note that all of the lines show a net emission.
Figure 2 shows the polarization of Hα and the neighboring continuum in the form of Q-U diagrams for each night. Each panel displays the date, moving chronologically clockwise from lower left. The black point in each panel signifies the mean continuum polarization from relatively “clean” regions of the spectra that appear to lack lines, including 6545–6557 Å on the shortward side of Hα and 6569–6580 Å on the longward side. We determined a typical standard deviation in the continuum polarization to be approximately for any given night, which is approximately the size of the plotted black squares. Combining all seven nights, the average polarizations are and ; however, no attempt has been made to correct the data for interstellar polarization, so these values cannot be considered intrinsic to the star. However, our analysis focuses on variable polarization which is intrinsic to the star.
For wavelengths within the line, dashed and dotted line types distinguish between blue and red shifts from line center (these appear as blue and red colors in the online version of the figure). Again, points considered to be within the line are those between km s-1 of line center.
The central panel is an overplot of the line data for the other seven panels, indicating the full range of polarimetric variations across Hα. There is a change in the continuum polarization over the 3 month time span. The overall amplitude of change is about 0.5%, which is over 10 times larger than the dispersion for any one of the averages.
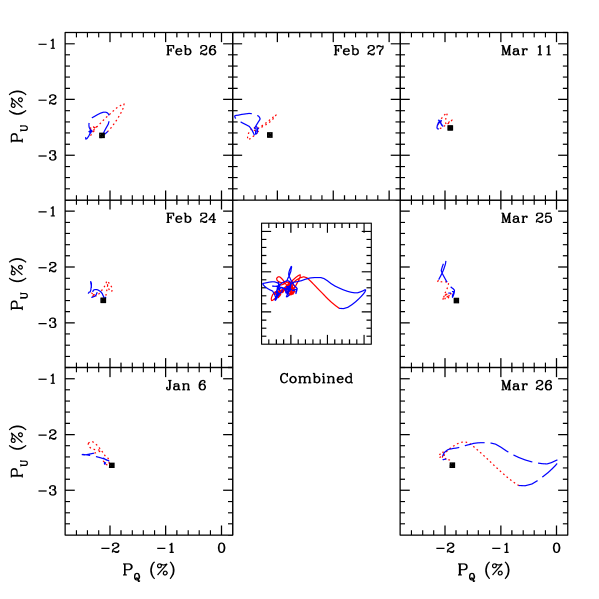
Most remarkable are the observed variations in the polarization across the Hα P Cygni line. The average of the polarization within the line is typically greater than the dispersion in the continuum knot by a factor of 4 or more. The two main exceptions are the nights of March 11 that shows very little variation across the line and March 26 that shows the greatest variations, essentially a change in polarization of about 2%.
It is notable that the variations across Hα imply different polarization position angles on different nights. Recall that . Consequently, for a fixed geometry, will be a constant, implying that which amounts to variations along a line in Q-U diagrams. Although this seems approximately true for the wavelength-dependent polarization across Hα on any given night (February 26 being an exception), the extensions of the polarization from the knot of continuum points appear to fall along different orientations between nights. Take for example the consecutive nights of March 25 and 26. Polarimetric changes are in U for the former, but in Q for the latter, suggesting a rotation in by after just one day. Given that the size and rotation of the star suggest a rotation period of approximately 1 year (see Tab. 2), variations at the level of 1 day seems far too short to arise from a substantial change in geometry.
4 DISCUSSION
We have presented relatively medium resolution spectropolarimetric data of the highly variable A supergiant HD 92207. It has been suggested by Kaufer et al. (1997) that the observed photometric and Hα line variations are the result of a corotating structure in the wind, which they consider to be in the star’s equatorial plane. To explore that possibility, we begin with a consideration of the variable continuum polarization.
We have developed a phenomenological model for Thomson scattering from an enhanced scattering region in a spherical wind in the form of a spiral pattern, similar in spirit to the work of Brown et al. (1994) who sought to model DACs in emission lines. Our objective is to obtain a reference model for the global wind morphology that we can use for interpreting the Hα polarization.
We consider a corotating stucture as a simple spiral that is top-bottom symmetric about the plane of the star’s rotational equator. Hence, the spiral structure has a guiding center that is always in the equatorial plane. This center obeys an equation of motion for the radial wind velocity law and conservation of angular momentum in the rotating frame, so it follows a “streak line” (e.g., see Ignace, Bjorkman, Cassinelli 1998). We adopt a standard “-law” for the radial flow:
| (1) |
where and determines the radial speed of the wind at its base, with .
| Factor | Value |
|---|---|
| 30 km s-1 | |
| yr-1 | |
| 275 km s-1 | |
| 1 | |
| 0.98 | |
| 25 | |
a Przybilla et al. (2006); b Kudritzki et al. (1996); c best fit model parameters (see text).
Velocity laws with and were considered, and the case of produced a better match to the data. In this case the location of the guiding center is given analytically with azimuth by
| (2) | |||||
where and .
The density for the spiral-shaped perturbed region is treated as an excess of density above the otherwise spherically symmetric wind. This density excess in the spiral pattern is taken to scale with the spherical wind density in our “toy” model, thus we conveniently parametrize the excess by a constant factor , for the spherical wind density. In addition to the solution for the guiding center, we also need the cross-section of the spiral. The cross-section (i.e., the intersection of the spiral pattern with a spherical shell) is treated as circular. This spherical “cap” is axisymmetric, and so assuming the electron scattering is optically thin, the polarization from any given slice of the spiral is given by Brown & McLean (1978), along with the finite star depolarization correction factor of Cassinelli, Nordsieck, & Murison (1987). Summing up contributions from all the caps yields the polarization from the structure as a function of rotational phase and viewing inclination for the rotation axis of the star.
Note that our model accounts for occultation of scattered light by the intervening star, but only in an approximate way. We consider a slice as entirely occulted if its guiding center lies behind the star, and unocculted otherwise.
The principal model parameters are the density excess , the half-opening angle of the spiral , an orientation angle between the observer axes and those of the star system , and finally the inclination of the rotation axis of the star . Using a reduced chi-square evaluation for a grid of model polarization light curves, Table 2 lists the model parameters that provide the best fit to the observed continuum data. The star and wind properties of HD 92207 are taken from Przybilla et al. (2006), except that the mass-loss rate is taken from Kudritzki et al. (1999) and does not account for clumping. The most reasonable match to the observed continuum polarizations in the neighborhood of Hα is shown in Figure 3. The upper panel is for and the lower one for , displayed as percentage polarizations. The rotational phases depend on the star’s rotation period. Given the radius and minimum rotation speed from Table 2, the maximum period is d. The true period is , where is constrained from our model fitting. As the ephemeris is not known, we assigned the rotational phase “0” to the date of our first observation, and the phases appearing in Figure 3 represent values for our best fit model at .
For the model fitting, there are seven free parameters: the four listed above plus three offsets – one for rotational phase, a vertical offset in , and an independent one in . With fourteen data points in total, the reduced chi-square for our best simultaneous fit to the and lightcurves is 1.6. That value is primarily a reflection of one discrepant data point, the first one in the observed ligthcurve. Our model is inherently smooth, whereas the line variability indicates the presence of variable wind structure. For the continuum polarization, this wind structure can act as a source of “noise”. Better temporal and phase coverage is needed to interpret the polarimetric lightcurve more fully.

The non-zero variation of indicates that is not edge-on to the system, since no could result for such a perspective when the circumstellar scattering environment is top-bottom symmetric. However, is much less than , suggestive that is not close to pole-on. Since the interstellar polarization is not known, there is freedom to shift the observed points with respect to the model in both phase (i.e., ) and vertical offset to best match a model curve. The vertical offsets for and are independent, but the phase shift must be the same for both. There is also freedom to rotate the model system relative to the observer - system, but we found the angle to be small, with .
The match between the model and the continuum data appears to be best around an inclination of with a half-opening angle of . A opening angle corresponds to the Van Vleck angle and yields the maximum polarization when other parameters are held fixed, thus allowing us to minimize the value of the excess density. Because the spherical wind is relatively thin in electron scattering ( for solar abundances with ionized H and He neutral), a fairly large value of is needed to match the observed and . Such a large excess would need to be justified through physical modeling of the stellar wind and atmosphere.
Overall, the match is reasonably good except for the first data point in the lower panel for which we cannot reconcile to the model after exploring a range of opening angles, viewing inclinations, and values. Based on the work of Davies et al. (2005) for luminous blue variables, wind inhomogeneities are likely contributing a random contribution of unknown amplitude to the observed polarizations from HD 92207, which makes the interpretation of any globally coherent variation with phase challenging for such sparse sampling. Even though our spiral model is simplistic, it does capture the essential points inherent to any corotating structure in terms of the generic trends of and with phase, viewing inclination, and density. It is certainly clear that much better sampling of the polarimetric light curve in the continuum is needed to critically assess the existence of a corotating region in the wind.
Turning to the Hα line, the P Cygni morphology indicates that the line is dominated by the stellar wind. In contrast, the Hβ line is in absorption and shows no variable polarization. At the spectral type of HD 97702, the level of hydrogen can act as the effective ground state (Puls et al. 1998) explaining why it shows such a strong P Cygni shape. It also means that line scattering polarization (e.g., Hamilton 1947) may influence the observed variable polarization in Hα. For example, such effects were explored by Jeffery (1987, 1989) in the case of SN1987A.
Figure 4 displays the polarized and spectra in velocity along with the P Cygni profiles to emphasize where polarization changes occur within the line in relation to the absorption trough and emission peak. The vertical scale for the measured percent polarizations are shown on the right axes, whereas the scale for the continuum normalized P Cygni lines is displayed on the left axes. For the first 5 panels, it is typically the case that either , , or both vary most around the line core over an interval that is about a third of the wind terminal speed. One clear exception is for March 26 that shows the strongest change in polarization across the line in and aligns quite well with the redshifted emission peak, although it appears that actually increases in absolute value. The observed polarizations are negative, so zero polarization is toward the top of each panel. Curiously, there is a depolarization at the same location the night prior, except in instead of . The overall depolarizations across the emission peak in the line relative to the continuum would seem to be a classic “line effect”. Polarization is normalized at each wavelength to the total emission. If the line formation leads to unpolarized radiation that is largely unscattered by free electrons before emerging from the wind, then the additional line emission tends to reduce the polarization at those wavelengths relative to values outside the line. In fact, this can be an excellent way of placing an upper limit to the interstellar polarization to the star. However, the Hα line of HD 92207 is perplexing because its behavior is not consistent. Moreover, night-to-night variations in the Hα polarization are hard to understand in terms of the spiral structure that we have considered for the continuum polarization given that the star’s rotation period is of order a year.
It is worth pointing out that Harries (2000) modeled wavelength-dependent polarization across Hα for the O supergiant Pup. His models did not include contributions to the polarization from line scattering; rather, he obtained changes of polarization across the line owing to the influence of line opacity for the polarization produced by Thomson scattering.
The application of Harries’ models to HD 92207 is unclear. There is the likelihood of a significant line scattering contribution to Hα because of HD 92207’s much later spectral type as compared to Pup. Other effects such as dynamic changes in the wind or variable stellar illumination (c.f., Al-Malki et al. 1999) will be needed to interpret the polarization across Hα. For example, it would be useful to combine the methods of Li et al. 2000 and Davies et al. 2007 for polarimetric variability from wind clumping and electron scattering with the resonance scattering polarization effects explored by Ignace, Nordsieck, & Cassinelli (2004) for stationary winds. With limited coverage of the rotational phase and only modest spectral resolution, the existing dataset is too poor to undertake a detailed calculation of the Hα line to interpret the observed polarizations. With future data, such an effort would be worthwhile because the continuum polarization constrains the global wind morphology whereas the Hα line is sensitive to vector velocity flow.
Acknowledgements
We are grateful to an anonymous referee for a number of helpful suggestions. RI thanks Gary Henson for numerous discussions about the polarization changes across lines. This work was partially supported by a grant from the National Science Foundation (AST-0807664). We want to acknowledge the ESO program 078.D-0330(A) that made the observations possible.
References
- [1]
- [2] Al-Malki, M. B., Simmons, J. F. L., Ignace, R., Brown, J. C., & Clarke, D., 1999, A&A, 347, 919
- [3]
- [4] Babcock, H. W. 1958, ApJ, 128, 228
- [5]
- [6] Brown, J. C., & McLean, I. S. 1977, A&A, 57, 141
- [7]
- [8] Brown, J. C., et al. 2004, A&A, 413, 959
- [9]
- [10] Cassinelli, J. P., Nordsieck, K. H., & Murison, M. A. 1987,
- [11]
- [12] Davies, B., Oudmaijer, R. D., & Vink, J. S. 2005, A&A, 439, 1107
- [13]
- [14] Davies, B., Vink, J. S., & Oudmaijer, R. D. 2007, A&A, 469, 1045
- [15]
- [16] Fossati, L., Bagnulo, S., Mason, E., & Landi Degl’Innocenti, E. 2007, in ASP Conf. Ser. 364, The Future of Photometric, Spectrophotometric and Polarimetric Standardization, ed. C. Sterken (San Francisco: ASP), 503
- [17]
- [18] Hamilton, D. R., 1947, ApJ, 106, 457
- [19]
- [20] Harries, T. J. 2000, MNRAS, 315, 722
- [21]
- [22] Harries, F. J., Howarth, I. D., & Evans, C. J. 2002, MNRAS, 337, 341
- [23]
- [24] Ignace, R., Bjorkman, J. E., & Cassinelli, J. P., 1998, ApJ, 505, 910
- [25]
- [26] Ignace, R., Nordsieck, K. H., & Cassinelli, J. P. 2004, ApJ, 609, 1018
- [27]
- [28] Jeffery, D. J. 1987, Natur, 328, 419
- [29]
- [30] Jeffery, D. J. 1989, ApJS, 71, 951
- [31]
- [32] Kaper, L., Henrichs, H. F., Nichols, J. S., Snoek, L. C., Volten, H., & Zwarthoed, G. A. A. 1996, A&AS, 116, 257
- [33]
- [34] Kaufer, A., et al. 1996, A&A, 314, 599
- [35]
- [36] Kaufer, A., et al. 1997, A&A, 320, 273
- [37]
- [38] Kudritzki, R. P., Puls, J., Lennon, D. J., Venn, K. A., Reetz, J., Najarro, F., McCarthy, J. K., & Herrero, A. 1999, A&A, 350, 970
- [39]
- [40] Leonard, D. C., Li, W., Filippenko, A. V., Foley, R. J., & Chornock, R. 2005, ApJ, 632, 450
- [41]
- [42] Li, Q., Brown, J. C., Ignace, R., Cassinelli, J. P., & Oskinova, L. M. 2000, A&A, 357, 233
- [43]
- [44] Lupie, O., & Nordsieck, K. H. 1987, AJ, 93, 214
- [45]
- [46] Massa, D., et al. 1995, ApJ, 452, L53
- [47]
- [48] McLean, I. S., & Brown, J. C. 1978, A&A, 69, 291
- [49]
- [50] Poeckert, R., & Marlborough, J. M. 1976, ApJ, 206, 182
- [51]
- [52] Przybilla, N., Butler, K., Becker, S. R., & Kudritzki, R. P. 2006, A&A, 445, 1099
- [53]
- [54] Puls, J., Kudritzki, R.-P., Santolaya-Rey, A. E., Herrero, A., Owocki, S. P., & McCarthy, J. K., 1998, in Boulder-Munich II: Properties of Hot Luminous Stars, (ed.) Ian D. Howarth, ASP Conf. Ser., 131, 245
- [55]
- [56] Shurcliff, W. A. 1962, Polarized light, Cambridge: Harward University Press
- [57]
- [58] Taylor, M. J., Nordsieck, K. H., Schulte-Ladbeck, R. E., & Bjorkman, K. S., 1991, AJ, 102, 1197 ApJ, 317, 290
- [59]
- [60] Wang, L., Wheeler, J. C., Li, Z., & Clocchiatti, A. 1996, ApJ, 467, 435
- [61]
- [62] Wood, K., Bjorkman, K. S., & Bjorkman, J. E. 1997, ApJ, 477, 926
- [63]