Chandra Observations of Nuclear X-ray Emission from Low Surface Brightness Galaxies
Abstract
We present Chandra detections of x-ray emission from the AGN in two giant Low Surface Brightness (LSB) galaxies, UGC 2936 and UGC 1455. Their x-ray luminosities are and respectively. Of the two galaxies, UGC 2936 is radio loud. Together with another LSB galaxy UGC 6614 (XMM archival data) both appear to lie above the X-ray-Radio fundamental plane and their AGN have black hole masses that are low compared to similar galaxies lying on the correlation. However, the bulges in these galaxies are well developed and we detect diffuse x-ray emission from four of the eight galaxies in our sample. Our results suggest that the bulges of giant LSB galaxies evolve independently of their halo dominated disks which are low in star formation and disk dynamics. The centers follow an evolutionary path similar to that of bulge dominated normal galaxies on the Hubble Sequence but the LSB disks remain unevolved. Thus the bulge and disk evolution are decoupled and so whatever star formation processes produced the bulges did not affect the disks.
1 Introduction
Low Surface Brightness (LSB) galaxies are poorly evolved systems that have diffuse stellar disks, large HI disks and massive dark halos (Impey & Bothun, 1997). The dark halo inhibits the growth of disk instabilities such as bars and spiral arms, this leads to an overall poor star formation rate over these galaxies (Boissier et al., 2008; O’Neil et al., 2007). As a result LSB galaxies are metal poor (de Naray et al., 2004) and optically dim. Optical studies show that they span a wide range of morphologies from dwarfs to giant spirals (Beijersbergen et al., 1999). Our paper focuses on giant LSB spirals which are characterised by prominent central bulges, optically dim disks and extended HI gas disks, a good example being Malin 1 (Barth, 2007; Impey & Bothun, 1989). These galaxies are also fairly isolated systems (Rosenbaum & Bomans, 2004). The origin and evolution of these galaxies is still unclear; one possibility is that they form in low density enviroments and hence remain unevolved (Hoffman et al., 1992).
Although LSB galaxy disks have been studied at length at optical and infrared wavelengths (Burkholder et al., 2001; Rahman et al., 2007; Hinz et al., 2007) not much is known about their nuclear properties. In particular, their nuclear black hole (BH) masses and AGN-bulge evolution history remain largely unconstrained. Optical spectroscopy indicates that a significant fraction have Active Galactic Nuclei (AGN) (Sprayberry et al., 1995) and large bulges (Schombert, 1998). Nuclear acivity has also been detected at radio wavelengths (Das et al. 2008, in preparation). However, the best way to detect and study AGN activity is using x-ray emission which will give rise to a compact x-ray bright source at the galaxy nucleus. There may also be a primordial x-ray emitting gaseous halo which will appear as diffuse x-ray emission associated with the galaxy or its bulge. Very little is known about BH masses in bulge dominated LSB galaxies but indirect studies suggest that it is low compared to normal galaxies (Pizzella et al., 2005). This raises interesting questions regarding the evolution of BHs, AGN and bulges in poorly evolved and isolated galaxies. In this paper we examine these issues with observations made using the Chandra X-ray Observatory. Essentially nothing is known about the x-ray properties of LSB galaxies (possibly because the lack of star formation and hence the low number of high-mass x-ray binaries suggests low x-ray emission). In the following sections we present the results of a pilot study of eight giant LSB galaxies with Chandra and discuss the implications of our observations.
2 Observations
2.1 Sample Selection
We observed a total of eight LSB galaxies with Chandra during Cycle 8. Our sample is based on a sample of gas rich, predominantly low surface brightness galaxies with optical AGN defined by Schombert (1998). We have not independently quantified their LSB characteristics with photometric observations. Although a few galaxies (such as UGC 12845) are clearly LSB, surface photometry is required to establish the LSB nature of the entire sample. Our sample was also limited by the fact that we had only 30 Ksecs of observing time. Hence only a few nearby, giant LSB galaxies were chosen. Thus our sample is by no means complete but does give a first look at the x-ray properties of these galaxies. All the galaxies are large, HI rich and nearby; they are derived from the UGC catalogue (). We chose a subset of eight nearby () optically active LSB galaxies from this sample in order to maximise our chances of x-ray detection with Chandra. Thus all the eight galaxies in our sample have prominent bulges and optically identified AGN. In the following paragraph we give a brief description of each galaxy. We take low surface brightness galaxies to have central surface brightness , which is clearly below the Freeman value.
UGC 1455 : The galaxy has a disk B band brightness of
(Graham, 2003). At the center of the LSB disk is a prominent bulge which is
oval in shape and may represent a small bar (de Jong, 1996).
UGC 2936 : This is a fairly inclined galaxy with an LSB disk fainter than
(Sprayberry et al., 1995) and a very extended HI disk.
So it falls into the LSB category but has significant star formation
over the disk which is unusual for a LSB galaxy (Pickering et al., 1999).
UGC 1378 : This galaxy is classified as a LSB galaxy by Schombert (1998); it has a prominent
bulge but diffuse disk. Deeper photometry of the galaxy in the literature is lacking.
UGC 1922 : The galaxy has a prominent nucleus but a very featureless LSB disk; appearance
is indicative of a giant LSB galaxy based on Schomberts classification. Deeper photometry of this
galaxy is lacking. It is one of the few LSB galaxies that have been detected in CO emission
signifying the presence of molecular gas (O’Neil & Schinnerer, 2003).
UGC 3059 : This is a fairly inclined galaxy like UGC 2936 and is classified as a
LSB galaxy by Schombert (1998). It has a prominent bulge, diffuse
stellar disk and large HI gas disk.
UGC 4422 : Also knowm as NGC 2595, this galaxy has a disk B band brightness of
(Graham, 2003) and so falls into the LSB galaxy category. The galaxy has a
bright core, small bar and prominent spiral arms. However, the disk shows signs of ongoing star formation which
is unusual for LSB galaxies.
UGC 11754 : The only LSB classification for this galaxy is by Schombert; deeper photometry is lacking
in the literature. However, it does have a very diffuse stellar disk similar to that seen in typical LSB
galaxies.
UGC 12845 : This galaxy is classified as a LSB galaxy by (Bothun et al., 1985) and also by
(Graham, 2003) who measure the disk brightness as . It has a prominent bulge,
faint spiral arms and a fairly diffuse stellar disk.
2.2 Chandra Observations and data reduction
This was a pilot study and the total time of the observation was 30 ksecs. The galaxies and their observation IDs are listed in Table 1 along with the exposure time. All the observations were performed with the Advanced CCD Imaging Spectrometer (ACIS) with the aimpoint placed on chip-S3 of the ACIS-S array. The data were reduced according to the standard threads using CIAO version 3.4 and all spectral analysis was performed with XSPEC version 12.2.1.
3 Analysis and Results
3.1 Nuclear sources
For each galaxy, we began by using the wavdetect source detection algorithm to search for any compact/pointlike emission associated with the nucleus; such emission would be a signature of AGN activity. We detected a compact source in the center of 2 galaxies in our sample, UGC 2936 and UGC 1455.
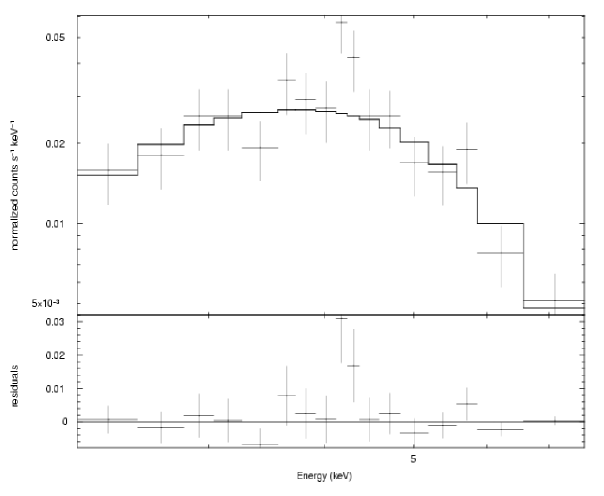
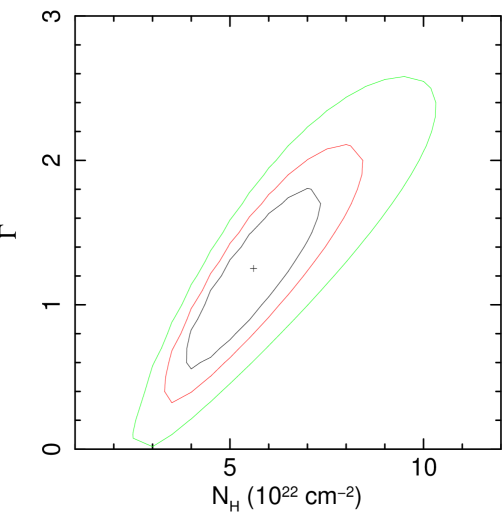
For UGC 2936, the photon count rate was sufficient to extract a spectrum. The spectrum was extracted using the CIAO script psextract, and grouped to have 15 counts per bin in order to permit the use of statistics (Figure 1). The 0.5–10 keV spectrum was fitted with a model consisting of a power law and modified by photoelectric absorption from cold line-of-sight gas. Including only the Galactic absorption () gave a poor fit and a very flat photon index ( and ). The fit improves dramatically () if we allow for additional absorption, presumably associated with UGC 2936 itself; the best fitting model has a total absorbing column and photon index (90% confidence level for 1 free parameter is quoted). Figure 2 shows the confidence contours on the (-plane. While the best fitting photon index is rather flatter than typical AGN (Winter et al., 2008), the typical value of lies within the 90% error range. The source is clearly highly absorbed, however, with a 90% lower limit of to the total absorbing column. This implies a lower-limit to the intrinsic absorbing column in UGC 2936 of , and is consistent with this sources classification as a Seyfert-2 galaxy (Véron-Cetty & Véron, 2001). Correcting for the absorption, the 0.5–10 keV luminosity of the best fitting model is . The 0.5–10 keV luminosity of the best fitting model with the photon index frozen at is .
In the case of UGC 1455 there were not enough counts to produce a meaningful spectrum. Instead, we used the PIMMS package to convert the count rate derived from wavdetect into a 0.5–10 keV luminosity assuming a powerlaw spectrum with and only Galactic absorption; the derived luminosity is .
For both of these objects, the compact emission coincides with the 2MASS galaxy centers, lending further support to the notion that this is AGN emission. Indeed, both of these objects have optically identified AGN emission lines (Schombert, 1998). The corresponding x-ray luminosity of the AGN in UGC 2936 is comparatively high, (Table 1) and comparable to the bright nearby Seyfert galaxies that show strong optical emission lines (Heckman et al., 2005). UGC 1455 has a comparatively lower AGN luminosity but is still bright compared to nearby low luminosity AGNs (LLAGNs) such as NGC 4303 which has a luminosity of (Jiménez-Bailón et al., 2003).
For the galaxies that did not show x-ray emission from the nucleus we used the lowest count rates of sources in the center of the field of view to derive upper estimates of AGN luminosities. We again used the CIAO program PIMMS to determine the x-ray flux values from which we derived upper limits of the x-ray luminosities. These limits are in the range and are quoted on an object-by-object basis in Table 1. This luminosity is comparable to the x-ray luminosities of nearby LLAGNs which have (Ho et al. 2001). Hence it is possible that the non-detections in our sample are a result of the galaxies being LLAGNs that are at large distances (Table 1).
3.2 Extended emission
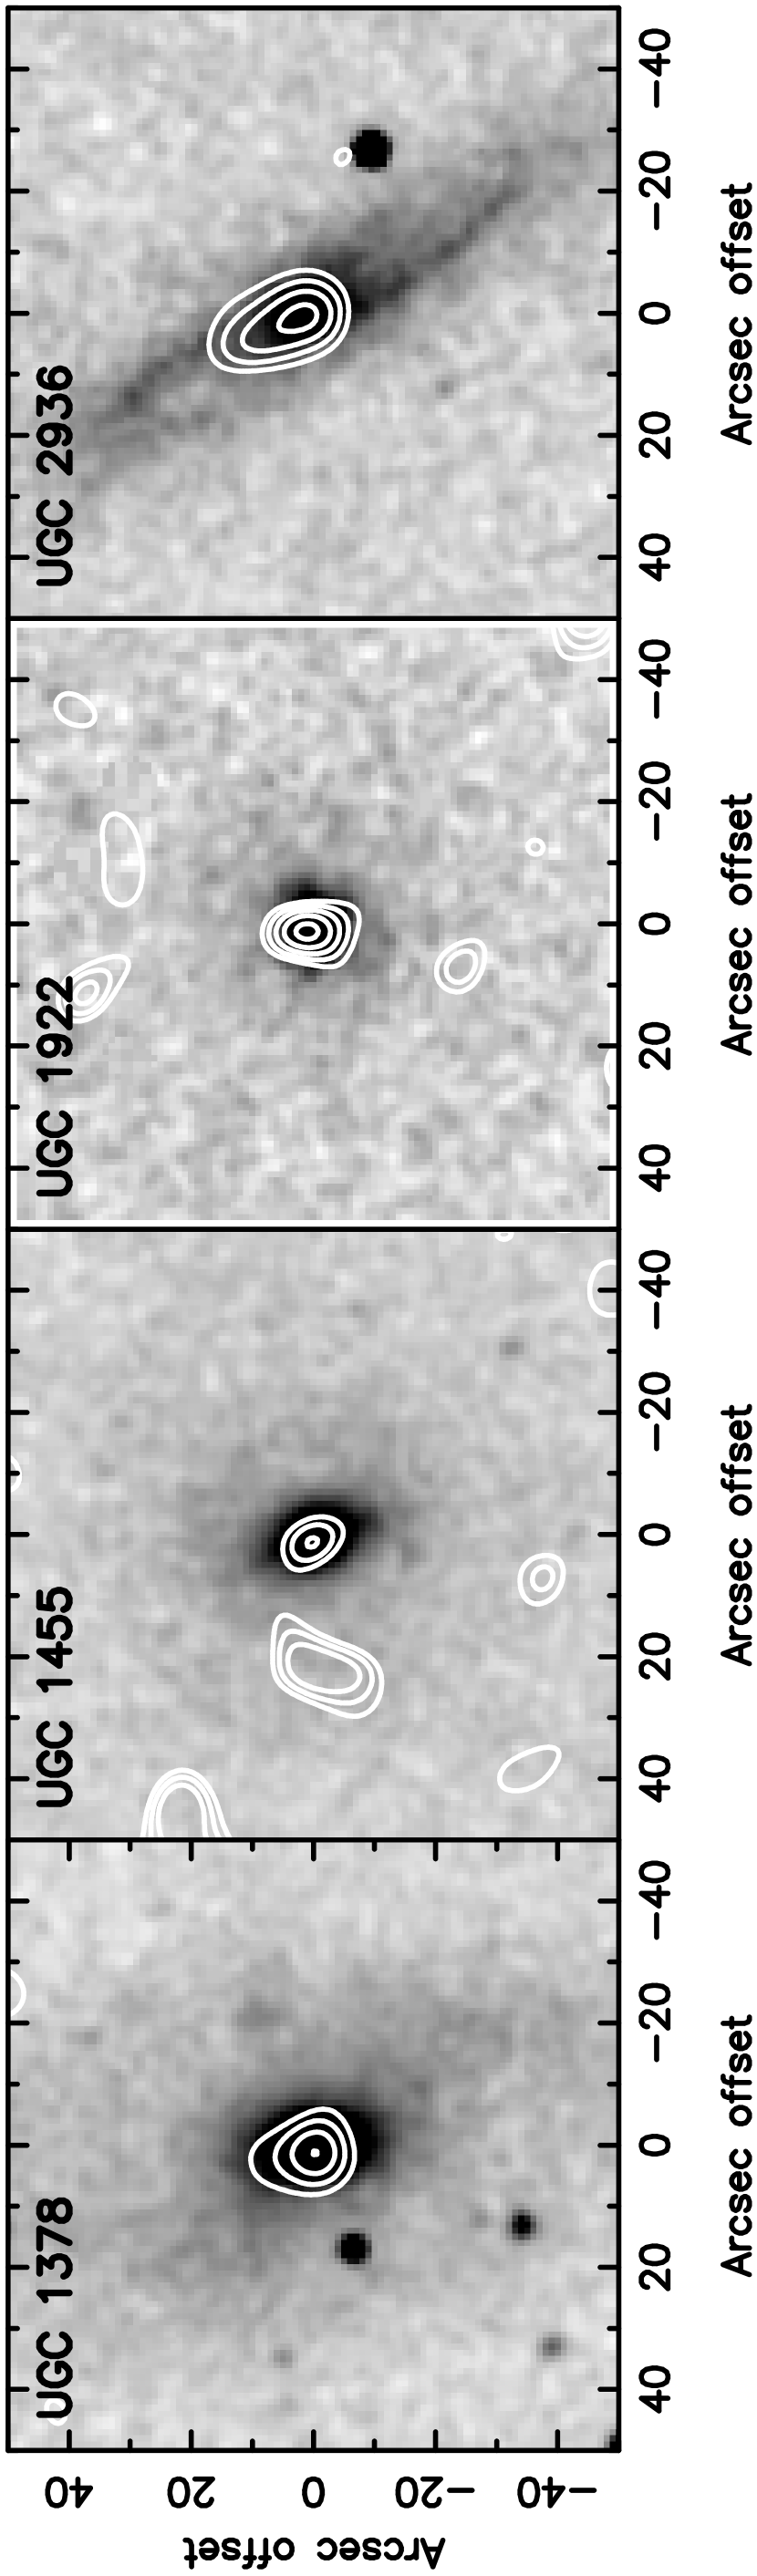
We searched for diffuse x-ray emission in the galaxies. Point sources were located using wavdetect. Elliptical regions around the sources were masked out and then filled based on the local background emission using the tool dmfilth. We finally smoothed the images using the routine aconvolve. This procedure gives detections of diffuse emission from four galaxies; UGC 1378, UGC 1455, UGC 1922 and UGC 2936; in all four cases the emission is associated with the galaxy center and mostly confined to the bulge (see Figure 3 which overlays x-ray contours on the 2MASS K-band images). The emission is weakest for UGC 1455 which has only a small pool of diffuse gas.
We made approximate estimates of the diffuse gas flux and luminosity using specextract. The spectra were extracted from the galaxy centers and then examined using XSPEC. The count statistics was poor and hence the fits only approximate. But we were able to obtain a first estimate of the diffuse gas luminosities in the centers of the galaxies (Table 1). For both UGC 1455 and UGC 2936 we detected a nuclear component (AGN) as well as diffuse emission. The emission in UGC 2936 is clearly non-symmetric about the galaxy center. Its origin may be disk star formation, or inverse Compton emission from a radio lobe. Deeper observations are required to spectrally distinguish between the two possible origins.
4 Discussion
(i) X-ray Bright AGN in LSB Galaxies : The detection of x-ray emission from the nuclei of UGC 2936 and UGC 1455 shows that though LSB galaxies are metal poor and have little ongoing star formation, their nuclei can host AGN activity that is bright in the x-ray domain. Another prominent LSB galaxy whose x-ray flux has been derived is UGC 6614 (Naik, Paul & Das, in preparation). It has an x-ray luminosity of which is comparable to that observed from UGC 2936 (Table 1). Thus the nuclear x-ray luminosity of UGC 1455 is comparable to that observed from the centers of Low Luminosity AGNs but the x-ray luminosities of both UGC 2936 and UGC 6614 are comparable to bright Seyfert nuclei. About 20 % of LSB galaxies show signs of AGN activity at optical wavelengths (Impey et al., 2001), which is similar to late type spirals (Sc-Sm) for which only about 15 % show AGN activity (Ho, 2008). A large fraction are also radio loud (Das et al., 2006, 2007). In our sample, excluding UGC 1455 and UGC 12845, the remaining galaxies are all radio loud (NVSS survey) (Condon et al., 1998) and the morphology is often a compact core with some associated extended emission representing perhaps radio lobes or jets from the AGN (Das et al. 2008, in preparation). Such a high fraction of radio cores are also detected in Seyferts and LINERs (Ho, 2008). Thus AGN activity in LSB systems is fairly similar to that seen in nearby Seyfert galaxies or LINERS, even though the disk morphology and star formation rate is very different from regular star forming galaxies on the Hubble Sequence.
(ii) Black Hole Masses : The clue to nuclear activity in giant LSB galaxies maybe the dominant bulge that is often observed in these galaxies (Schombert, 1998). AGNs are more frequently found in bright galaxies with large bulges (Ho et al., 1997) and their formation and growth is linked to the mass of the supermassive black hole (SMBH) (Ferrarese & Ford, 2005). To get an idea of the black hole masses in LSB galaxies we applied the virial technique to the AGN line emission observed from these galaxies. This method gives only an approximate estimate of as the emission lines could be broadened by non-gravitational effects. The can be derived from the H line luminositiy and linewidth (Greene & Ho, 2007). Unfortunately, the relevant optical data is not available for most LSB galaxies. Nor are these galaxies defined on the relation through other observations. Hence we were able to derive for only two galaxies: UGC 2936 and UGC 6614 using published H line luminosities and linewidths (Sprayberry et al., 1995; Schombert, 1998; Kennicutt, 1984). For UGC 2936 and for UGC 6614 . We then used the x-ray luminosities (see Table 1 for UGC 2936 and for UGC 6614 ) and the radio luminosities () of these galaxies to see where they lie on the - fundamental plane (Merloni et al., 2003). For UGC 2936 we used GMRT observations at 610 MHz and 1280 MHz to determine the radio spectral index () and then derived the at 5 GHz. Similarly for UGC 6614; however, in this galaxy the spectral index is flat and we used the flux density in the VLA 1.4 GHz map to derive at 5 GHz (Das et al., 2006). We find that both galaxies lie suprisingly well above the - plane and their values are considerably lower than galaxies lying on the correlation as shown in Figure 4. Thus though these LSB galaxies show AGN activity comparable to normal Seyferts, their nuclear black holes appear to be less massive than those detected in brighter galaxies.
(iii) Diffuse Emission from the Bulge : This is the first tentative detection of diffuse x-ray emission from LSB galaxies. Such emission may arise from massive star forming regions and supernovae (Cui et al., 1996; Strickland & Heckman, 2007) (e.g. M82), coronal x-ray emitting gas from galactic fountains (Fraternali & Binney, 2008) or star formation in spiral arms (Tyler et al., 2004) and is thus associated with metal enrichment in galaxies. In the galaxies UGC 1378 and UGC 1922 the diffuse gas is mainly concentrated in the bulge (Figure 3). For UGC 1455 it is associated with the bulge and the small, oval bar in the center, which may alternatively be a pseudobulge (de Jong, 1996). In UGC 2936 the emission is concentrated in the bulge but also extended on one side (see (iv)). Since there is no apparent ongoing star formation activity in any of the galaxies except UGC 2936 which shows patchy emission over the disk and nucleus (Robitaille et al., 2007) the most likely origin for the diffuse emission is the old stellar population in the bulges as well as AGN activity in the center of these galaxies. The luminosity is to which is similar to that observed from the centers of nearby spiral galaxies (Tyler et al., 2004). We also determined the mid-infrared emission (at ) for 5 galaxies in our sample; these were all IRAS values from NED (Table 1). The mid-IR flux values are similar to that observed from the centers of nearby bright galaxies in Tyler et al. (2004). This further supports the idea that the diffuse emission arises from star formation associated with the bulge.
(iv) Diffuse Emission Extending into the Disk in UGC 2936 : The diffuse emission in UGC 2936 clearly extends out into the disk on one side of the galaxy center in the north-east direction (Figure 3). The simplest intrepretation is spiral arm star formation. However, we do not detect similar emission from the other side. The asymmetry suggests that we cannot rule out an x-ray jet origin for the emission; the jet may be associated with the strong AGN activity in the galaxy. Further observations are required to understand this interesting feature.
(v) Bulge Evolution Independent of Disk Evolution ? : Our observations show that LSB galaxies host AGN and relatively massive black holes despite having poorly evolved disks. They are similar to bulgeless late type spirals in their disk properties (Böker et al., 2002) but closer to bulge dominated galaxies in their nuclear properties. Thus the disks and nuclei of these galaxies may have evolved fairly independently of each other. One of the reasons for this kind of evolution could be the shape of the dark halo potential in LSB galaxies. The halo potential is found to be relatively shallow in the center or bulge (de Naray et al., 2008; Zackrisson et al., 2006) but relatively strong in the disk. This would allow the center to evolve whereas disk instabilities would be suppressed by the presence of the dark matter halo at larger radii (Mihos et al., 1997). Alternatively, the bulges may have evolved through other processes such as galaxy collisisons (Mapelli et al., 2008); however the disks in such processes have to remain fairly undisturbed which is a tough constraint for such models. Another process could be the slow secular evolution of the disk through the formation of oval distortions or pseudobulges (Kormendy & Kennicutt, 2004). The latter process is more likely as some giant LSB galaxies are found to have photometric signatures of pseudobulges (Pizzella et al., 2008). Overall these galaxies represent a good example of decoupled bulge-disk evolution and the underlying processes should be investigated in more detail.
5 CONCLUSIONS
We present Chandra observations of eight giant, LSB galaxies all of which have a sizable bulge. Our main results are the following.
(i) We have detected compact x-ray emission from the nuclei of two LSB galaxies, UGC 1455 () and UGC 2936 (); it is due to AGN activity in these galaxies. The AGN emission is similar to that observed from the centers of nearby Seyfert and LINER galaxies.
(ii) For the galaxies UGC 2936 (our sample) and UGC 6614 (XMM archival data), we combined x-ray luminosities with radio luminosities and black hole masses to determine the location of these galaxies on the radio-x-ray fundamental plane. We find that both galaxies lie above the plane which suggests that their nuclei harbor less massive black holes compared to normal galaxies on the plane.
(iii) Diffuse x-ray emission was detected from the bulges of four galaxies. The luminosity is similar to that observed from the centers of nearby star forming galaxies. These results combined with AGN emission suggests that the AGN and bulges of LSB galaxies have followed an evolutionary path similar to bulge dominated bright galaxies even though their LSB disks are poorly evolved.
(iv) The detection of AGN and diffuse emission from the bulges of LSB galaxies shows that galaxies with unevolved disks can have normal bulges. Thus, whatever star formation processes made the bulge did not make the disk component in these galaxies. In fact the bulge and disk evolution appears to be distinctly decoupled in these galaxies. Giant LSB galaxies are thus good sites to study decoupled bulge-disk evolutionary processes.
References
- Barth (2007) Barth, A. J. 2007, AJ, 133, 1085
- Beijersbergen et al. (1999) Beijersbergen, M., de Blok, W. J. G., & van der Hulst, J. M. 1999, A&A, 351, 903
- Boissier et al. (2008) Boissier, S., Gil de Paz, A., Boselli, A., Buat, V., Madore, B., Chemin, L., Balkowski, C., Amram, P., Carignan, C., & van Driel, W. 2008, ArXiv e-prints, 803
- Böker et al. (2002) Böker, T., Laine, S., van der Marel, R. P., Sarzi, M., Rix, H.-W., Ho, L. C., & Shields, J. C. 2002, AJ, 123, 1389
- Bothun et al. (1985) Bothun, G. D., Beers, T. C., Mould, J. R., & Huchra, J. P. 1985, AJ, 90, 2487
- Burkholder et al. (2001) Burkholder, V., Impey, C., & Sprayberry, D. 2001, AJ, 122, 2318
- Condon et al. (1998) Condon, J. J., Cotton, W. D., Greisen, E. W., Yin, Q. F., Perley, R. A., Taylor, G. B., & Broderick, J. J. 1998, AJ, 115, 1693
- Cui et al. (1996) Cui, W., Sanders, W. T., McCammon, D., Snowden, S. L., & Womble, D. S. 1996, ApJ, 468, 117
- Das et al. (2007) Das, M., Kantharia, N., Ramya, S., Prabhu, T. P., McGaugh, S. S., & Vogel, S. N. 2007, MNRAS, 379, 11
- Das et al. (2006) Das, M., O’Neil, K., Vogel, S. N., & McGaugh, S. 2006, ApJ, 651, 853
- de Jong (1996) de Jong, R. S. 1996, A&AS, 118, 557
- de Naray et al. (2004) de Naray, R. K., McGaugh, S. S., & de Blok, W. J. G. 2004, MNRAS, 355, 887
- de Naray et al. (2008) —. 2008, ApJ, 676, 920
- Ferrarese & Ford (2005) Ferrarese, L., & Ford, H. 2005, Space Science Reviews, 116, 523
- Fraternali & Binney (2008) Fraternali, F., & Binney, J. J. 2008, MNRAS, 386, 935
- Graham (2003) Graham, A. W. 2003, AJ, 125, 3398
- Greene & Ho (2007) Greene, J. E., & Ho, L. C. 2007, ApJ, 670, 92
- Heckman et al. (2005) Heckman, T. M., Ptak, A., Hornschemeier, A., & Kauffmann, G. 2005, ApJ, 634, 161
- Hinz et al. (2007) Hinz, J. L., Rieke, M. J., Rieke, G. H., Willmer, C. N. A., Misselt, K., Engelbracht, C. W., Blaylock, M., & Pickering, T. E. 2007, ApJ, 663, 895
- Ho (2008) Ho, L. C. 2008, ArXiv e-prints, 803
- Ho et al. (1997) Ho, L. C., Filippenko, A. V., & Sargent, W. L. W. 1997, ApJ, 487, 568
- Hoffman et al. (1992) Hoffman, Y., Silk, J., & Wyse, R. F. G. 1992, ApJ, 388, L13
- Impey & Bothun (1989) Impey, C., & Bothun, G. 1989, ApJ, 341, 89
- Impey & Bothun (1997) —. 1997, ARA&A, 35, 267
- Impey et al. (2001) Impey, C., Burkholder, V., & Sprayberry, D. 2001, AJ, 122, 2341
- Jiménez-Bailón et al. (2003) Jiménez-Bailón, E., Santos-Lleó, M., Mas-Hesse, J. M., Guainazzi, M., Colina, L., Cerviño, M., & González Delgado, R. M. 2003, ApJ, 593, 127
- Kennicutt (1984) Kennicutt, Jr., R. C. 1984, ApJ, 287, 116
- Kormendy & Kennicutt (2004) Kormendy, J., & Kennicutt, Jr., R. C. 2004, ARA&A, 42, 603
- Mapelli et al. (2008) Mapelli, M., Moore, B., Ripamonti, E., Mayer, L., Colpi, M., & Giordano, L. 2008, MNRAS, 383, 1223
- Merloni et al. (2003) Merloni, A., Heinz, S., & di Matteo, T. 2003, MNRAS, 345, 1057
- Mihos et al. (1997) Mihos, J. C., McGaugh, S. S., & de Blok, W. J. G. 1997, ApJ, 477, L79+
- O’Neil et al. (2007) O’Neil, K., Oey, M. S., & Bothun, G. 2007, AJ, 134, 547
- O’Neil & Schinnerer (2003) O’Neil, K., & Schinnerer, E. 2003, ApJ, 588, L81
- Pickering et al. (1999) Pickering, T. E., van Gorkom, J. H., Impey, C. D., & Quillen, A. C. 1999, AJ, 118, 765
- Pizzella et al. (2005) Pizzella, A., Corsini, E. M., Dalla Bontà, E., Sarzi, M., Coccato, L., & Bertola, F. 2005, ApJ, 631, 785
- Pizzella et al. (2008) Pizzella, A., Corsini, E. M., Sarzi, M., Magorrian, J., Méndez-Abreu, J., Coccato, L., Morelli, L., & Bertola, F. 2008, MNRAS, 387, 1099
- Rahman et al. (2007) Rahman, N., Howell, J. H., Helou, G., Mazzarella, J. M., & Buckalew, B. 2007, ApJ, 663, 908
- Robitaille et al. (2007) Robitaille, T. P., Rossa, J., Bomans, D. J., & van der Marel, R. P. 2007, A&A, 464, 541
- Rosenbaum & Bomans (2004) Rosenbaum, S. D., & Bomans, D. J. 2004, A&A, 422, L5
- Schombert (1998) Schombert, J. 1998, AJ, 116, 1650
- Sprayberry et al. (1995) Sprayberry, D., Impey, C. D., Bothun, G. D., & Irwin, M. J. 1995, AJ, 109, 558
- Strickland & Heckman (2007) Strickland, D. K., & Heckman, T. M. 2007, ApJ, 658, 258
- Tyler et al. (2004) Tyler, K., Quillen, A. C., LaPage, A., & Rieke, G. H. 2004, ApJ, 610, 213
- Véron-Cetty & Véron (2001) Véron-Cetty, M.-P., & Véron, P. 2001, A&A, 374, 92
- Winter et al. (2008) Winter, L. M., Mushotzky, R. F., Tueller, J., & Markwardt, C. 2008, ApJ, 674, 686
- Zackrisson et al. (2006) Zackrisson, E., Bergvall, N., Marquart, T., & Östlin, G. 2006, A&A, 452, 857
| Galaxy | Distance | Galaxy | Observation | Exposure | AGN | Diffuse Gas | Mid-IR |
|---|---|---|---|---|---|---|---|
| Name | (Mpc) | Position | ID | Time | Luminosity | Luminosity | Flux |
| RA, (J2000) | (Ks) | (erg s-1) | (erg s-1) | (erg cm-2s-1) | |||
| UGC 1455 | 67.3 | , | 7764 | 3.79 | |||
| UGC 2936 | 51.2 | , | 7769 | 2.74 | |||
| UGC 1378 | 38.8 | , | 7763 | 3.45 | |||
| UGC 1922 | 150.0 | , | 7884 | 5.88 | … | ||
| UGC 3059 | 65.8 | , | 7765 | 3.34 | … | ||
| UGC 4422 | 63.4 | , | 7766 | 2.94 | … | ||
| UGC 11754 | 62.6 | , | 7767 | 4.15 | … | ,,, | |
| UGC 12845 | 63.9 | , | 7768 | 3.25 | … | … |
.
