Variable Intrinsic Absorption in Mrk 279
Abstract
We examine the variability in the intrinsic absorption in the Seyfert 1 galaxy Mrk 279 using three epochs of observations from the Far Ultraviolet Spectroscopic Explorer (FUSE) and two epochs of observations with the Space Telescope Imaging Spectrograph on the Hubble Space Telescope. Rather than finding simple photoionization responses of the absorbing gas to changes in the underlying continuum, the observed changes in the absorption profiles can be understood more clearly if the effective covering fraction of the gas in all emission components, continuum and broad and intermediate velocity width emission lines, is accounted for. While we do not uniquely solve for all of these separate covering fractions and the ionic column densities using the spectral data, we examine the parameter space using previously well-constrained solutions for continuum and single emission component covering fractions. Assuming full coverage of the continuum, we find that of the two velocity components of the Mrk 279 absorption most likely associated with its outflow, one likely has zero coverage of the intermediate line region while the other does not. For each component, however, the broad line region is more fully covered than the intermediate line region. Changes in the O VI column densities are unconstrained due to saturation, but we show that small changes in the nonsaturated C IV and N V column densities are consistent with the outflow gas having zero or partial covering of the intermediate line region and an ionization parameter changing from 0.01 to 0.1 from 2002 to 2003 as the UV continuum flux increased by a factor of 8. The absence of a change in the C III absorbing column density is attributed to this species arising outside the Mrk279 outflow.
1 Introduction
Mass outflows from low-redshift active galactic nuclei (AGNs) are inferred from blueshifted, variable X-ray and UV absorption which often shows evidence for partial coverage of the contintuum source in nearly one half of all nearby Seyfert galaxies (see review in Crenshaw, Kraemer, & George 2003 and recent results in Dunn et al. 2007). In addition to possibly playing a strong role in the accretion process (Blandford & Begelman 1999, 2004), AGN outflows likely have substantial impacts on their environments, providing feedback energy to regulate the formation of galaxies and clusters of galaxies (Granato et al. 2004, Scannapieco & Oh 2004, Scannapieco, Silk, & Bouwens 2007); to set the luminosity-temperature relation in galaxy clusters (Cavaliere et al. 2002); to distribute metals in galaxy clusters (Moll et al. 2007) and into the intergalactic medium (Adelberger et al. 2003).
Theoretical models of AGN outflows, from accretion disk winds (Königl & Kartje 1994, Murray et al. 1995, Proga 2000, 2003, Proga, Stone, & Kallman 2000, Proga & Kallman 2004), or from ablation from the obscuring torus (Krolik & Kriss 1995, 2001) place the absorbing material at different distances from the central engine and with different orientations with respect to the broad line region (BLR). A large sample of high resolution X-ray and UV spectra of ouflows in nearby Seyferts from Chandra, XMM-Newton, the Far Ultraviolet Spectroscopic Explorer (FUSE) and from the Space Telescope Imaging Spectrograph (STIS) onboard the Hubble Space Telescope has been building in the literature over the last decade, providing much insight into the physical conditions in these ouflows. However, a broad understanding of these outflows has yet to emerge, and several outstanding questions remain, namely: What is the relationship between the X-ray- and UV- absorbing gas?; What is the location and structure of the absorbing material?; Is the observed variability in some absorption profiles a response to flux variations in the central engine (Krolik & Kriss 1995, Shields & Hamann 1997, Crenshaw et al. 2000, Kraemer et al. 2002) or to bulk motions of the absorbing gas (Crenshaw & Kraemer 1999, Kraemer et al. 2001, Gabel et al. 2003b)?
In general, it is difficult to associate a particular UV absorption component with the X-ray absorber unambiguously, in part due to relatively low spectral resolution in X-ray data and in part because the ionization modeling is sensitive to the shape of the UV-to-X-ray continuum (Kaspi et al. 2001). However, with the exception of campaigns on Mrk 279, using FUSE, STIS, and Chandra with both the High Energy Transmission Grating (HETG) (Scott et al. 2004, Gabel et al. 2005a, S04 and G05 hereafter) and the Low Energy Transmission Grating (Costantini et al. 2007), on NGC 7469 (Scott et al. 2005) using FUSE, STIS, and Chandra/HETG, the long-term observing campaign on NGC 3783, using FUSE, STIS, and Chandra/HETG (Kaspi et al. 2002, Netzer et al. 2003, Gabel et al. 2003a, 2005b), and the campaign on NGC 4151 using FUSE, STIS, and Chandra/HETG (Kraemer et al. 2005, Kraemer et al. 2006, Crenshaw & Kraemer 2007), UV and X-ray observations are generally obtained at different times.
Several observations of the absorption profiles taken over a period of time are particularly useful for addressing the last two questions mentioned above, as they provide contraints on the response time of the gas to variability in the central engine and thus limits on the distance of the absorber from the continuum-emitting region. Mrk 279 () has been the subject of an intensive campaign of simultaneous observations in the UV and X-ray (S04, Kaastra et al. 2004, Arav et al. 2005, 2007, G05, Costantini et al. 2007). In this paper, we use several epochs of UV spectral obsevations of Mrk 279 over 1999 to 2003 from FUSE and STIS presented in S04 and G05 to investigate the variability of the column density and/or covering fraction of the outflow over time. We choose to concentrate on the UV data because the 2002 epoch of Chandra observations coincided with a low flux state. The grating data therefore have signal-to-noise (S/N) too low to perform detailed analyses (S04).
The spectral coverage of FUSE provides information on H I absorption in Ly and higher order Lyman transitions, and C III 977, while the STIS observations cover Ly and the N V, Si IV, and C IV doublets. The different epochs permit us to investigate the effects of UV continuum variability on the intrinsic absorption. The analysis presented here will also take into account changes in absorption profiles that may be a result of differing contributions of the various emission sources, i.e. continuum versus broad lines, in different observation epochs.
2 Continuum and Emission Lines
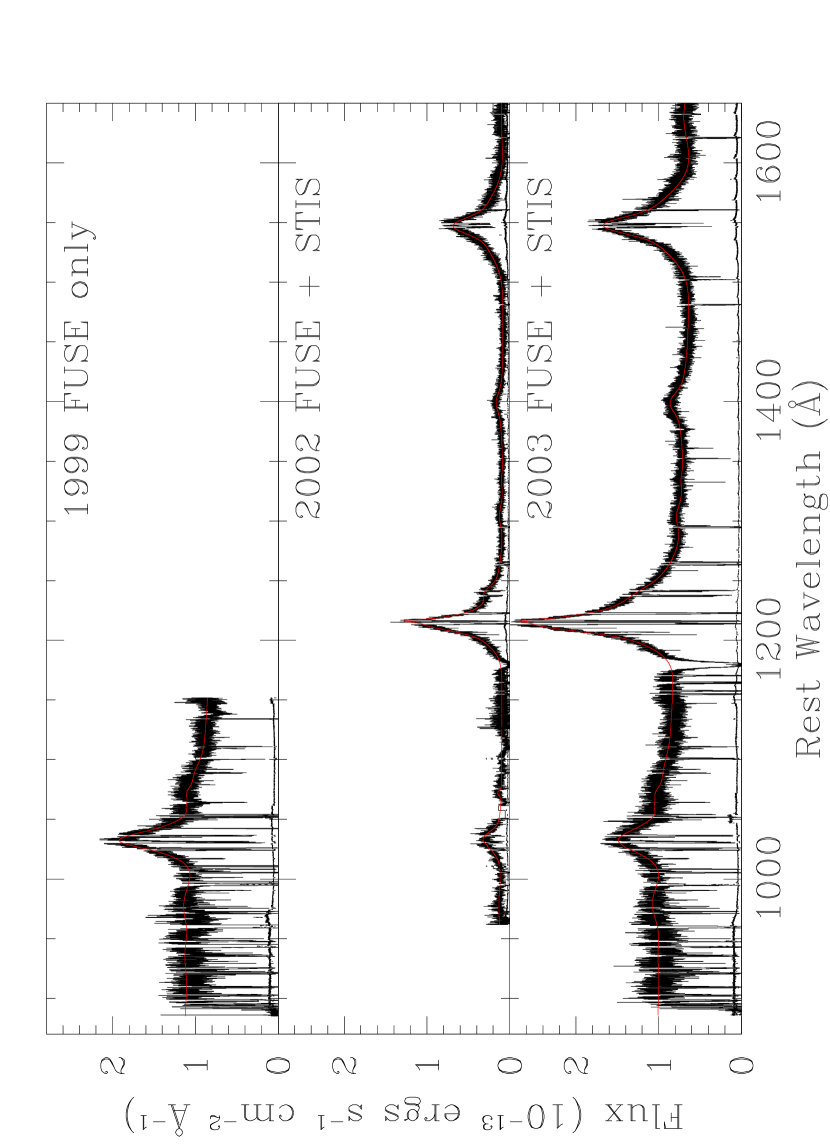
Table 1 summarizes the data used in this analysis. See S04 and G05 for full presentations of the FUSE and STIS spectra. The 1999 FUSE spectrum and the 2002 and 2003 FUSE + STIS spectra are shown in Figure 1.
We fit a power law continuum of the form to the 2003 FUSE and STIS spectra simultaneously, where the normalization, , is the flux at 1000 Å, and we include the Galactic extinction law of Cardelli, Clayton & Mathis (1989) with R and E ( B - V ) = 0.016 (Schlegel, Finkbeiner, & Davis 1998) in the continuum fits. The best fit continuum slope and normalization are and ergs s-1 cm-2 Å-1. For the 1999- and 2002-epoch data we found and , respectively. These results are shown graphically in Figure 2. The 1999 and 2003 epochs are high flux states, and the continuum becomes bluer as it brightens.
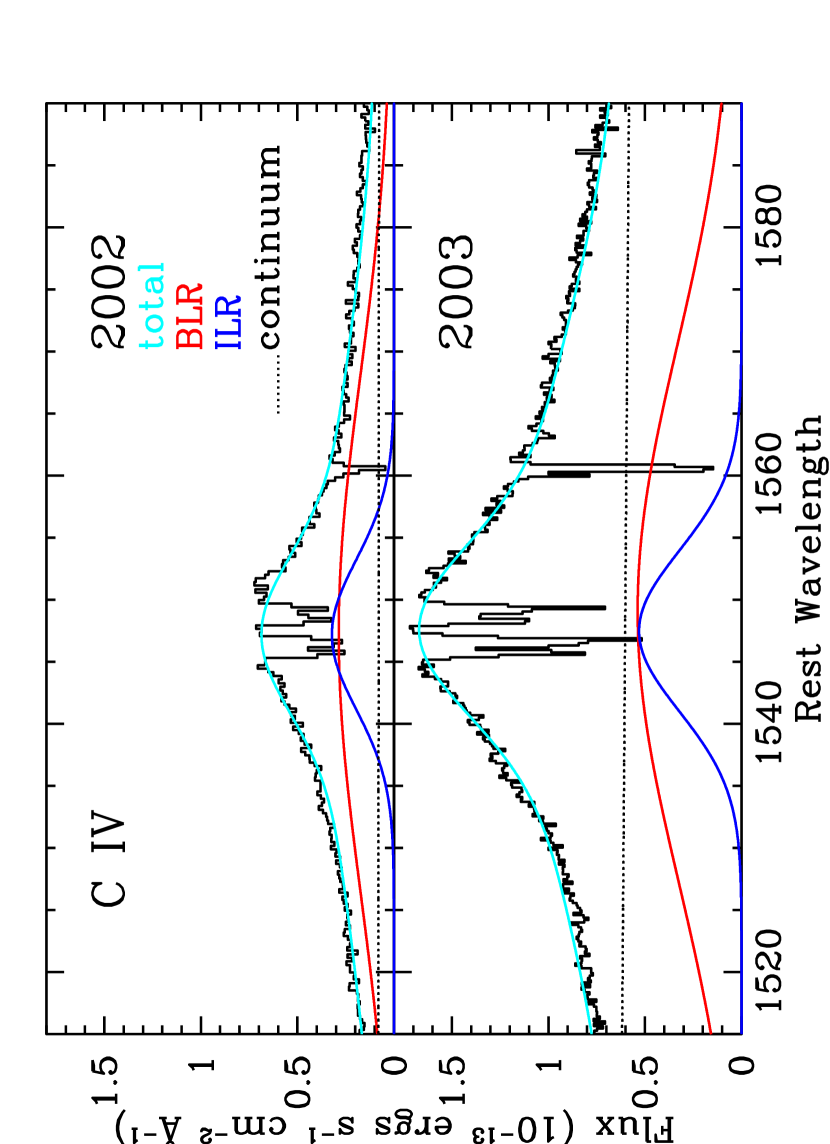
We fit Gaussian profiles to the emission lines in the combined FUSE+STIS spectrum. The emission lines we identify and fit are listed in Table 2. See Table 3 of S04 for the fits to the 1999- and 2002-epoch spectra. An F-test confirms that the most prominent features require contributions from both a broad velocity component (BLR, FWHM km s-1) and an intermediate one (ILR, FWHM km s-1). The resulting values of the reduced chi-squared, and , for 2002 and 2003 data, respectively, are significantly improved from the values of 2 achieved with no ILR component. We do not attempt to add any more components to the fit to improve the because there are no remaining systematics in the fit residuals and because these added components would not be well-motivated physically. The full spectra with fits are shown in Figure 1.
We note that some of the fitted emission lines show velocity shifts of hundreds of km s-1 from their 2002 positions. We performed an emission line fit for the 2003 data with the line centroids tied to their 2002 values. This led to a larger in the final fit (1.6 versus 1.5), but did not change the results of the absorption line analysis presented below. Since we will treat our emission model as phenomenological and because S04 did not constrain the line centroids in this way (e.g. in fitting the 1999, 2000, and 2002 epoch spectra), we will use the emission model with the emission line velocity shifts in place.
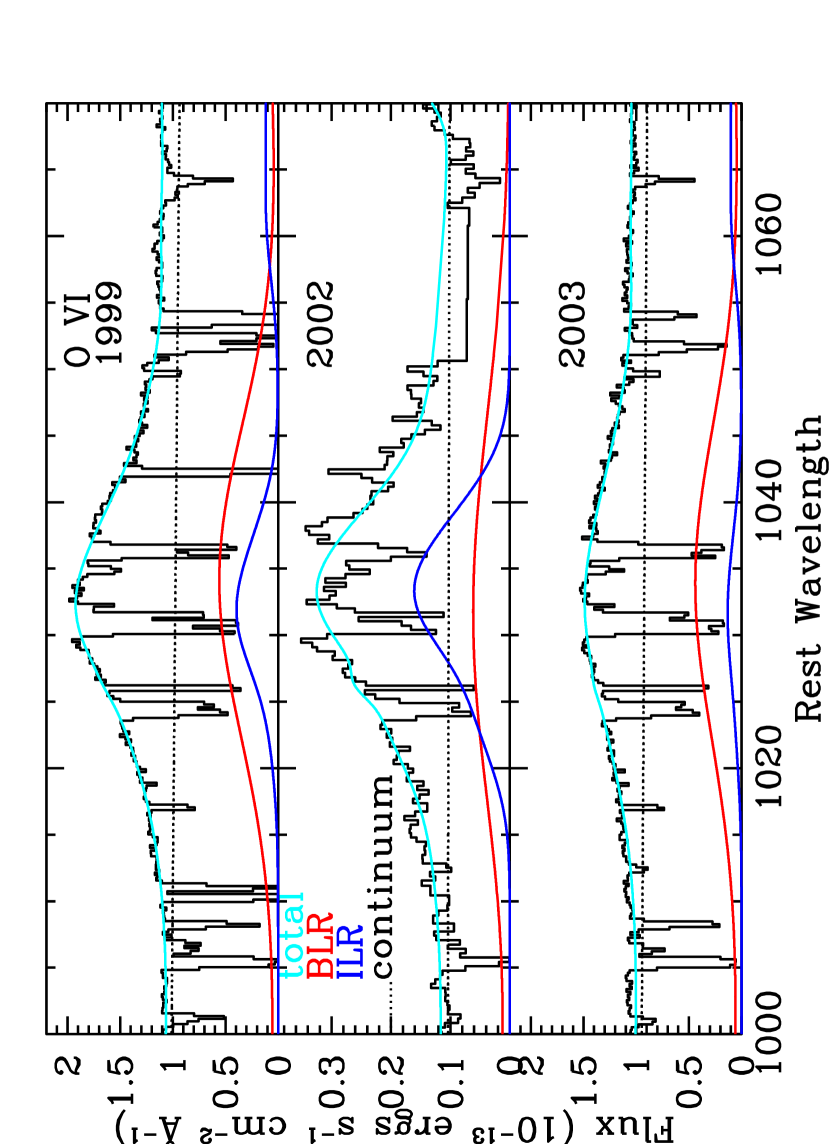
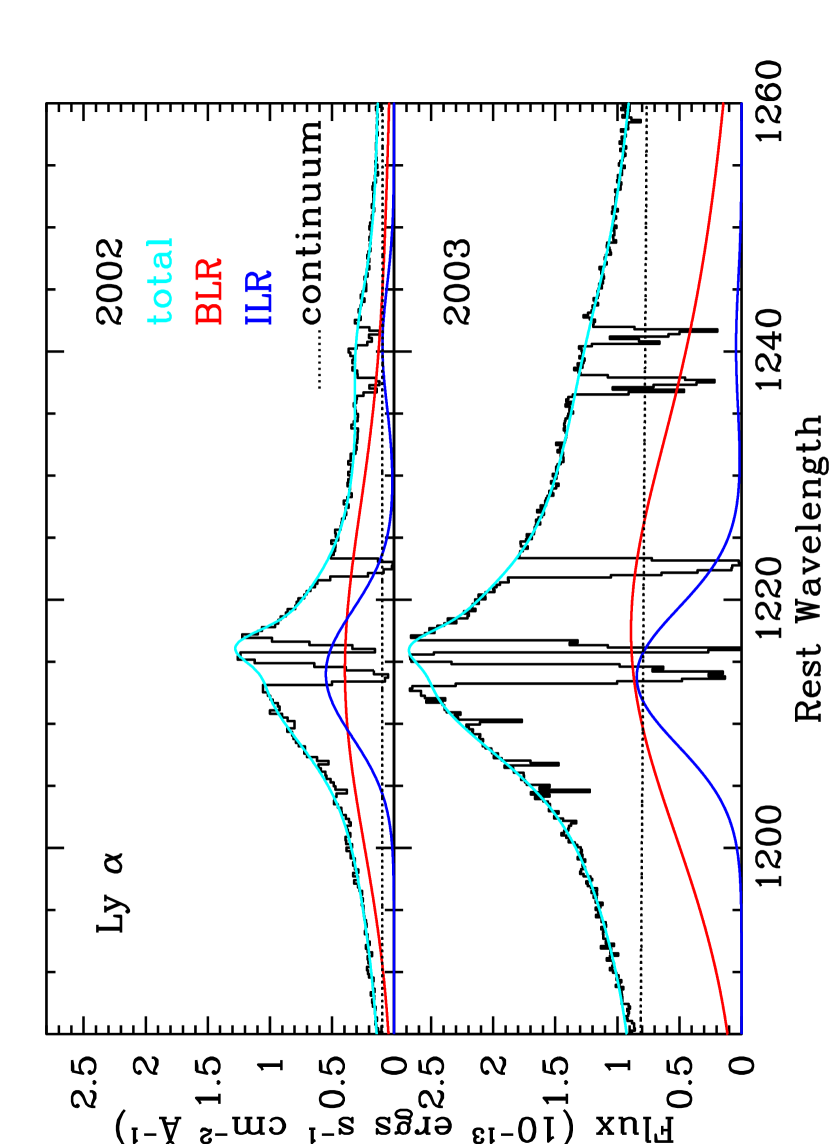
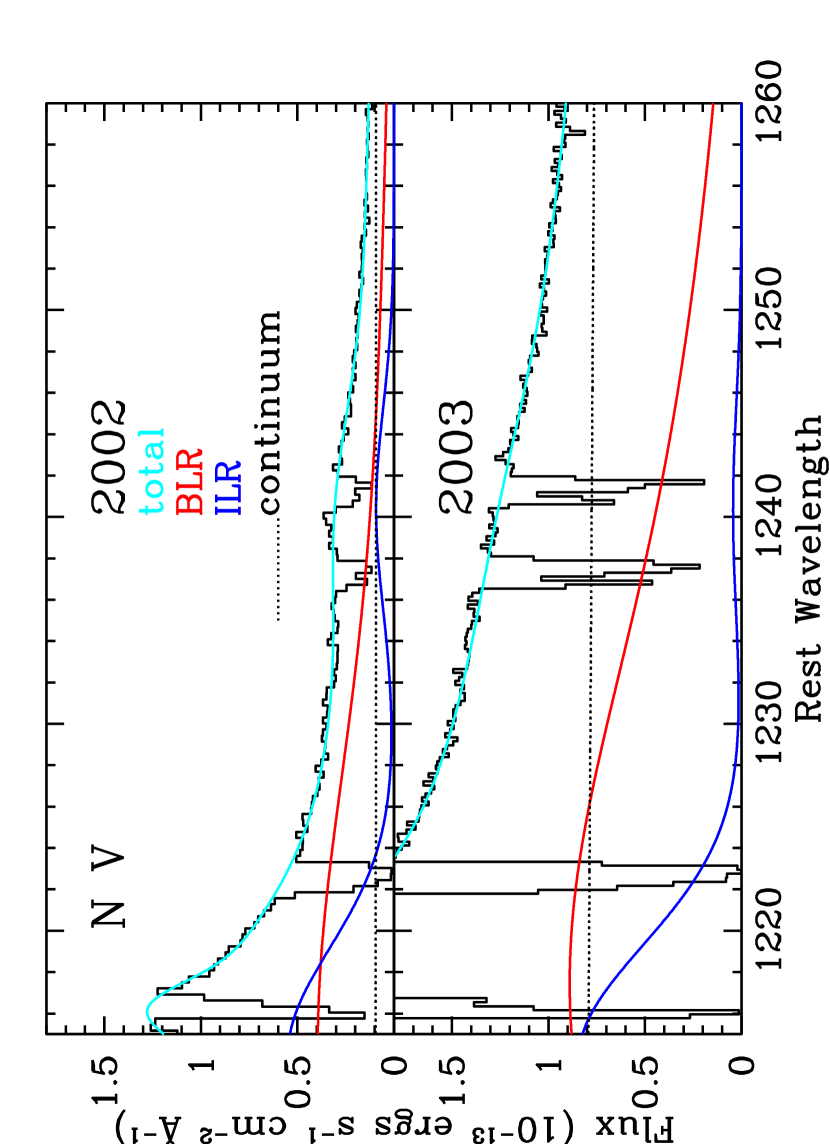
We show the emission profiles for the 2002 and 2003 spectra in Figures 3-6. For all these ions, the continuum flux is clearly stronger relative to the emission lines in the high flux states in 1999 and 2003. The O VI intermediate line emission is stronger relative to the broad line in 2002 than in 1999 or in 2003, when the continuum fluxes were higher. In fact, the ILR component is very weak in the 2003 spectrum. The same is true for the Ly and N V intermediate lines. They too are stronger relative to their respective broad lines in the 2002 low flux state than in 2003, the only two epochs we can compare with STIS data. For C IV, the difference between the low and high flux states is less pronounced. Figure 6 shows that the intermediate width line is only slightly more prominent relative to the broad line in 2002 than in 2003.
3 Intrinsic Absorption
S04 identified several velocity components to the absorption in the Mrk 279 spectrum extending over -600 km s-1 - +100 km s-1 with respect to the systemic redshift of the AGN, taken to be . These components, based on the velocity structure in the Ly profile, were labeled 1, 2, 2a, 2b, 3, 4, 4a, and 5. G05 added a component 2c to this, based on additional velocity structure in the C IV and N V absorption. S04 concluded that Components 1 and 4 ( km s-1 and km s-1 in Ly, respectively) are likely associated with the disk and possibly the halo of the host galaxy of the AGN and/or its companion, MCG +12-13-024, while the origins of Components 3 and 5 ( km s-1 and km s-1 in Ly, respectively) are ambiguous. The absorption from highly ionized species over the entire velocity range is taken to be intrinsic by G05, as is the H I absorption that is uncontaminated by any possible contribution from low-ionization components seen in C II, C III, N III, Si II, and Si III, i.e. km s-1. We will follow that convention in this paper, referring to Components 2 and 4 in the highly ionized species to be the absorption complexes centered at and respectively.
The most general form of the intrinsic absorption profile for a particular species accounts not only for partial covering, but also for multiple emission sources:
| (1) |
where is the line intensity at velocity bin , is the ratio of source to the total flux at , is the optical depth of the absorber at , and is the effective covering fraction of the absorber with respect to source at velocity bin (S04, G05).
The effective covering fraction at bin is the weighted sum of individual covering fractions summed over all emission sources (G05):
| (2) |
G05 found that changes in the Ly absorption profile between the 2002 and 2003 epochs could be explained by the change in the effective covering fraction arising from the change in the relative contribution of the continuum and broad line region to the total flux in each epoch. No changes in the individual emission component covering fractions or in the H I column density are necessary to produce the observed reduction in depth of the absorption trough in Components 2-2a between the 2002 and 2003 epochs.
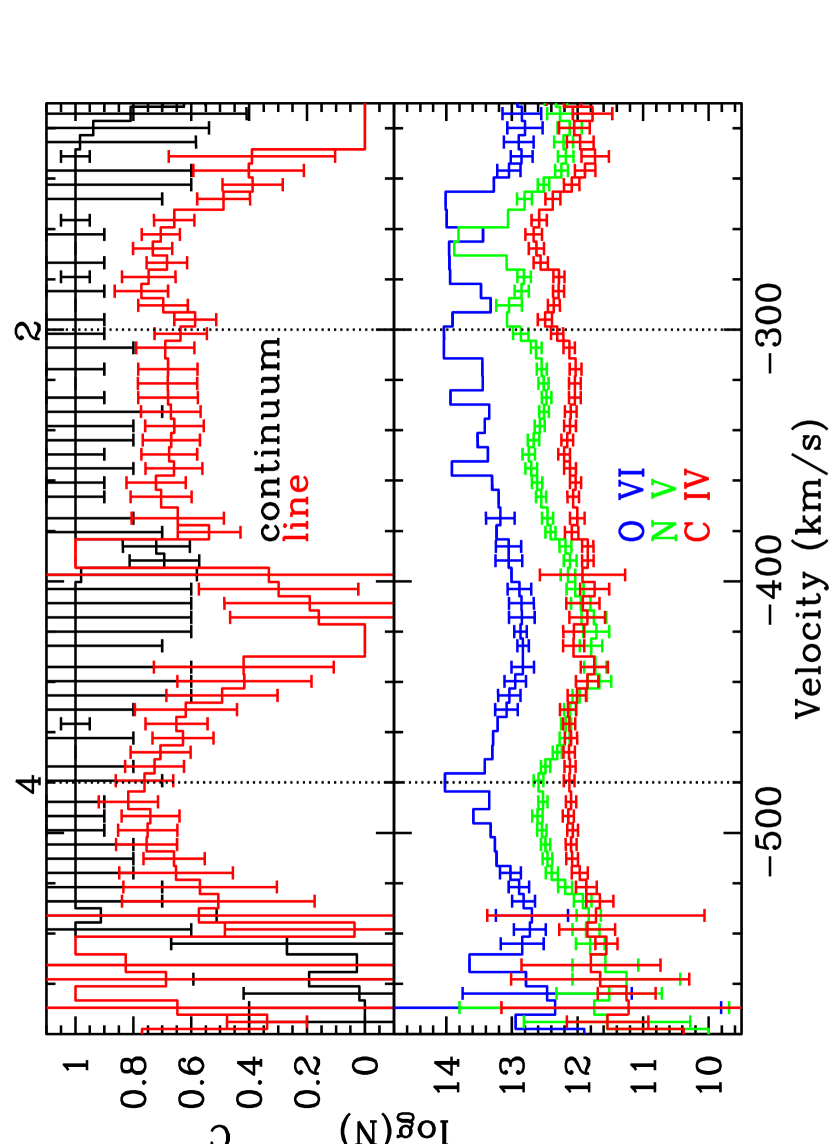
However, we found that this method cannot account for the changes in the absorption profiles of O VI, N V, and C IV between the 2002 and 2003 epochs if only the continuum and emission line sources are considered separately. Below we will examine this ionic absorption variability while treating the intermediate width emission line components as a separate emission source. For O VI, we also include the 1999 epoch for which we have additional FUSE data. We will use the well-constrained covering fraction and column density solutions derived by G05 from the high flux state 2003 data shown in Figure 7. These solutions are the global CNO fits, the simultaneous fits to the O VI, N V, and C IV doublets described by G05. The continuum covering fraction is effectively unity over the entire velocity range of the absorption while the total emission line covering fraction varies. For the remainder of this paper, however, we shall set (see also Arav et al. 2007).
First, however, in the following section we will describe the general observed variation of the intrinsic absorption. For each species, in each epoch, we show and discuss the normalized absorption profiles in the following figures and sections under the assumption . We know this assumption is not strictly true, given the covering fraction and column density solutions shown in Figure 7; but we use this as a heuristic model and a starting point for further analysis. In Section 4, we discuss photoionization models for this outflow, and in Section 5 we discuss the importance of these photoionization effects relative to changes in the effective covering fraction of the absorption resulting from variations in the underlying emission sources, primarily the broad and intermediate velocity width emission lines.
3.1 Description of Normalized Absorption Profiles
3.1.1 O VI
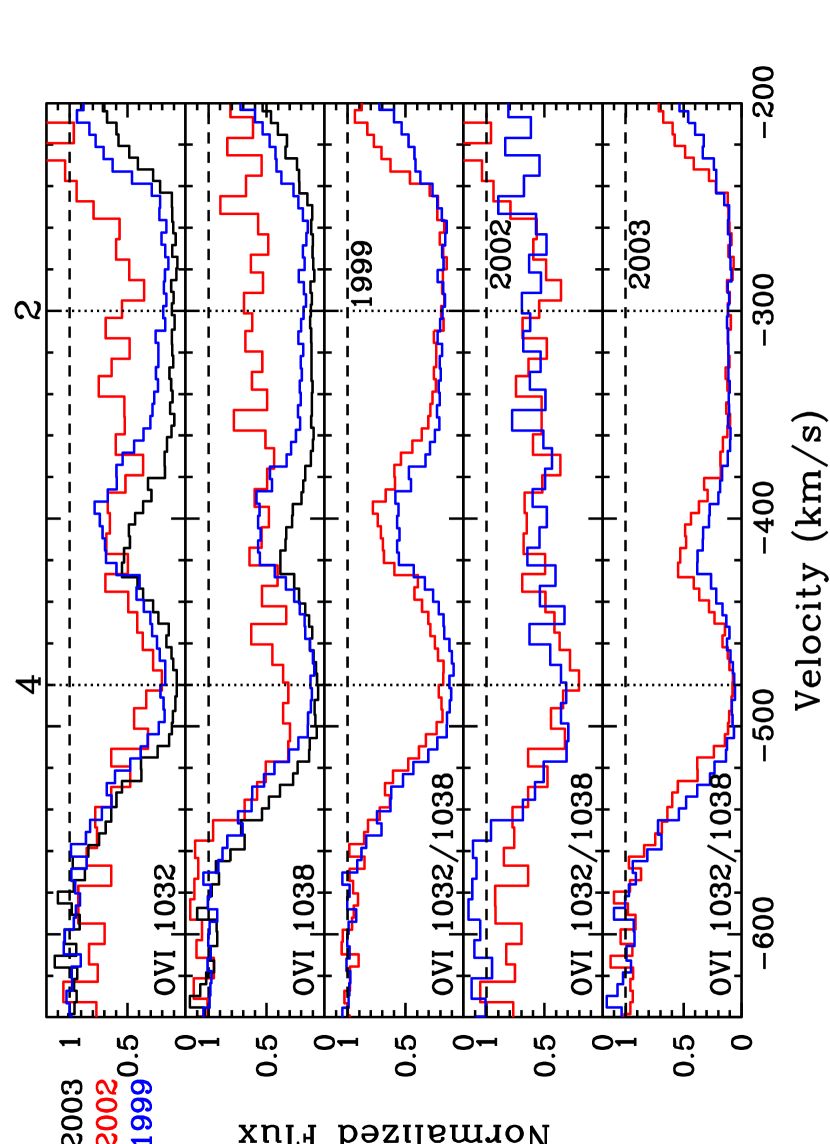
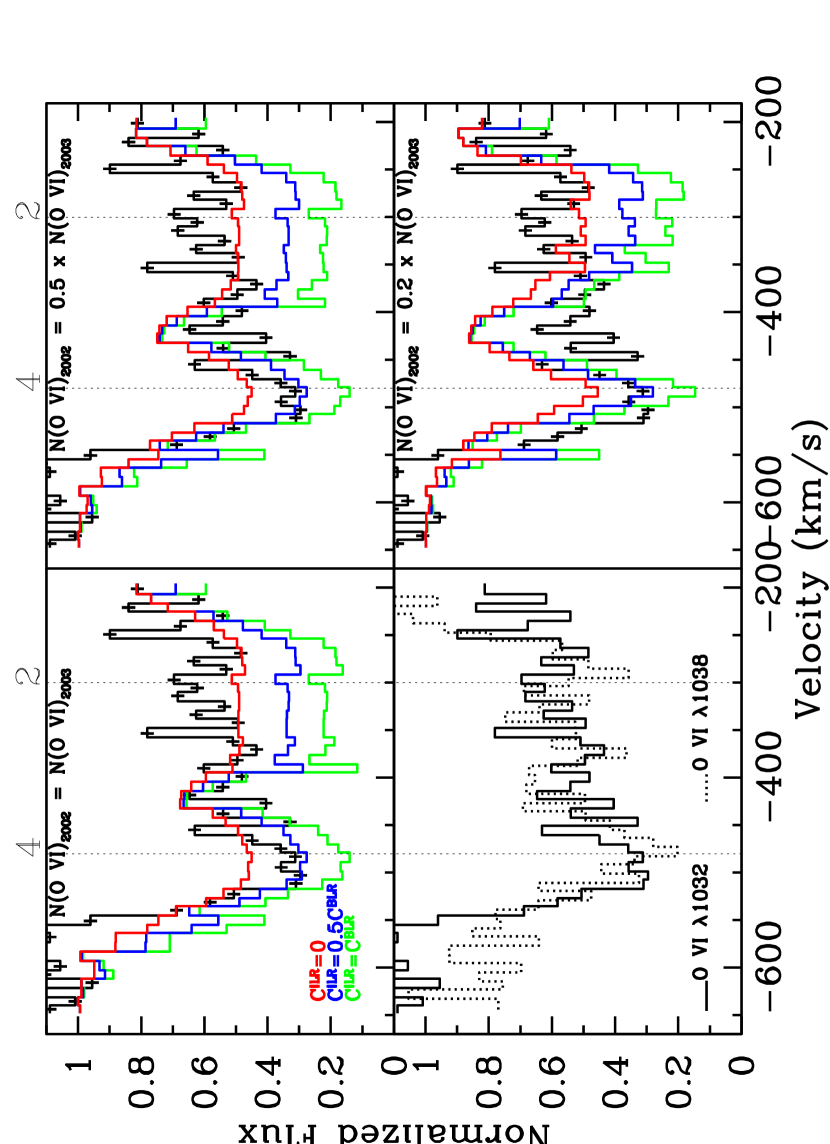
Figure 8 shows the O VI profile. Given the equal depths of the red and blue doublet components, it is clear that the O VI absorption in the core of Component 4 is completely saturated in the 2002 and 2003 epochs, and less so in the 1999 high flux state. If as assumed here, the increase in absorption depth of the saturated core between 2002 and 2003 indicates the total effective covering fraction increased. This is a contradiction to our assumption here, i.e. unity covering fractions for all emission components for all epochs, confirming what we know from Figure 7, namely that and possibly also are not unity.
The O VI absorption is saturated in Component 2 in all three epochs. For , the top panel of Figure 8 shows that the absorption depth is largest in 2003 and smallest in 2002. This is true of Component 4 as well. These are the epochs of the smallest and largest ILR/BLR flux, respectively, indicating that the profile change is caused by the change in this emission line ratio, contributing to a change in the total effective covering fraction.
3.1.2 N V
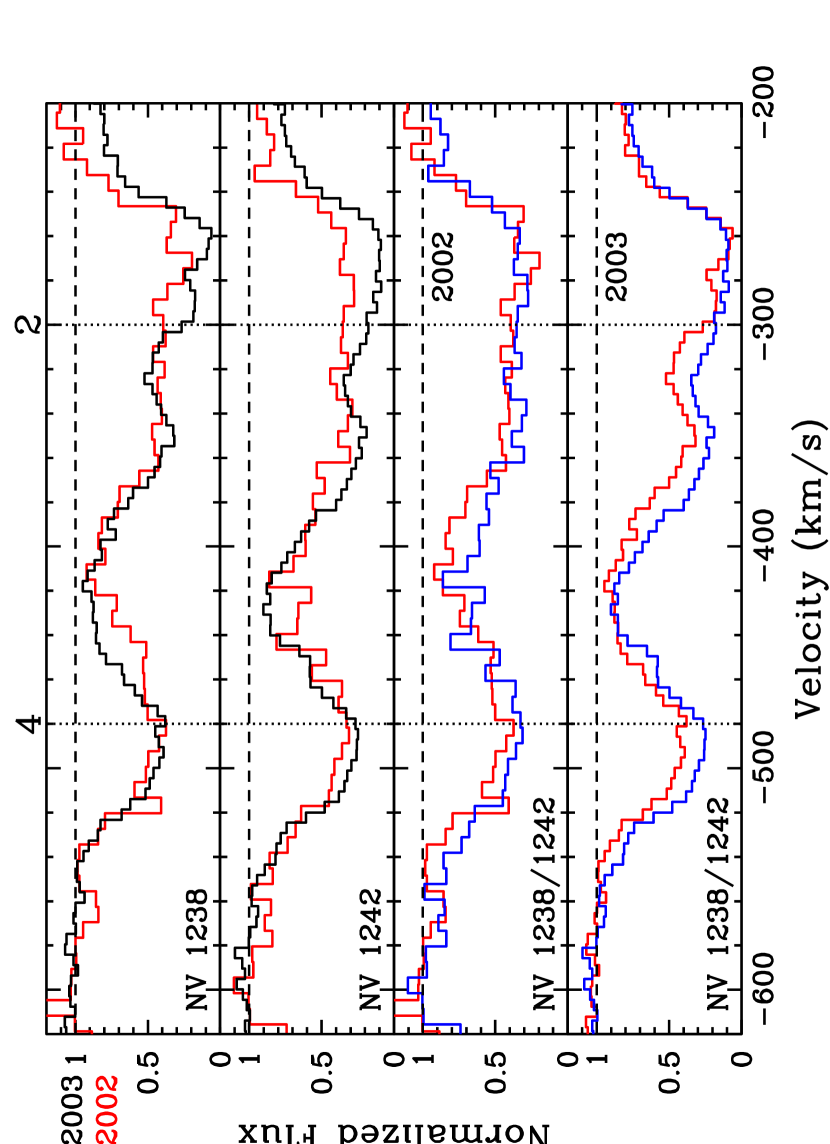
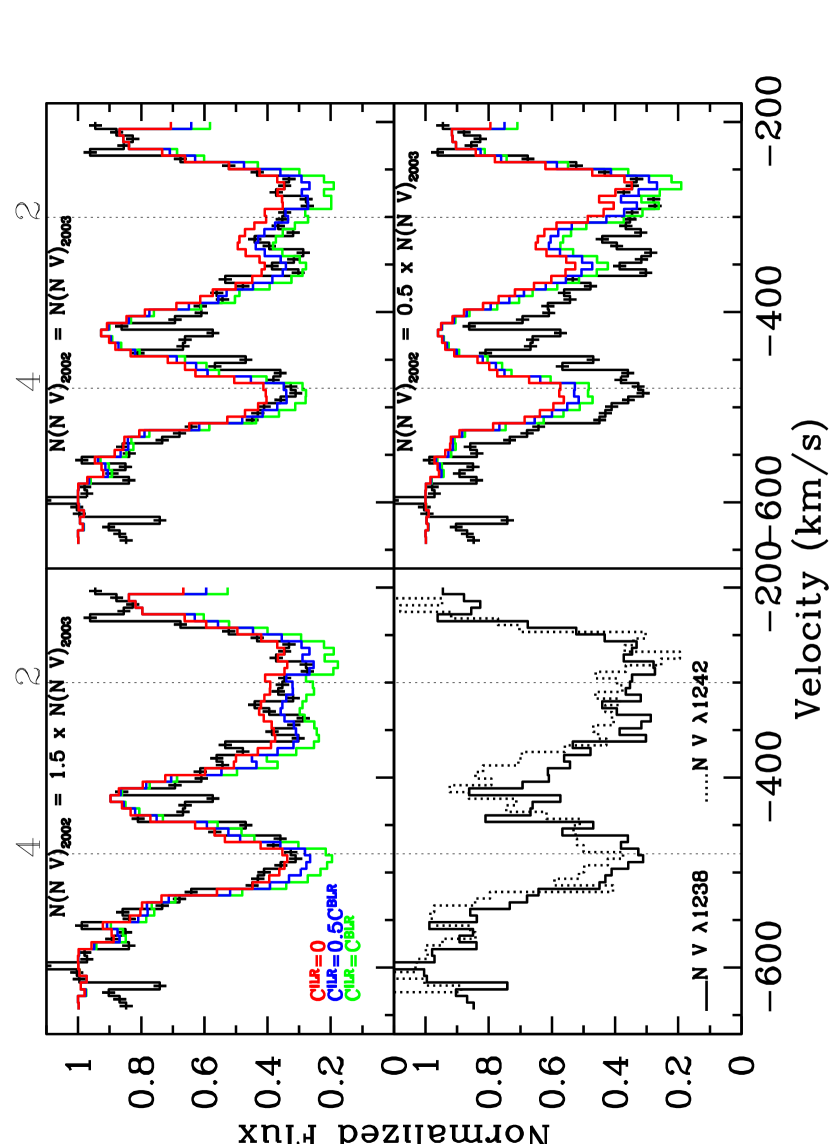
In Component 4, the entire N V profile is marginally saturated in 2002 and unsaturated in 2003. For , as shown in Figure 9, the absorption depth is similar but nonzero in both epochs. This indicates once again that the emission line covering fractions are nonunity, but also that the change in the effective line covering fraction between the two epochs is not as dramatic as for O VI.
For Component 2, the N V profile is saturated in 2002, but in 2003 it is saturated in the core and in the red wing of the profile, while the blue wing is unsaturated. The top panels of Figure 9 show the absorption depth in 2003 is greater than in 2002, particularly in the consistently saturated regions. This could be the result of the changing ILR/BLR flux ratio and the resulting variation in the effective line covering fraction, as described above for the O VI profile.
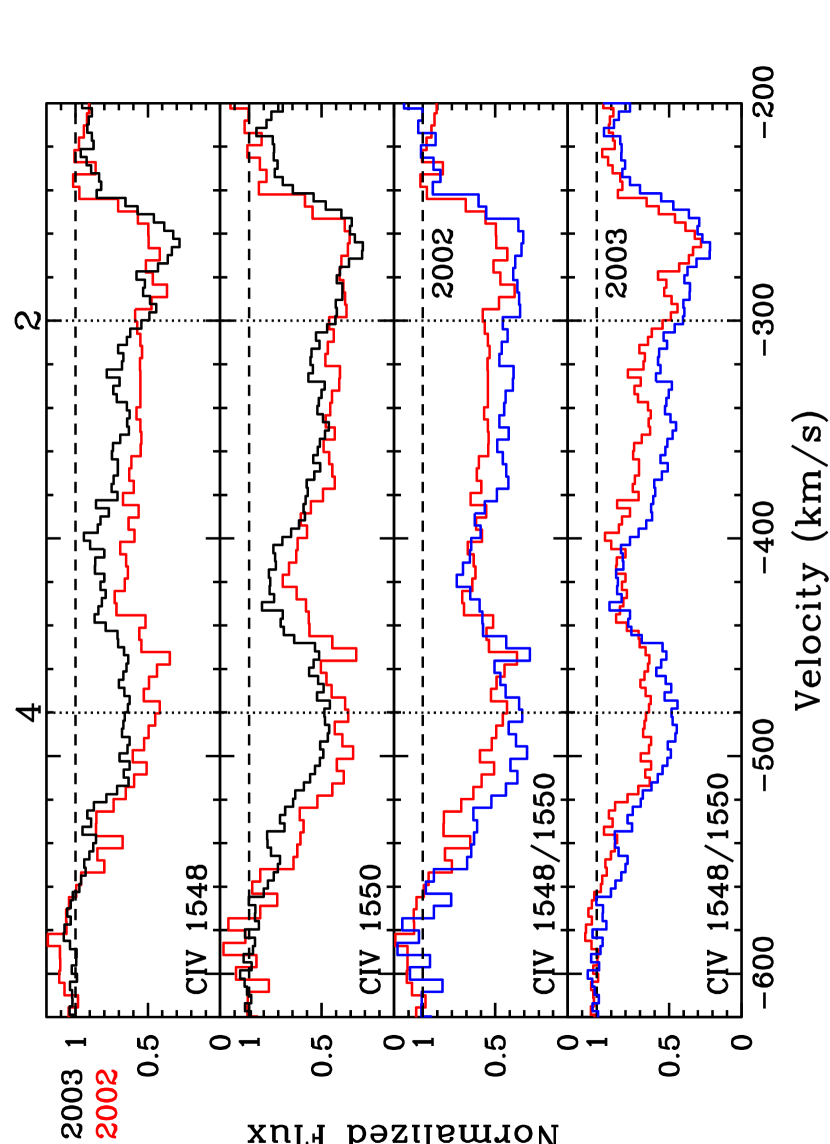
3.1.3 C IV
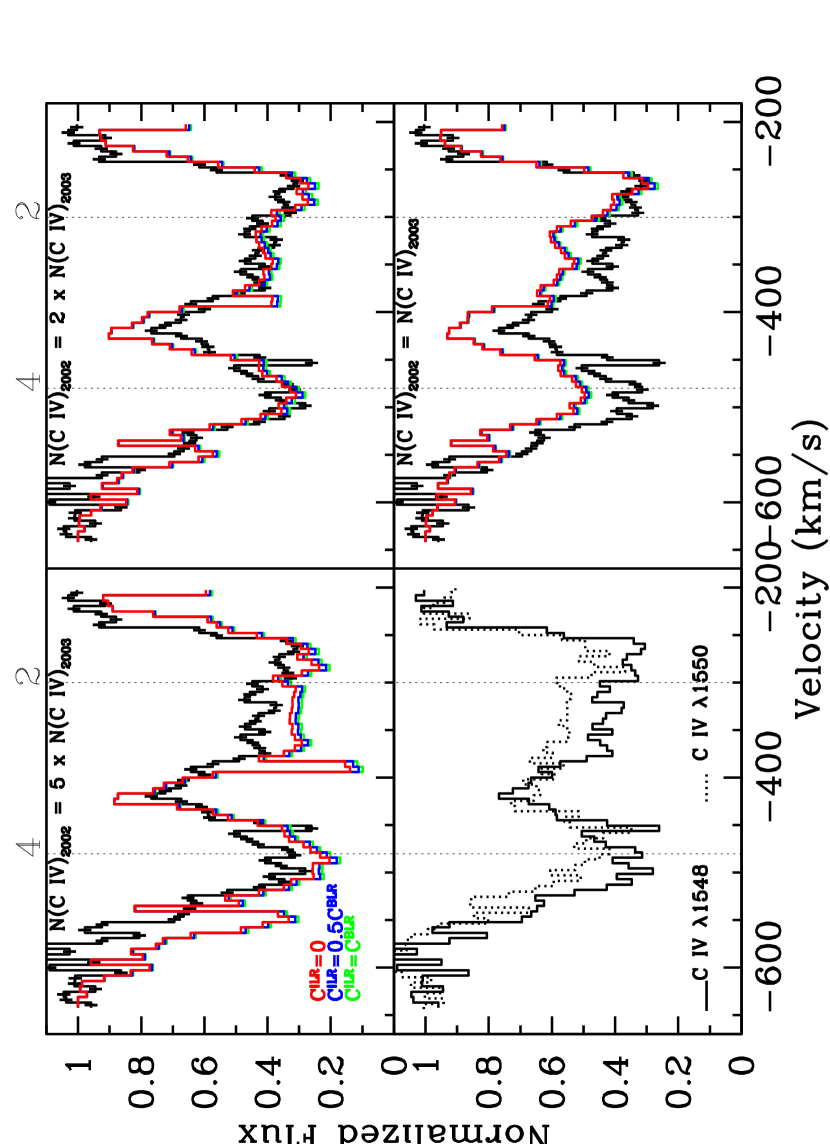
In 2002, Component 4 of the C IV profile is possibly saturated in the red wing and unsaturated elsewhere, while in 2003 it is unsaturated over most of the profile. The absoprtion depth decreases from 2002 to 2003, indicating that the C IV column density decreased as the continuum flux increased by a factor of between 2002 and 2003. The profile depth change between 2002 and 2003 is less than expected for a simple column density response to this flux increase, leading to the conclusion that the total effective covering fraction decreased over this time. Although there is only a small change in the ILR/BLR emission flux ratio (Fig. 6) the continuum level relative to the emission lines rises significantly between 2002 and 2003. The effective covering fraction thus rises since .
In Component 2, the C IV profile is unsaturated in both 2002 and 2003, and the absorption depth is unchanged between these two epochs, most likely also due to ionization changes balancing an increase in the effective covering fraction.
3.1.4 Lyman series
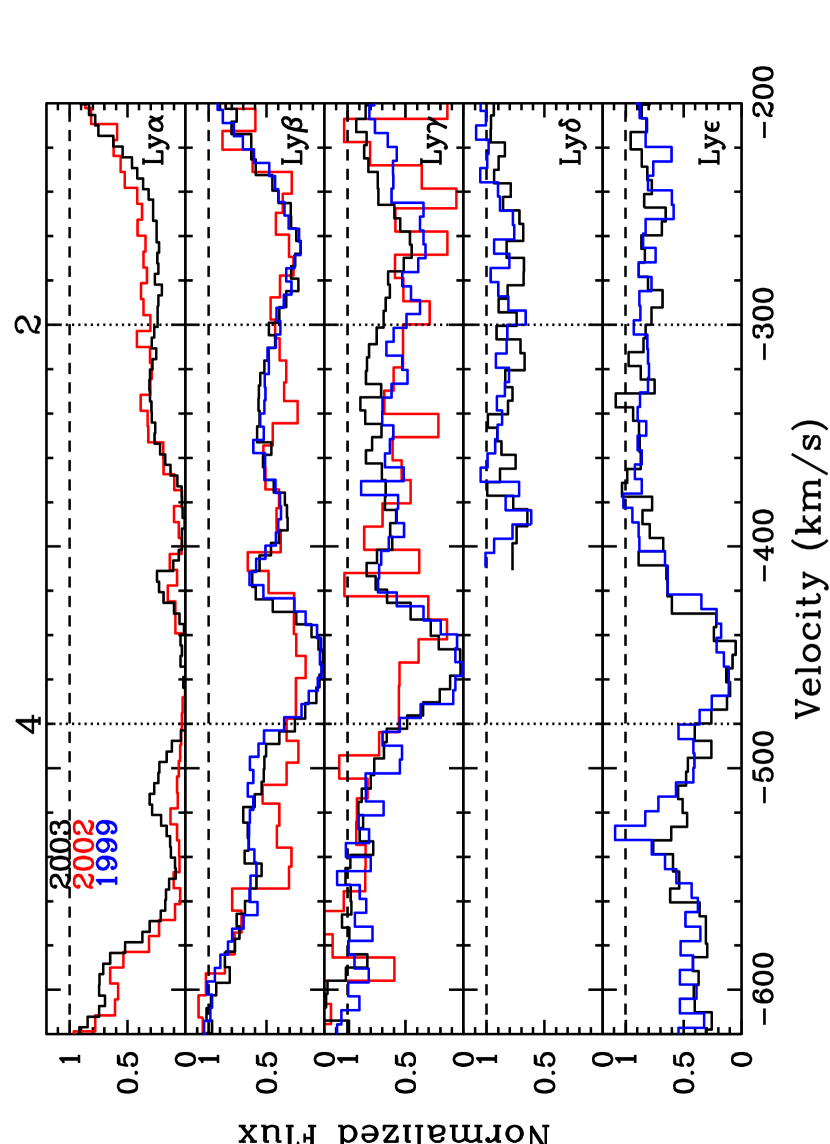
For H I, the only part of the absorption complex that can be reliably attributed to intrinsic gas is Component 2 ( km s-1). In this velocity component, the Ly absorption depth is noticeably weaker in 2002 than in 2003. As pointed out by G05, this is explained by a lower effective covering fraction in 2002 due to a larger relative contribution by the BLR relative to the continuum and the fact that while . For our assumption , shown in Figure 11, we see this reported change in the Ly profile, and little change in the Ly profile, which we would expect to be more influenced by the changes in the O VI emission components.
For other lines further along the Lyman series from Ly, there is little or no underlying emission line flux beneath these profiles. Examining Ly, a Lyman series line unlikely to be affected by saturation, we find no discernable difference in the profiles from 1999 to 2002, but the profile does appear less deep in 2003. However there is no difference in Ly or Ly between the two high flux states, 1999 and 2003.
4 Photoionization
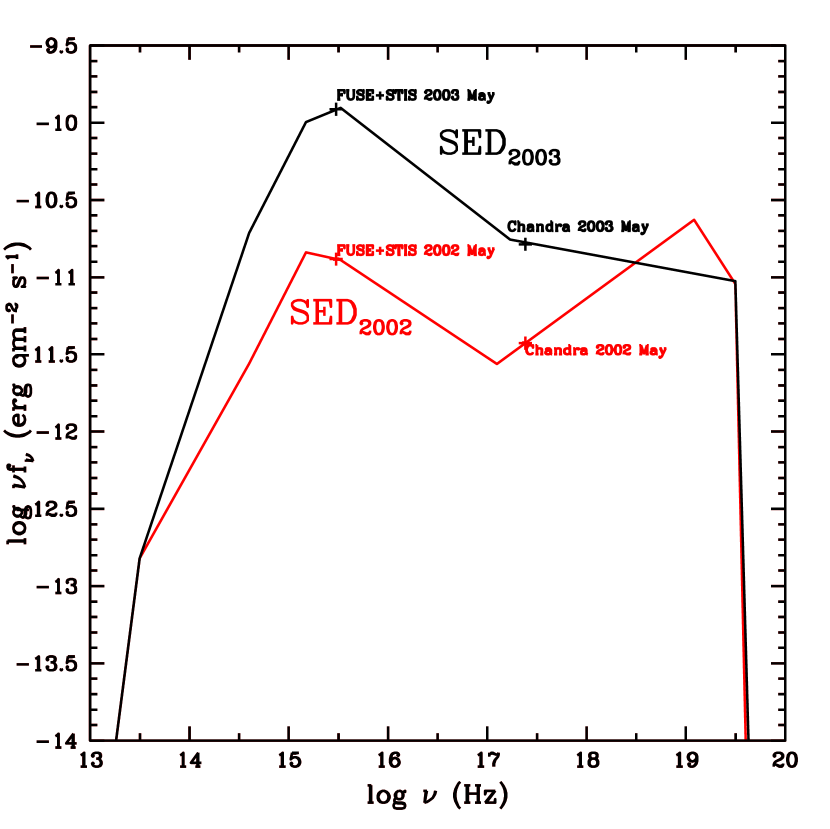
To investigate a wider range of possiblities for the various emission source covering fractions, and to disentangle the effects of photoionization from those of covering fraction and emission source variation on the various species considered above, we computed photoionzation models similar to those of Krolik & Kriss (1995, 2001) using the XSTAR code (Kallman 2000). We calculate the photoionization state of the gas using the supersolar abundance found by Arav et al. (2007) spectral energy distributions (SEDs) appropriate to the 2002 and 2003 FUSE and Chandra observations shown in Figure 12. Both SEDs are normalized to the measured FUSE and Chandra spectra over the spectral range of these instruments. The parameters of the FUSE spectra are discussed in Section 2. We connect the 2002 FUSE and Chandra measurements with ; and we approximate the 2002 Chandra double power law spectrum (S04) with a single power law with from 0.5 to 50 keV and we extend the SED to 150 keV with . We approximate the 2003 Chandra power law + modified blackbody continuum (Costantini et al. 2007) with a smooth power law: connecting the FUSE and Chandra data to 0.7 keV and to 150 keV (Costantini et al. 2007, Arav et al. 2007). For energies lower than the STIS bandpass and higher than the Chandra bandpass, we use cut-offs for a standard AGN spectrum (cf. Costantini et al. 2007). We executed the model with grids in input column density and ionization parameter from to and from to , respectively.
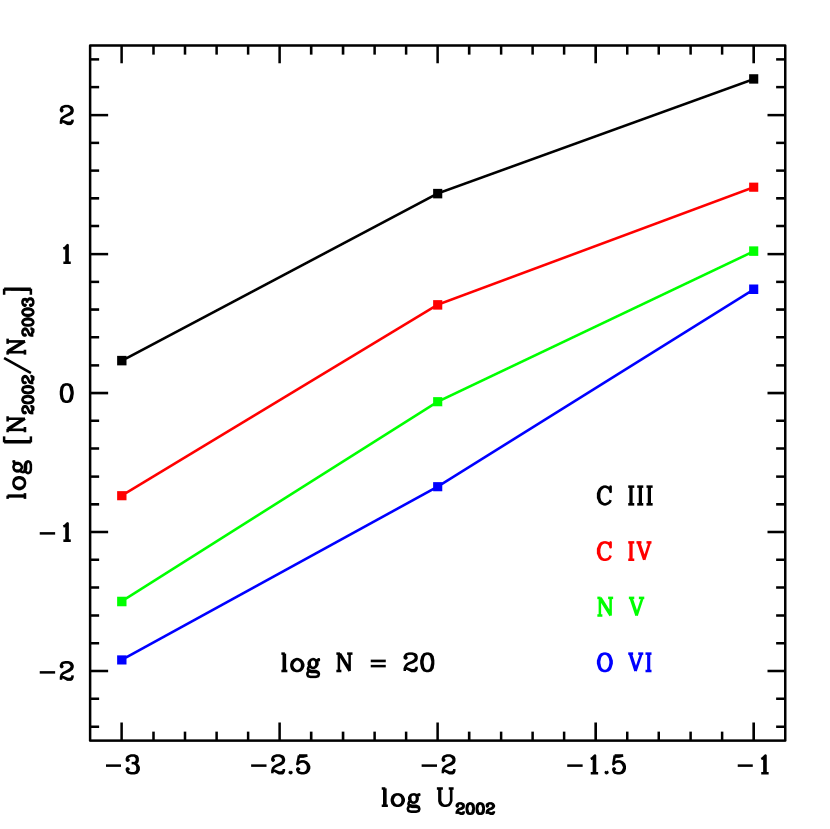
In Figure 13, we show results from the run. We plot the ratio of the column densities of C III, C IV, N V, and O VI in the XSTAR simulations using SED2002 to the values from the XSTAR simulations using SED2003 as a function of the ionization parameter in the SED2002 simulations. To take this ratio, we compare the column densities in each simulation at equivalent ionization parameters given the different SEDs. The number of ionizing photons supplied by SED2002 is about one-tenth the number supplied by SED2003. Therefore, we take the ratio of the column densities of each ion at and . These are plotted against in Figure 13.
5 Effective Covering Fraction versus Photoionization
We now seek to establish whether the changes in the absorption profiles of the highly ionized species C IV, N V, and O VI between the 2002 and 2003 epochs can be explained by partial covering of some portion of the line emission combined with changes in the relative contributions of the component broad and intermediate line fluxes to the total emission profile, or if some change in the column density in response to changes in the continuum flux is required by the data. To address this, we use the well-constrained 2003 covering fractions and column densities derived by G05 and attempt to reproduce the 2002 absorption profiles in two ways: (1) by allowing the covering fraction of the ILR to be different from that of the BLR; and (2) by varying the column densities according to changes in the ionizing flux as predicted by our photoionization models. From Figure 13, we see how we expect the column densities of each ion to change under photoionization alone.
From the emission line fits, we consider three emission sources, the continuum, the BLR, and the ILR. Thus, Equation 1 becomes
| (3) |
We assume , consistent with G05. For doublets, however, the resulting system of equations is still underconstrained. Therefore, we assume three possibilities for : (1) ; (2) ; and (3) .
The overall goal of this experiment is to reproduce the 2002 spectrum from the column densities derived from the higher quality 2003 data. We attempt to do this by varying both the changes in the ionic column densities using our photoionization modeling as a guide, and by varying the covering fractions of the intermediate line region using the three cases above. Here is a summary of our method:
-
•
We begin with the well-constrained solutions for the the emission line covering fractions from the 2003 data presented by G05. In that solution, the line covering fractions of C IV, N V, and O VI were tied to the same value, 0.64 and 0.76 for the centers of Components 2 and 4, respectively.
-
•
We use the new emission line fits to the 2003 data presented in Section 2, including intermediate line components, to derive and from the values of and at each velocity bin, from the total line covering fraction given by G05. Note that in doing this, we are formally calculating different covering fractions for C IV, N V, and O VI because the emission line flux underlying each set of doublets is different. We will return to this point in the discussion in Section 6.
-
•
We apply these to the 2002 epoch given the values of and derived from that spectrum to examine how the profiles may have changed from changes in these ratios alone.
-
•
We also examine how the profiles change if the column densities of the various ions have changed as well, by reasonable factors gleaned from our photoionization modeling as shown in Figure 13.
-
•
We center the x-axis of Figure 13 and concentrate our attention on the case (and ) since this is the result of the detailed photoionization modeling and abundance analysis of Arav et al. (2007).
6 Discussion
The results for O VI, N V, and C IV are shown in Figures 14-16. In each lower left panel, we show the blue and red components of the doublet profiles from the 2002 data. In the other three quadrants, we show the blue component of the 2002 profile in black. Superimposed on this are the attempts to reproduce this profile from the parameter constraints from the high signal-to-noise 2003 data described above, under variations in both the column densities and the covering fractions. The column density changes from 2002 to 2003 increase clockwise from top left to bottom right, with one panel for each ion showing how the profiles would change if no change in the ion column density occured between 2002 and 2003.
Figure 14 shows that because the O VI profile is saturated, the column density is unconstrained. For Component 2, regardless of the column density the only value of consistent with the profile is zero, while for Component 4, . The photoionization model predicts an increase of about a factor of four in the O VI column density from 2002 to 2003, given the change in the continuum level over that period.
For N V, shown in Figure 15, the best fit solution for both Components 2 and 4 is a column density decrease of 30% from 2002 to 2003 and , although also provides an acceptable fit for Component 4. Our pure photoionization model would predict a decrease of about one half that amount in the N V column density between 2002 and 2003.
For C IV, Figure 16 shows that a decrease in the column density from 2002 to 2003 is required to match the profiles in both components, regardless of the value of . A change in the column density by larger than a factor of 2, however, is not consistent with the observed absorption depths. Our photoionization modeling indicates that we would expect a larger decrease in the C IV column density from photoionization alone, a factor of nearly six. This covering fraction is relatively poorly constrained because the relative contributions of the BLR and ILR change very little between the 2002 and 2003 epochs, as noted above. Of our models, the best fits to the 2002 spectrum come from (C IV)2002=(C IV)2003 and for Component 2 and for Component 4. This ILR covering fraction solution for Component 4, however, is not significantly different from .
In the formal solution for these covering fractions we assumed that the effective line covering fractions for O VI, N V, and C IV are all the same in the 2003 epoch but that the resulting individual BLR and ILR covering fractions are not necessarily equal, and that those individual BLR and ILR covering fractions did not change between 2002 and 2003. However, from the success of the G05 global CNO covering fraction fits, the covering fractions for each of these highly ionized species are likely to be comparable. Thus, we summarize the results detailed above in this context and find that (1) the BLR covering fraction of C IV, N V, and O VI in the cores of Components 2 and 4 are 0.8-0.9; (2) the ILR covering fractions are zero for Component 2 and 0.4 for Component 4; and (3) the column density in O VI decreased by an indetermiate factor while the column density in N V decreased by one third, and that of C IV decreased by a factor of 2 between the two epochs. Should we choose to constrain the individual broad and intermediate emission line covering fractions of C IV, N V, and O VI to be equal (like G05, but unlike S04), we could use this set of three doublets to solve for six variables, the continuum, broad line, and emission line covering fractions and the column densities of O VI, N V, and C IV as a function of velocity across the absorption profiles. We leave this for future work.
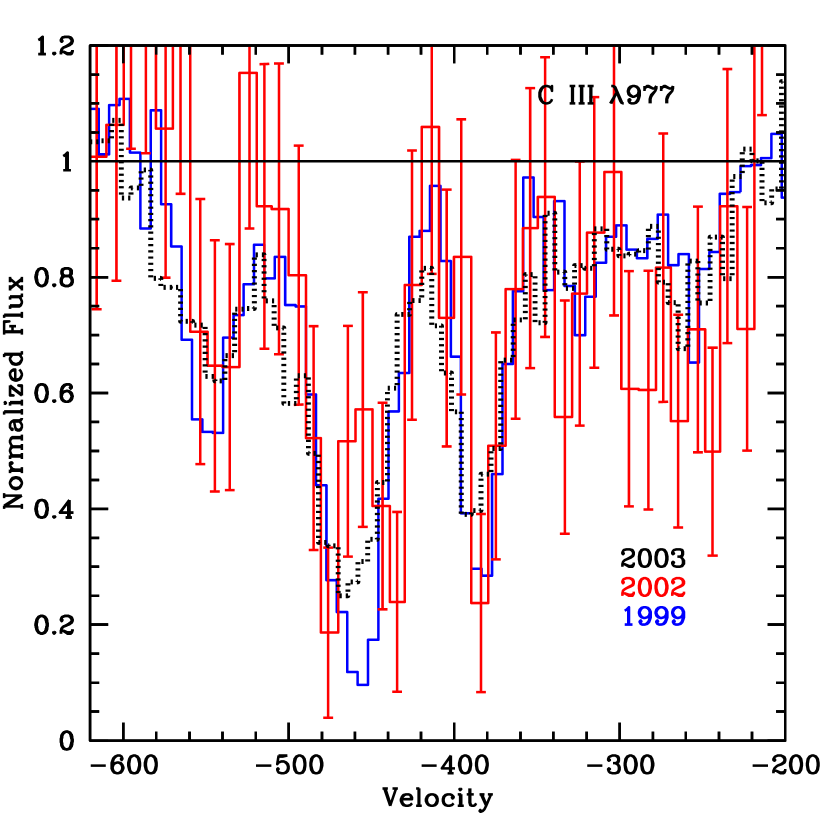
The C III profile presents somewhat of a puzzle in light of the results we have outlined thusfar. We expect the column density of this species to be quite sensitive to the factor of 8 increase in the ionizing flux between the 2002 and 2003 observations. Figure 13 shows that for , the C III column density should decrease by a factor of about 25-30 from 2002 to 2003. In Figure 17, we demonstrate that we see no significant change in the C III profile in either Component 4 or in Component 2.
One way to resolve this problem is to invoke a long photoionization response time for the gas. To test this possibility, we follow an equilibrium photoionization model of the gas over time. We began with a model that matches the well-constrained 2003 column densities and dropped the photoionizing flux by a factor of 8 to evolve the absorber back in time to the 2002 epoch. Following the trend of ionic abundances, we find that the C III column density should decrease by a factor of two in about one hour for cm-3, in about one day for cm-3 and in about one year for cm-3. Therefore, for a very small change in the C III column density, a small total density is required if the absorbing gas is in equilibrium. This density, along with and the luminosity of Mrk 279, require that the gas lie at 2 kpc from the ionizing source if it is part of the Mrk 279 outflow. This would certainly present us with a conundrum given the nonunity covering fractions we have consistently found for the emission lines in absorption Components 2 and 4.
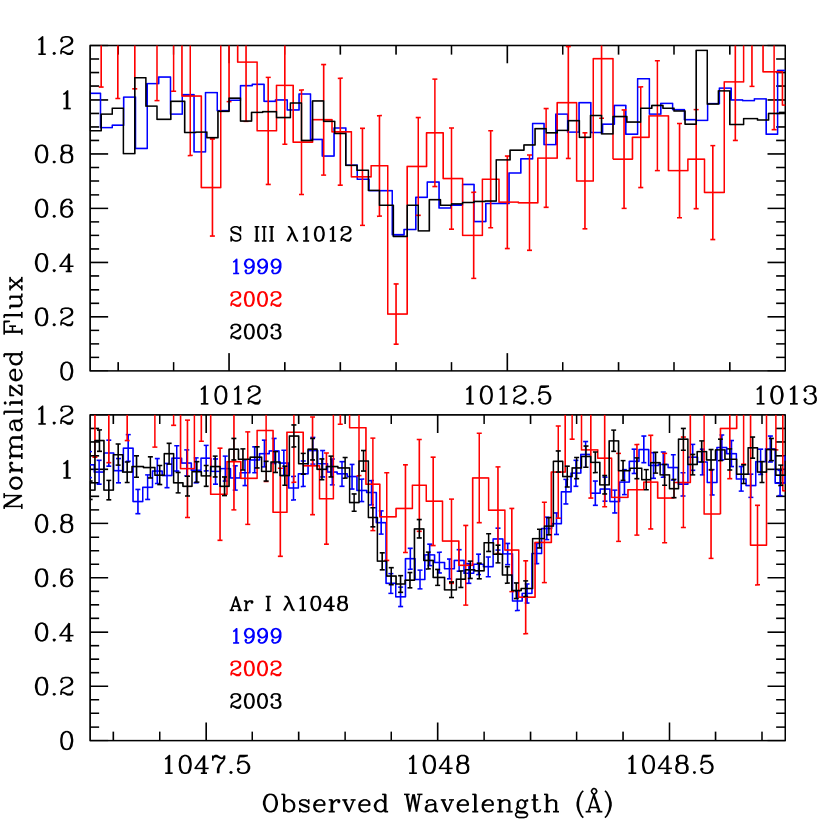
The stable C III profiles are not likely solely the result of problems with the normalization of the spectra. We confirm this by comparing the profiles of two nearby ISM lines in the three FUSE epochs. In Figure 18 we show two prominent but unsaturated ISM lines, S III 1012 and Ar I 1048, in all three FUSE observation epochs. We do see some normalization problems, particularly in the Ar I region, likely attributable mainly to the low S/N in the 2002 data. The absorption depth in the 2002 Ar I profile is higher than in the other epochs when it is not expected to vary at all. This may be a contributor to the apparent lack of variability in the C III profiles. We note, however, that the deepest absorption in the C III profile peaks at -540 km s-1, -460 km s-1, and at -385 km s-1. As discussed by S04, the low ionization absorption at these velocities may not be part of the Mrk 279 outflow but may in fact be attributable to either the host galaxy of the AGN or to a companion galaxy, MCG +12-13-024.
Photoionization models of quasar line emission indicate that intermediate line region lies at approximately 1 pc from the central ionizing source, a factor of 10 further than than the broad line region (Brotherton et al. 1994). However, the UV and X-ray observations of the Seyfert galaxy NGC 4151 place the D+E subcomponents of its outflow absorption in an accretion disk wind which is the ILR and which lies at only 0.1 pc from the continuum source (Kraemer et al. 2006, Crenshaw & Kraemer 2007, see also Corbin 1997). For Mrk 279, we have found ILR covering fractions that are consistently smaller than those of the BLR and continuum, and in some cases . This would place the absorbing gas within or interior to the ILR. Assuming that the width of the intermediate lines, 2900 km s-1, is produced gravitationally, a black hole mass of M☉ (Peterson et al. 2004) gives a radius of 0.02 pc for the ILR, an estimate that is only slightly larger than measured constraints on the size of the BLR, 0.01 pc (Maoz et al. 1990). We note, however, that this estimate of the ILR size is influenced by the relatively broad ILR emission features, certainly as compared with NGC 4151.
7 Summary
We find that some of the variability, or lack thereof, in the absorption profiles of the various species present in the FUSE and STIS data for Mrk 279 can be understood in terms of changes in the effective covering fraction when all emission components are included in the absorption model. Accounting for individual covering fractions in the continuum, broad lines, and intermediate velocity width lines, we find less dramatic changes in the column densities of the highly ionized species are required by the absorption data than those that are predicted by photoionization modeling alone. In particular, the contribution of the covering fraction of the intermediate velocity width emission lines to the overall effective covering fraction for a given ion and the changes in the relative contribution of this component to the overall emission between the two epochs can account for a significant portion of the changes observed in the absorption profiles.
If the C III absorption is intrinsic to the outflow, the UV continuum flux variation between 2002 and 2003 is not commensurate with an absorber of very high ionization parameter or of very large density, placing this absorbing structure at a substantial distance from the ionizing source. We consider this unlikely, however, given the nonunity broad and intermediate emission line covering fractions derived for the intrinsic absorption.
References
- Adelberger, Steidel, Shapley, & Pettini (2003) Adelberger, K. L., Steidel, C. C., Shapley, A. E., & Pettini, M. 2003, ApJ, 584, 45
- (2) Arav, N., Kaastra, J., Kriss, G. A., Korista, K. T., Gabel, J., & Proga, D. 2005, ApJ, 620, 665
- Arav et al. (2007) Arav, N., et al. 2007, ApJ, 658, 829
- Blandford & Begelman (1999) Blandford, R. D., & Begelman, M. C. 1999, MNRAS, 303, L1
- Blandford & Begelman (2004) Blandford, R. D., & Begelman, M. C. 2004, MNRAS, 349, 68
- Brotherton et al. (1994) Brotherton, M. S., Wills, B. J., Francis, P. J., & Steidel, C. C. 1994, ApJ, 430, 495
- (7) Cardelli, J. A., Clayton, G. C., & Mathis, J. S. 1989, ApJ, 345, 245
- Cavaliere, Lapi, & Menci (2002) Cavaliere, A., Lapi, A., & Menci, N. 2002, ApJ, 581, L1
- Corbin (1997) Corbin, M. R. 1997, ApJS, 113, 245
- Costantini et al. (2007) Costantini, E., et al. 2007, A&A, 461, 121
- (11) Crenshaw, D. M. & Kraemer, S. B. 1999, ApJ, 521, 572
- Crenshaw & Kraemer (2007) Crenshaw, D. M., & Kraemer, S. B. 2007, ApJ, 659, 250
- Crenshaw et al. (1999) Crenshaw, D. M., Kraemer, S. B., Boggess, A., Maran, S. P., Mushotzky, R. F., & Wu, C. 1999, ApJ, 516, 750
- Crenshaw, Kraemer, & George (2003) Crenshaw, D. M., Kraemer, S. B., & George, I. M. 2003, ARA&A, 41, 117
- Crenshaw et al. (2000) Crenshaw, D. M., Kraemer, S. B., Hutchings, J. B., Danks, A. C., Gull, T. R., Kaiser, M. E., Nelson, C. H., & Weistrop, D. 2000, ApJ, 545, L27
- dl (90) Dickey, J. M. & Lockman F. J. 1990, ARA&A, 28, 215
- Dunn et al. (2007) Dunn, J. P., Crenshaw, D. M., Kraemer, S. B., & Gabel, J. R. 2007, AJ, 134, 1061
- (18) Gabel, J. R. et al. 2005a, ApJ, 623, 85 (G05)
- (19) Gabel, J. R. et al. 2005b, ApJ, 631, 741
- (20) Gabel, J. R. et al. 2003a, ApJ, 595, 120
- (21) Gabel, J. R. et al. 2003b, ApJ, 583, 178
- G (98) George, I. M., Turner, T. J., Netzer, H., Nandra, K., Mushotzky, R. F., & Yaqoob, T. 1998, ApJS, 114, 73
- Granato et al. (2004) Granato, G. L., De Zotti, G., Silva, L., Bressan, A., & Danese, L. 2004, ApJ, 600, 580
- Kaastra et al. (2004) Kaastra, J. S., et al. 2004, A&A, 428, 57
- Kallman (2000) Kallman, T. R. 2000, XSTAR User’s Guide (Greenbelt: NASA GSFC)
- K (01) Kaspi, S., et al. 2001, ApJ, 554, 216
- K (02) Kaspi, S., et al. 2002, ApJ, 574, 643
- KK (94) Königl, A. K. & Kartje, J. F. 1994, ApJ, 434, 446
- (29) Kraemer, S. B. et al. 2001, ApJ, 551, 671
- Kraemer et al. (2005) Kraemer, S. B., et al. 2005, ApJ, 633, 693
- Kraemer et al. (2006) Kraemer, S. B., et al. 2006, ApJS, 167, 161
- (32) Kraemer, S. B., Crenshaw, D. M., George, I. M., Netzer, H., Turner, T. J., & Gabel, J. R. 2002, ApJ, 577, 98
- (33) Krolik, J. H. & Kriss, G. A. 1995, ApJ, 447, 512
- (34) Krolik, J. H. & Kriss, G. A. 2001, ApJ, 561, 684
- Maoz et al. (1990) Maoz, D., et al. 1990, ApJ, 351, 75
- Moll et al. (2007) Moll, R., et al. 2007, A&A, 463, 513
- (37) Murray, N., Chiang, J., Grossman, S. A., & Voit, G. M. 1995, ApJ, 451, 498
- Netzer et al. (2003) Netzer, H., et al. 2003, ApJ, 599, 933
- Peterson et al. (2004) Peterson, B. M., et al. 2004, ApJ, 613, 682
- Proga (2000) Proga, D. 2000, ApJ, 538, 684
- Proga (2003) Proga, D. 2003, ApJ, 585, 406
- Proga & Kallman (2004) Proga, D., & Kallman, T. R. 2004, ApJ, 616, 688
- Proga et al. (2000) Proga, D., Stone, J. M., & Kallman, T. R. 2000, ApJ, 543, 686
- Scannapieco & Oh (2004) Scannapieco, E. & Oh, S. P. 2004, ApJ, 608, 62
- Scannapieco et al. (2005) Scannapieco, E., Silk, J., & Bouwens, R. 2005, ApJ, 635, L13
- Scott et al. (2004) Scott, J. E., et al. 2004, ApJS, 152, 1 (S04)
- Scott et al. (2005) Scott, J. E., et al. 2005, ApJ, 634, 193
- (48) Shields, J. C. & Hamann, F. 1997, ApJ, 481, 752
| Instrument | ID | Start Date | Exp. (s) |
|---|---|---|---|
| FUSE | P1080303 | 1999-12-28 | 61139 |
| FUSE | C0900201 | 2002-05-18 | 47414 |
| FUSE | D1540101 | 2003-05-12 | 91040 |
| STIS/E140M | O6JM01 | 2002-05-18 | 13193 |
| STIS/E140M | O8K10 | 2003-05-13 | 41386 |
| Line | Flux11Flux in units of 10-14 ergs cm-2 s-1 | Velocity22Velocity relative to systemic redshift, | FWHM | |
|---|---|---|---|---|
| (Å) | (km s-1) | (km s-1) | ||
| S VI | 933.378 | 4.091.64 | 6831782 | 7569192 |
| S VI | 944.523 | 2.040.82 | 6831782 | 7569192 |
| C III | 977.020 | 33.552.82 | 384458 | 9206146 |
| N III | 989.799 | 8.062.52 | 4171066 | 9206146 |
| Ly broad | 1025.7223 | 31.522.47 | -797 | 873161 |
| Ly int. | 1025.7223 | 5.770.67 | -46911 | 320822 |
| Ly narrow33FWHM fixed to 2002 May value | 1025.7223 | 0.560.33 | 14522 | 697 |
| O VI broad | 1031.9265 | 71.662.58 | 47525 | 7569192 |
| O VI int. | 1031.9265 | 10.291.25 | -193100 | 278397 |
| O VI broad | 1037.6155 | 35.831.29 | 47525 | 7569192 |
| O VI int. | 1037.6155 | 5.140.62 | -193100 | 278397 |
| S IV int. | 1062.66 | 11.120.31 | -416132 | 3274560 |
| S IV int. | 1072.97 | 11.120.31 | -416132 | 3274560 |
| He II | 1085.15 | 28.520.79 | -213101 | 7569192 |
| Si II | 1192.3 | 3.570.79 | 446200 | 9385269 |
| Ly broad | 1215.6701 | 307.692.38 | -797 | 873161 |
| Ly int. | 1215.6701 | 120.230.52 | -46911 | 320822 |
| Ly narrrow33FWHM fixed to 2002 May value | 1215.6701 | 7.090.48 | 14522 | 697 |
| N V broad | 1240.40 | 106.662.80 | -5653 | 990819 |
| N V int. | 1240.40 | 5.840.89 | -15215 | 295672 |
| Si II | 1260.42 | 5.320.61 | 446200 | 9385269 |
| Si II+O I | 1304.35 | 9.820.89 | -69140 | 4020732 |
| C II | 1335.30 | 1.680.59 | -219352 | 2422207 |
| Si IV | 1393.76 | 24.770.30 | -4246 | 990819 |
| Si IV | 1402.77 | 12.380.15 | -4246 | 990819 |
| O IV] | 1402.06 | 21.930.17 | -60067 | 377447 |
| C IV broad | 1549.05 | 30.210.79 | 419 | 990819 |
| C IV int. | 1549.05 | 8.871.21 | -30412 | 295672 |
| He II | 1640.5 | 80.963.30 | -11122 | 990919 |