Super-resolution without Evanescent Waves
Abstract
The last decade has seen numerous efforts to achieve imaging resolution beyond that of the Abbe-Rayleigh diffraction limit. The main direction of research aiming to break this limit seeks to exploit the evanescent components containing fine detail of the electromagnetic field distribution at the immediate proximity of the object. Here we propose a solution that removes the need for evanescent fields. The object being imaged or stimulated with sub-wavelength accuracy does not need to be in the immediate proximity of the superlens or field concentrator: an optical mask can be designed that creates constructive interference of waves known as superoscillation, leading to a sub-wavelength focus of prescribed size and shape in a ‘field of view’ beyond the evanescent fields, when illuminated by a monochromatic wave. Moreover, we demonstrate that such a mask may be used not only as a focusing device, but also as a super-resolution imaging device.
The last decade has seen numerous efforts to achieve imaging resolution beyond that of the Abbe-Rayleigh diffraction limit, which proscribes the visualization of features smaller than about half of the wavelength of light with optical instruments. The main direction of research aiming to break this limit seeks to exploit the evanescent components containing fine detail of the electromagnetic field distribution. Indeed, many powerful concepts like scanning near-field optical microscopy (SNOM) 1 ; 2 , the use of various forms of field concentrators 3 ; 4 ; 5 ; 6 and superlenses 7 ; 8 ; 9 ; 10 ; 11 ; 12 ; 13 depend on the exploitation or recovery of evanescent fields. The proper far-field optical superlens 7 requires bulk negative index materials that are still to be developed, while other designs, though offering substantial advances, are united by a common severe limitation: that the object being imaged or stimulated must be in the immediate proximity of the superlens or field concentrator. Here we propose a solution that removes this limitation: an optical mask can be designed that creates constructive interference of waves known as superoscillation, leading to a sub-wavelength focus of prescribed size and shape in a ‘field of view’ beyond the evanescent fields, when illuminated by a monochromatic wave. Moreover, we demonstrate that such a mask may be used not only as a focusing device, but also as a super-resolution imaging device.
In fact, in his seminal 1952 paper Toraldo Di Francia demonstrated that propagating waves can create sub-wavelength localization of light in the far-field with the suggestion of a pupil design providing an accurately tailored sub-wavelength diffraction spot using a series of concentric apertures 14 . Such a sub-wavelength concentrator could be employed as a focusing device in a super-resolution scanning optical microscope where the object is placed several wavelengths away from the device, thus removing the main limitation of near-field instruments. More recently, Berry and Popescu 15 , starting from earlier works on quantum mechanics, showed that diffraction on a grating structure could create sub-wavelength localizations of light that propagate further into the far field than more familiar evanescent waves. They relate this effect to the fact that band-limited functions are able to oscillate arbitrarily faster than the highest Fourier components they contain, a phenomenon now known as superoscillation 16 ; 17 ; 18 . Examples of sub-wavelength localizations of light generated by a nano-hole array 19 ; 20 and a thin meta-dielectric shell 21 have been demonstrated recently. Research on beating the diffraction limit actually has an even longer history: in 1922, Oseen, with reference to Einstein’s radiation ‘needle stick’, proved that a substantial fraction of the emitted electromagnetic energy can be sent into an arbitrarily small solid angle 22 . Beginning from the pioneering work of Shelkunoff 23 , the microwave community contemplated the idea of achieving antennae that beat the diffraction limit for directivity: several authors were able to prove that for a linear array of properly adjusted radiating antenna dipoles, there were no theoretical limits to directivity whatsoever 24 ; 25 . However, the sharp increase in the proportion of reactive to radiated power that would be required to achieve super-directivity means that the antenna gain increase is offset by the need to provide an even higher increase in the power to the antenna to maintain the signal level, thus rendering the concept of super-directive antennae impractical. As we will see below, achieving a sub-wavelength localization of light in the far-field also comes at a price of losing most of the optical energy into diffuse sidebands. Nevertheless, optical microscopy applications can tolerate much higher losses than those acceptable in antenna design: scanning microscopes can work with only a few photons per second, giving one around 19 orders of magnitude of power reserve (assuming that a 1 W laser is used as the optical source).
In this letter we make a further step in the investigation of the potential of superoscillation for imaging and achieving sub-wavelength foci. We derive an algorithm for designing a mask that creates a sub-wavelength focus of prescribed size and shape within a prescribed ‘field of view’ when illuminated by a monochromatic wave. Moreover, we show that such a mask may be used not only as a focusing device, but also as a super-resolution imaging tool. We also study the role of manufacturing imperfections on the achievable super-resolution and suggest a design for a superoscillation plasmonic energy concentrator.
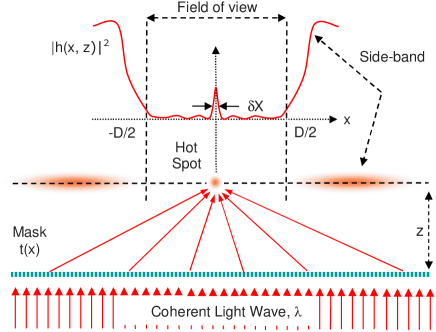
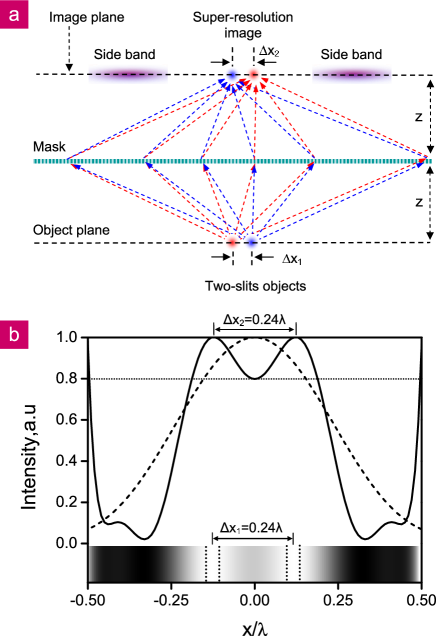
The typical situation that we address here is presented in Fig.1: we aim to design a mask which, within a limited area (field of view), will create a small hot-spot of light concentration (superoscillation) with a width located outside the evanescent zone, at a distance from the mask, where is the wavelength of light illuminating the mask. We argue that in principle a mask can be designed to create a hot-spot that is arbitrarily small, with an arbitrary profile, located at any given distance from the mask.
Our consideration is limited to a one-dimensional mask creating a one-dimensional sub-wavelength field distribution (superoscillation) when illuminated by plane wave at wavelength , although generalization to a two-dimensional case is trivial. The desired superoscillation feature located at a distance from the near-field zone of the mask can only be created by diffraction on the mask if the feature can be decomposed into a series of plane waves with wave-vector . Therefore, the main step in designing the mask is to present the desired superoscillating field as a series of bandwidth limited functions that can be decomposed into free-space plane waves of the given wavelength . We argue that any arbitrary small field feature can be presented as a series of band-limited functions if we are concerned with a prescribed ‘field of view’ . This may be achieved using the formulism of prolate spheroidal wave functions developed by Slepian and Pollark 26 to treat problems of information compression. This is a complete set of functions orthogonal in the interval and across the whole range . The main feature of prolate spheroidal wave functions is that they are band-limited to a frequency domain . Therefore the mask design algorithm comprises the following steps: initially the desired sub-wavelength hot-spot is presented as a series of prolate spheroidal wave functions, which can be truncated when a satisfactory level of approximation is achieved; at the second step this series of prolate spheroidal wave functions is presented as a series of plane waves and, using the scalar angular spectrum description of light propagating from the mask to the super-oscillating feature, the required complex mask transmission function can be readily derived. The formulism of the algorithm is presented in the Appendix.
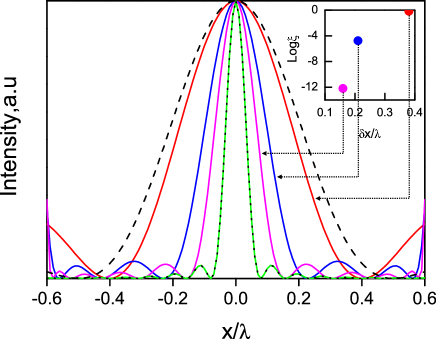
In what follows, we will give an explicit example of a mask designed to generate a sub-wavelength concentration of light. Let us aim for a single hot-spot field distribution centered in the ‘field of view’ . The full width at half maximum of the intensity profile of this distribution is measured as . From now on we will set , aiming therefore to achieve a hot spot in a field of view, far beyond the Abbe-Rayleigh limit. Fig. 2 shows the intensity profile of this distribution alongside a number of consecutive approximations to the distribution formed by limited series of prolate spheroidal wave functions, and a curve representing the Abbe-Rayleigh limit that would be achievable by a high-numerical aperture cylindrical lens. One can see that the series rapidly converges and that when the width of the approximation is practically the same as that of the target field distribution.
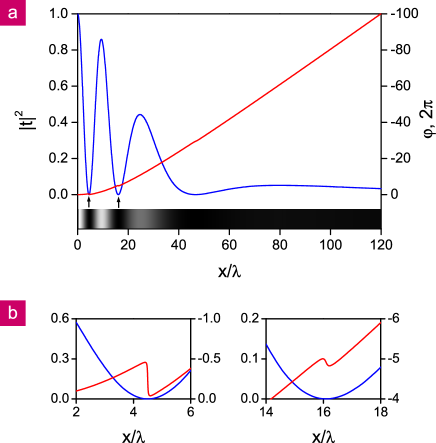
Fig.3 shows the intensity and phase profiles of the mask required to create the field profile corresponding to , which has = , at a distance from the grating. As the mask transmission function is even, only part of profile for is shown here. One can see that there is a small central area of the mask that transmits most of light. Beyond that area, there is a low-intensity broad shoulder of a slowly fading transmission characteristic. The phase profile of the mask resembles that of a concave lens where the optical thickness is at a minimum in the centre. The monotonous increase is only interrupted at a few positions where transmission amplitude is close to zero (indicated by arrows) and the phase shows a kink as illustrated in the zoomed sections .
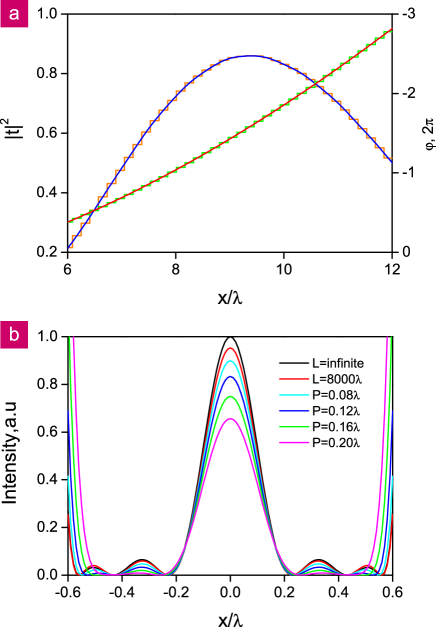
The superoscillation process is based on the precise and delicate interference of waves, so we investigated its stability with respect to the manufacturing tolerances to which masks can be fabricated and to the need to use masks of finite length (see the description of the practical device design below). We found that for the mask presented in Fig. 3 an long device may be used instead of an infinitely long mask without any substantial degradation of performance (= for both infinite and truncated masks with a 5% intensity decrease for the finite mask). A practical mask is likely to be manufactured by electron-beam lithography with a certain limited resolution, so we also investigated the dependence of superoscillation hot-spot size and intensity on the pixelation of the grating design: we replaced the smooth transmission function with a stepped functions in which the step width corresponded to the resolution of the manufacturing process (see Fig. 4a). Fig. 4b shows the variation of the intensity profile with increasing pixelation. The superoscillation process is remarkably stable against this manufacturing imperfection: with pixel size increasing to , the width of the hot-spot only increases by about 8%. Pixelation has a more substantial influence on the peak intensity, which is reduced by about 40% under such conditions.
To quantitatively characterize the optical energy contained in a superoscillating hot-spot, we define as the ratio between the energy contained in the hot-spot (between the first intensity minima either side of the central peak) and the total energy transmitted through the mask. In the inset to Fig.2 we show values of against the width of the peak for different levels of approximation . One can clearly see that the smaller the hot-spot is, the lower the proportion of energy that goes into it. For example, for only of the total transmitted energy will be focused into the hot-spot. The energy contained in the hot-spot is also significantly dependent on the field of view: if the required field of view is decreased by a factor of two from to , the proportion of energy going into the hot-spot at increases by nearly three orders of magnitude to . In fact, a more general consideration of the super-oscillating functions shows that the intensity in the hot-spot may only decrease polynomially with its width 17 . We therefore argue that when designing practical realizations of super-oscillating masks, less demanding requirements on the shape of hot-spots may yield much higher values of . In particular, one may achieve much higher values of for a given size of hot-spot by relaxing the requirements on the field structure of the hot-spot ‘pedestal’ (the background level within the field of view), for instance by stipulating only the maximum field intensity in the pedestal area relative to that of the hot-spot, but not the exact profile of the pedestal.
Recently it was shown that a hole array can be used as an imaging device 27 . Similarly, a super-oscillating mask can also be designed to image a sub-wavelength object. This is illustrated in Fig. 5 where we show a mask with a transmission function that converts an object located from the mask to an image on the opposite side of the mask, also at (see formula of the Appendix). Fig. 5(b) illustrates the imaging of two incoherent slit sources (each wide) separated by a distance of . Here the slits are clearly resolved according to the Rayleigh criterion 28 , which state that the total intensity at the saddle point of the sum intensity profile of two just-resolved slit sources is 81% of the maximum intensity.
Regarding practical implementations of the superoscillating mask, the above calculations demonstrate that manufacturing tolerance should be of the order of . Thus, manufacturing such a phase mask from a slab of dielectric material for microwave and THz frequency focusing should not be a very challenging problem. It can then be covered with an absorbing film of variable thickness to create the desired transmission profile. Fabricating such a mask for the IR and optical parts of the spectrum presents a more significant challenge and a fabrication accuracy of between and nm will be required. However, even such challenging phase masks may be created from glass with the diamond milling techniques used to produce aspheric lenses, while further fine-tuning with true nanoscale resolution may be achieved using focusing ion beam milling. Here the absorbing part of the mask could be a metal film of variable density prepared by UV or e-beam lithography.
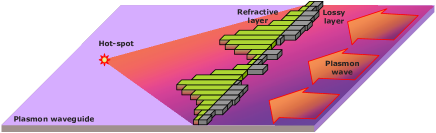
The idea of superoscillation could also be applied to the creation of a super-high-resolution plasmonic device. Surface plasmon-polaritons are collective oscillations of light and electrons that propagate along the interface between a metal (e.g. gold, silver) and a dielectric. They are essentially two-dimensional waves that can create complex field patterns by interference 29 ; 30 . As plasmon wavelengths are somewhat shorter than those of light at the same frequency, plasmonic devices promise better resolution than optical devices even within the conventional Abbe-Rayleigh diffraction limit. We argue that this may be enhanced even further through the use of superoscillation as the approach developed above may be easily applied to plasmons. A possible implementation of a plasmonic focusing device is presented in Fig. 6. Here, in order to create a desired intensity and phase profile of the mask we exploit the fact that the complex refractive index for plasmons depends on the dielectric properties of the medium forming an interface with the metal 31 : . By preparing a film of lossless dielectric on a metal surface with a prescribed profile, one can create the desired phase profile for the plasmon mask. Using an additional lossy profiled dielectric layer on the top of the first the necessary intensity profile can be engineered. Here the transmission function of the surface plasmon mask should be derived taking account of losses (see Appendix, formula A7).
In summary, we have shown that an optical mask can be designed that creates a a sub-wavelength focus in an area beyond the evanescent fields. Such a mask may also be used as a super-resolution imaging device with numerous applications for instance for imaging inside a leaving cell which is impossible with a near-field device.
Acknowledgements.
The authors would like to acknowledge the financial support of the Engineering and Physical Sciences Research Council, UK.References
- (1) Betzig, E., Trautman, J. K., Harris, T. D., Weiner, J. S. & Kostelak, R. L. Breaking the diffraction barrier - Optical microscopy on a nanometric scale. Science 251, 1468-1470 (1991).
- (2) Hartschuh, A., Sanchez, E. J., Xie, X. S. & Novotny, L. High-Resolution Near-Field Raman Microscopy of Single-Walled Carbon Nanotubes. Phys. Rev. Lett. 90, 095503(2003).
- (3) Li, K., Stockman, M. I. & Bergman, D. J. Self-similar chain of metalnanospheres as an efficient nanolens. Phys. Rev. Lett. 91, 227402 (2003).
- (4) Stockman, M. I. Nanofocusing of optical energy in tapered plasmonic waveguides. Phys. Rev. Lett. 93, 137404 (2004).
- (5) Merlin, R. Radiationless Electromagnetic Interference: Evanescent-Field Lenses and Perfect Focusing. Science 317, 927-929 (2007).
- (6) Grbic, A., Jiang, L. & Merlin, R. Near-field plates: subdiffraction focusing with patterned surfaces. Science 320, 511-513 (2008).
- (7) Pendry, J. B. Negative Refraction Makes a Perfect Lens. Phys. Rev. Lett. 85, 3966-3969 (2000).
- (8) Durant, S., Liu, Z., Steele, J. M. & Zhang, X. Theory of the transmission properties of an optical far-field superlens for imaging beyond the diffraction limit. J.Opt. Soc. Am. B 23, 2383-2392 (2006).
- (9) Salandrino, A. & Engheta, N. Far-field subdiffraction optical microscopy using metamaterial crystals: Theory and simulations. Phys. Rev. B 74, 075103-(1-5) (2006).
- (10) Jacob, Z., Alekseyev, L. V. & Narimanov, E. Optical Hyperlens: Far-field imaging beyond the diffraction limit. Opt. Exp. 14, 8247-8256 (2006).
- (11) Fang, N., Lee, H., Sun, C. & Zhang, X. Sub-Diffraction-Limited Optical Imaging with a Silver Superlens. Science 308, 534-537 (2005).
- (12) Liu, Z., Durant, S., Lee, H., Pikus, Y., Fang, N., Xiong, Y., Sun, C. & Zhang, X. Far-field Optical Superlens. Nano Lett. 7, 403-408 (2007).
- (13) Liu, Z., Lee, H., Xiong, Y., Sun, C. & Zhang, X. Far-Field Optical Hyperlens Magnifying Sub-Diffraction-Limited Objects. Science 315, 1686 (2007).
- (14) Toraldo Di Francia, G. Super-Gain Antennas and Optical Resolving Power. Supplto. Nuovo Cim. 9, 426-438 (1952).
- (15) Berry, M. V. & Popescu, S. Evolution of quantum superoscillations and optical superresolution without evanescent waves. J. Phys. A: Math. Gen. 39, 6965-6977 (2006).
- (16) Aharonov, Y., Anandan, J., Popescu, S. & vaidman, L. Superpositions of time evolutions of a quantum system and a quantum time-translation machine. Phys. Rev. Lett. 64, 2965-68 (1990).
- (17) Ferreira, P. J. S. G. & Kempf, A. Superoscillation: Faster than the Nyquist rate. IEEE. Trans. Signal Process 54 3732-40 (2006).
- (18) Tollarksen, J. Novel relationships between superoscillations, weak values, and modular variables. J. Phys: Conference Series 70, 012016 (2007).
- (19) Huang, F. M., Chen, Y., Garcia de Abajo, F. J. & Zheludev, N. I. Focusing of light by a Nanohole array. Appl. Phys. Lett. 90, 091119 (2007).
- (20) Huang, F. M., Chen, Y., Garcia de Abajo, F. J. & Zheludev, N. I. Optical super-resolution through super-oscillations. J. Opt. A: Pure Appl. opt. 9, S285-S288 (2007).
- (21) Tsukerman, I. Superfocusing by Plasmonic/Dielectric Layers. arXive:0811.2247v1 [Cond-mat.other] 14 Nov 2008.
- (22) Oseen, C. W. Die Einsteinsche Nadelstichstrahlung und die Maxwellschen Gleichungen. Annalen. der. Physik. 374, 202 (1922).
- (23) Schelkunoff, S. A. A mathematical theory of linear arrays. Bell. Syst. Techn. Journ. 22, 80 (1943).
- (24) Bouwkamp, C. J. & Bruijn, N. G. de. The problem of optimum antenna current distribution. Philips. Res. Rep. 1, 135 (1946).
- (25) Woodward, P. M. & Lawson, J. D. The Theoretical Precision with which an Arbitrary Radiation Pattern may be Obtained from a Source of a Finite Size. Journ. I. E. E. 95, 363 (1948).
- (26) Slepian, D. & Pollak, H. O. Prolate Spheroidal wave Functions, Fourier Analysis and Uncertaincy-I. Bell System Tech. J. 40, 44-63 (1961).
- (27) Huang, F. M., Kao, T. S., Fedotov, V. A., Chen, Y., & Zheludev, N. I. Nanohole array as a lens. Nano Lett. 8, 2469-2472 (2008).
- (28) Born, M.& Wolf, E. Principles of OPtics, Second edition, 1964, page 334.
- (29) Dennis, M. R., Zheludev, N. I. & Garcia de Abajo, F. J. The plasmon Talbot effect. Opt. Exp. 15, 9692-9700 (2007).
- (30) Krenn, J. R. & Weeber, J.-C. Surface plasmon polaritons in metal stripes and wires. Phil. Trans. R. Soc. Lond. A 362, 739-756 (2004).
- (31) Zayats, A. V., Smolyaninovb, I. I. & Maradudinc, A. A. Nano-optics of surface plasmon polaritons. Phys. Rep. 408, 131-314 (2005).
- (32) Mandel L. & Wolf E. Optical coherence and quantum optics, Cambridge University Press, 1995.
.
Appendix A Designing a superoscillating mask
Here we describe a method to design a mask with a complex transmission function that will generate a prescribed field distribution within a limited region at a distance from the mask using prolate spheroidal wave functions 26 . We assume that the mask is illuminated at normal incidence with a plane monochromatic wave (the time dependent factor is omitted) with a wavelength . In the scalar angular spectrum description of light propagation 32 the field at a point is
| (1) |
where is the Fourier transform of . We now approximate as a limited series of orthogonal prolate spheroidal wave functions that are band-limited to the frequency domain
| (2) |
Here depends on a constant and the Fourier transform function of is given by
| (3) |
where is a radial prolate spheroidal wave function of the first kind and
| (4) |
| (5) |
It follows from the angular spectrum representation that to design a mask with a transmission function , which upon illumination by a single slit source (located at a distance from the mask), will convert its divergent incident field into a prescribed field distribution at a distance from the other side of the mask, the following formula should be used:
| (6) |
where is the Fourier transform function of the slit source.
In the case of lossy medium the transmission function shall be corrected:
| (7) | |||||
where is a complex wave-vector in the lossy medium.