Signatures of the Baryon Acoustic Oscillations on the Convergence Power Spectrum of Weak lensing by Large Scale Structure
Abstract
We employ an analytical approach to investigate the signatures of Baryon Acoustic Oscillations(BAOs) on the convergence power spectrum of weak lensing by large scale structure. It is shown that the BAOs wiggles can be found in both of the linear and nonlinear convergence power spectra of weak lensing at about , but they are weaker than that of matter power spectrum. Although the statistical error for LSST are greatly smaller than that of CFHT and SNAP survey especially at about , they are still larger than their maximum variations of BAOs wiggles. Thus, the detection of BAOs with the ongoing and upcoming surveys such as LSST, CFHT and SNAP survey confront a technical challenge.
keywords:
cosmology: theory , gravitational lensing , large-scale structure of universe1 Introduction
In the early universe prior to recombination, the free electrons couple the baryons to the photons through Coulomb and Compton interactions, so these three species move together as a single fluid. The primordial cosmological perturbations on small scales excite sound waves in this relativistic plasma, which results in the pressure-induced oscillations and acoustic peak (Bond & Efstathiou, 1984; Eisenstein & Hu, 1998). The memory of these baryon acoustic oscillations (BAOs) still remain after the epoch of recombination. The BAOs leave their imprints through the propagating of photons on the last scattering surface and produce a harmonic series of maxima and minima in the anisotropy power spectrum of the cosmic microwave background (CMB) at . In addition, due to the significant fraction of baryons in the universe, BAOs can also be imprinted onto the late-time power spectrum of the non-relativistic matter (Bond & Efstathiou, 1984; Hu & Sugiyama, 1996; Eisenstein & Hu, 1998), which have been detected in the large-scale correlation function of Sloan Digital Sky Survey (SDSS) luminous red galaxies (Eisenstein, 2005), and the power spectrum of cm emission generated from the neutral hydrogen from the epoch of reionization through the underlying density perturbation (Mao & Wu, 2008; Chang et al., 2008). Essentially, the BAOs can give rise to the wiggles in the matter power spectrum of large scale structure during the evolution of the universe. Gravitational lensing can directly reveal the strenth of gravitational clustering(Pen et al., 2003; Chen, 2005), and weak gravitational lensing is the direct measurement of the projected mass distribution of the large-scale structure(Mellier, 1999; Bartelmann & Schneider, 2001; Refregier, 2003; Lewis & Challinor, 2006; Munshi et al., 2008). Therefore, the BAOs prior to recombination should also be imprinted onto weak lensing power spectrum. Recently, the influence of baryons on the weak lensing power spectrum are investigated by many works (White, 2004; Zhan & Knox, 2004; Jing et al., 2006). Zhang (2008) study self calibration of galaxy bias in spectroscopic redshift surveys of baryon acoustic oscillations to show that SKA is able to detect BAO in the velocity power spectrum, and the precision measurement of cosmic magnification are also demonstrated(Zhang & Pen, 2005, 2006). The ongoing and upcoming surveys such as the Canada-France-Hawaii-Telescope (CFHT) Legacy Survey111http://www.cfht.hawaii.edu/Science/CFHLS/, the SuperNova Acceleration Probe222http://snap.lbl.gov: SNAP is being proposed as part of the Joint Dark Energy Mission (JDEM) (SNAP) and the Large Synoptic Survey Telescope333http://www.lsst.org (LSST) will significantly reduce the statistical errors to a few percent level in the measurement of weak lensing power spectrum. Therefore, it is necessary to explore the feasibility of detecting the BAOs in weak lensing surveys. In this paper, we concentrate on the wiggles of BAOs on the power spectrum of weak lensing by large scale structure and their detectability for current weak lensing survey.
2 Matter Power Spectra
We express the linear matter power spectrum in dimensionless form as the variance per unit logarithmic interval in wavenumber ()
| (1) |
where and are transfer function and linear growth factor respectively. We consider the effect of baryon content (thereby BAOs), so the transfer function can be approximately separated into the cold dark matter (CDM) and baryon components: , where is the CDM density parameter at present, . We adopt the asymptotic solutions to both and near the sound horizon given by Eisenstein & Hu (1998). For convenience, we employ the widely used fitting formula, which are calibrated with N-body simulation and given by Peacock & Dodds (1996), to map the linear matter power spectrum to the nonlinear power spectrum. Throughout this paper, we employ a concordance cosmological model revealed by the WMAP five-year observations(Hinshaw, 2008): , , , , .
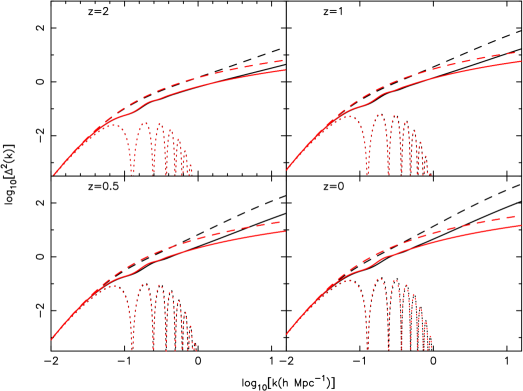
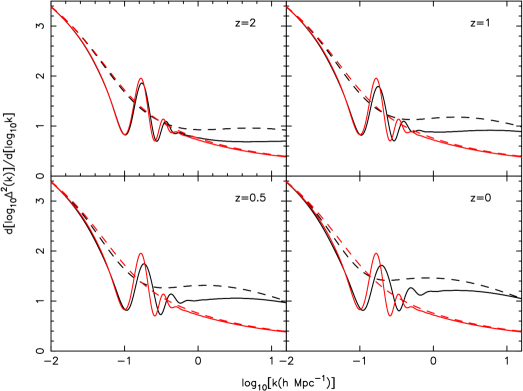
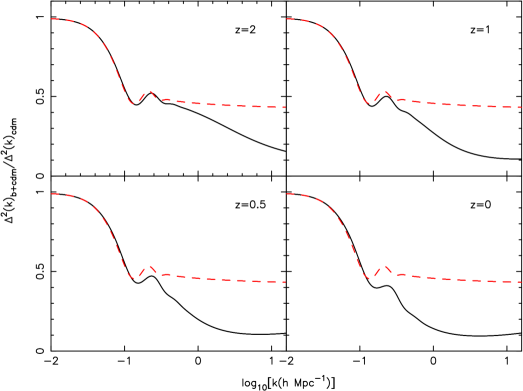
Mao & Wu (2008) revealed that the signatures of BAOs, i.e., wiggles, are seen at wavenumber Mpc-1 in both of the linear and nonlinear matter power spectra with the inclusion of baryons at relatively high redshift =6 when cosmic reionization ends. Due to different purpose, we in Fig.1 plot the matter power spectra for three different matter contents: pure CDM (dashed line), pure baryons (dotted line) and mixed baryons+CDM (solid line) but at redshift =2, 1, 0.5 and 0 respectively. The black lines correspond to the nonlinear power spectra of matter, while the red ones are the linear power spectra. In both of the linear and nonlinear power spectra of mixed baryons+CDM, the BAOs wiggles are clearly seen at wavenumber Mpc-1. It is also shown that, with the decrease of redshift, the clustering of structures are enhanced for both of pure CDM and mixed baryons+CDM models. Compared with pure CDM case, the mixed baryons+CDM case can suppress the linear and nonlinear power spectrum by an order of a few percents or more at about Mpc-1. For clarity, we demonstrate the first derivative of power spectrum with respect to for pure CDM (dashed line) and mixed baryons+CDM (solid line) at redshift =2, 1, 0.5 and 0 respectively in Fig.2. The minimum here correspond to the maximum in Fig.1, and about three wiggles are clearly revealed with the inclusion of baryon contents. We also see that, compared with linear power spectrum (red solid line), the nonlinear evolution of structure (black solid line) can suppress the amplitude of BAOs wiggles and shift them to small scales with decrease of redshift. To further show the effect of BAOs, we plot the ratio of power spectrum for the mixed baryons+CDM to that for pure CDM at redshift =2, 1, 0.5 and 0 respectively in Fig.3. The solid and dashed lines correspond to the ratios of nonlinear and linear power spectra respectively. Similar to Fig.2, the wiggles for both of linear and nonlinear power spectrum are also seen clearly. Except for at the scales () around wiggles, the suppression on the amplitude of nonlinear power spectrum due to the inclusion of baryon contents increase with the decrease of scales, while that for linear power spectrum increase slightly. Thus, the BAOs signatures can be imprinted onto the entire history of cosmic structure evolution since the epoch of recombination.
3 Weak Lensing Convergence Power Spectrum
Through the matter power spectrum, BAOs signature enters into the statistics of weak lensing by large scale structure. Using Limber’s approximation(Kaiser, 1992; Bartelmann & Schneider, 2001; Simon, 2007), we can write the convergence power spectrum of weak lensing as
| (2) |
where is the radial comoving coordinate distance and for open, for flat and for closed geometry of Universe respectively. The weight function is determined by the source galaxy distribution function and the lensing geometry . Here is normalized such that . If all sources are at a single redshift (or the distribution of source galaxies is given within a thin sheet at redshift ), we have and then . Following the works (Rudd et al., 2008; Jing et al., 2006), for simplicity, we assume that the source galaxies are distributed within a thin sheet at throughout this paper. For a flat universe, , so Eq.(2) reduces to
| (3) |
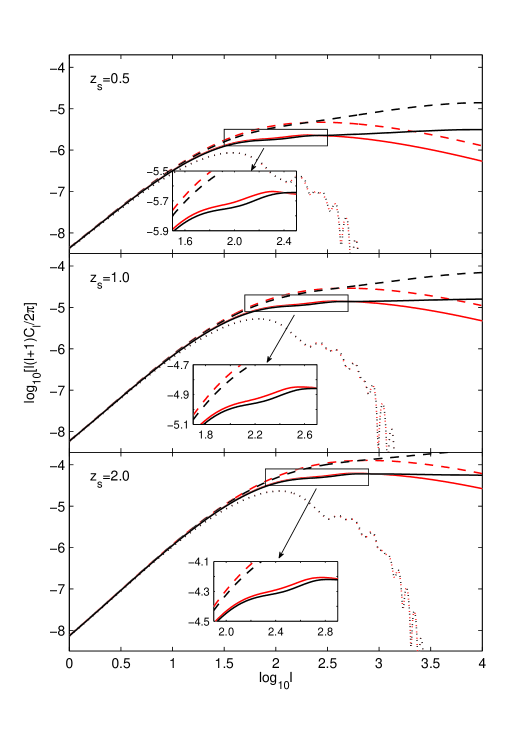
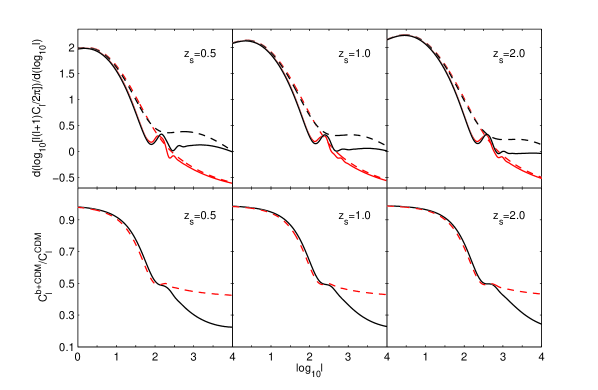
In Eqs.(2) and (3), the matter power spectrum as a function of wavenumber and redshift satisfies Eq.(1): . In Fig.4, we show the signatures of BAOs on the convergence power spectra of weak lensing with the source galaxies at redshift and 2.0, respectively. This figure plot the convergence power spectra for three different matter contents: pure CDM (dashed line), pure baryons (dotted line) and mixed baryons+CDM (solid line) respectively. Both of the linear and nonlinear power spectra of weak lensing are suppressed at about due to the inclusion of baryon contents. The BAOs wiggles can be visible in both of the linear and nonlinear power spectra for the mixed baryons+CDM model at about . With the increase of from 0.5 to 2, the wiggles are shifted to small scales for both of linear and nonlinear power spectra, i.e., from the scale range of about to . Compared with that of matter power spectrum, the BAOs wiggles in the convergence power spectra are weaker. To be more clearly, the first derivative of with respect to and the ratio, of power spectrum for the mixed baryons+CDM to that for pure CDM are shown in Upper panel and Bottom panel of Fig.5 respectively. At about , the wiggles are revealed clearly in Upper panel for different due to the inclusion of baryon contents. Similar to matter power spectrum (Fig.3), it is shown in Bottom panel for different that the suppression on nonlinear convergence power spectrum amplitude due to the inclusion of baryon contents increases with the decrease of scales () except for the scales around wiggles, while that for linear convergence power spectrum vary slightly.
4 Detectability
In order to demonstrate the detectability of BAOs, we compare our results with the statistical uncertainty in the measurement of the convergence power spectrum by ongoing and upcoming weak lensing survey projects such as CFHT, SNAP and LSST. The statistical errors in the measurements of weak lensing power spectrum (assuming Gaussianity) are described by (Kaiser, 1992, 1998; Seljak, 1998; Huterer, 2002)
| (4) |
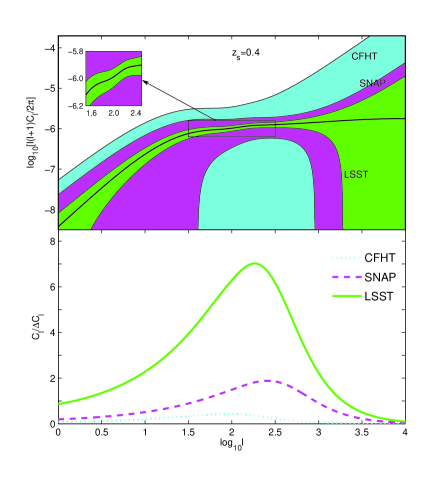
where is the coverage fraction of sky covered by a survey of area in units of deg2, is the effective surface number density of source galaxies with measurable shapes on the sky, and is the rms intrinsic shape noise for each galaxy. The cosmic variance, which corresponds to the first term of Eq.(4), dominates the uncertainty in the observed convergence power spectrum on large scales, and Poisson noise corresponding to the second term come from the limited number of galaxies on small scales. As an ongoing observational project, we consider a survey CFHT which covers a fraction of the sky, with a number density of source galaxies of . For future survey, we take and for LSST survey and and for SNAP survey respectively (Rudd et al., 2008). We adopt for the variance of the intrinsic ellipticity of source galaxies. The top panel of Fig.6 shows the nonlinear convergence power spectra for mixed baryons+CDM with statistical errors with the source galaxies distributed within a thin sheet at .. For CFHT and SNAP survey, the statistical error are greatly larger than the maximum variations of wiggles, which is the power spectrum difference between wiggle peak and adjacent troughs. Compared with that of CFHT and SNAP survey, the statistical error for LSST are relatively small especially at about . In addition, we also in the bottom panel of Fig.6 plot the signal-to-noise of the convergence power spectrum for the weak lensing survey projects. It is noticed that the range of scales with high signal-to-noise for LSST is much wider than that of CFHT and SNAP. Even so, it seems that a significant detection of BAOs wiggles on convergence power spectra is still difficult for current weak lensing survey due to the weakness of BAOs signals themselves and limitation of statistical errors of current telescopes. Our result is roughly in agreement with that of work(Simpson, 2006).
5 Conclusions
In this paper, we use an analytical approach to present signatures of BAOs on the convergence power spectrum of weak lensing. We show that, in both of the linear and nonlinear matter power spectra of mixed baryons+CDM, the BAOs wiggles can be clearly seen at about Mpc-1. With the decrease of redshift, the clustering of structures are enhanced for both of the pure CDM and mixed baryons+CDM models. Compared with pure CDM case, the mixed baryons+CDM case can suppress the linear and nonlinear matter power spectrum by an order of a few percents or more at about Mpc-1. The nonlinear evolution of structure can suppress the amplitude of BAOs wiggles and shift them to small scales with decrease of redshift. For the convergence power spectrum of weak lensing, we show that the BAOs wiggles can be visible in both of the linear and nonlinear power spectra for the mixed baryons+CDM model at about , but they are weaker than that of matter power spectrum. With the increase of from 0.5 to 2, the BAOs wiggles are shifted to small scales for both of linear and nonlinear power spectra, i.e., from the range of about to . We also study the detectability of BAOs’s wiggles for weak lensing survey. Although the statistical error for LSST are greatly smaller than that of CFHT and SNAP survey especially at about , they are still larger than the their maximum variations of BAOs wiggles. Thus, the detection of BAOs with the ongoing and upcoming surveys such as LSST, CFHT and SNAP survey i confront a technical challenge. Therefore, we expect future weak lensing survey with more lower statistical errors to capture BAOs wiggles signal from the convergence power spectrum. In addition, we have shown that the BAOs signatures can be imprinted onto the entire history of cosmic structure evolution since the epoch of recombination. The future observation of BAOs on weak lensing will provide a complementary knowledge of current BAOs measurement. On the other hand, the BAOs provide a “standard ruler” for the determination of cosmological parameters especially the probes of dark energy, so the combination of BAOs measurement by weak lensing together with other detection of BAOs signature at different stage: the last scattering surface, reionization and large scale distribution of galaxies in local universe, will supply more robust constraint on cosmological models in the future.
Acknowledgments. We are very grateful to the anonymous referee for his valuable comments and suggestions that greatly improve this paper. We also thank Dr.Pengjie Zhang for valuable discussion and useful comment. This work was supported by the National Science Foundation of China (Grants No.10473002, 10533010), the Ministry of Science and Technology National Basic Science program (project 973) under grant No.2009CB24901 and the Scientific Research Foundation for the Returned Overseas Chinese Scholars, State Education Ministry.
References
- Bartelmann & Schneider (2001) Bartelmann, M. & Schneider, P. 2001, Phys. Rep., 340, 291
- Bond & Efstathiou (1984) Bond, J. R. & Efstathiou, G. 1984, ApJL, 285, L45
- Chang et al. (2008) Chang, T.-C., Pen, U.-L., Peterson, J. B., & McDonald, P. 2008, Physical Review Letters, 100, 091303
- Chen (2005) Chen, D.-M. 2005, ApJ, 629, 23
- Eisenstein (2005) Eisenstein, D. J. ,et al, . 2005, ApJ, 633, 560
- Eisenstein & Hu (1998) Eisenstein, D. J. & Hu, W. 1998, ApJ, 496, 605
- Hinshaw (2008) Hinshaw, G. ,et al. 2008, ArXiv e-prints: 0803.0732
- Hu & Sugiyama (1996) Hu, W. & Sugiyama, N. 1996, ApJ, 471, 542
- Huterer (2002) Huterer, D. 2002, PRD, 65, 063001
- Jing et al. (2006) Jing, Y. P., Zhang, P., Lin, W. P., Gao, L., & Springel, V. 2006, ApJL, 640, L119
- Kaiser (1992) Kaiser, N. 1992, ApJ, 388, 272
- Kaiser (1998) —. 1998, ApJ, 498, 26
- Lewis & Challinor (2006) Lewis, A. & Challinor, A. 2006, Phys. Rep., 429, 1
- Mao & Wu (2008) Mao, X.-C. & Wu, X.-P. 2008, ApJL, 673, L107
- Mellier (1999) Mellier, Y. 1999, ARA&A, 37, 127
- Munshi et al. (2008) Munshi, D., Valageas, P., van Waerbeke, L., & Heavens, A. 2008, Phys. Rep., 462, 67
- Peacock & Dodds (1996) Peacock, J. A. & Dodds, S. J. 1996, MNRAS, 280, L19
- Pen et al. (2003) Pen, U., Zhang, T., van Waerbeke, L., Mellier, Y., Zhang, P., & Dubinski, J. 2003, ApJ, 592, 664
- Refregier (2003) Refregier, A. 2003, ARA&A, 41, 645
- Rudd et al. (2008) Rudd, D. H., Zentner, A. R., & Kravtsov, A. V. 2008, ApJ, 672, 19
- Seljak (1998) Seljak, U. 1998, ApJ, 506, 64
- Simon (2007) Simon, P. 2007, A&A, 473, 711
- Simpson (2006) Simpson, F. 2006, ApJL, 647, L91
- White (2004) White, M. 2004, Astroparticle Physics, 22, 211
- Zhan & Knox (2004) Zhan, H. & Knox, L. 2004, ApJL, 616, L75
- Zhang (2008) Zhang, P. 2008, ArXiv e-prints: 0802.2416
- Zhang & Pen (2005) Zhang, P. & Pen, U.-L. 2005, Physical Review Letters, 95, 241302
- Zhang & Pen (2006) —. 2006, MNRAS, 367, 169