Compendio Viminale, 00184 Roma, Italy
ciro.cattuto@roma1.infn.it 22institutetext: Dipartimento di Fisica, Università di Roma “La Sapienza”
P.le A. Moro, 2, 00185 Roma, Italy 33institutetext: Institute for Scientific Interchange (ISI), Torino, Italy
Emergent Community Structure
in Social Tagging Systems
Abstract
A distributed classification paradigm known as collaborative tagging has been widely adopted in new web applications designed to manage and share online resources. Users of these applications organize resources (web pages, digital photographs, academic papers) by associating with them freely chosen text labels, or tags. Here we leverage the social aspects of collaborative tagging and introduce a notion of resource distance based on the collective tagging activity of users. We collect data from a popular system and perform experiments showing that our definition of distance can be used to build a weighted network of resources with a detectable community structure. We show that this community structure clearly exposes the semantic relations among resources. The communities of resources that we observe are a genuinely emergent feature, resulting from the uncoordinated activity of a large number of users, and their detection paves the way to mapping emergent semantics in social tagging systems.
Keywords:
folksonomy, collaborative tagging, emergent semantics,online communities, web 2.0
1 Introduction
Information systems on the World Wide Web have been increasing in size and complexity to the point that they presently exhibit features typically attributed to bona fide complex systems. They display rich high-level behaviors that are causally connected in non-trivial ways to the dynamics of their interacting elementary parts. Because of this, concepts and formal tools from the science of complex systems can play an important role in understanding the structure and dynamics of such systems.
This study focuses on the recently established paradigm of collaborative tagging mates ; connotea1 . In web applications like del.icio.us111http://del.icio.us/, Flickr222http://flickr.com/, BibSonomy333http://www.bibsonomy.org/ users organize diverse resources – ranging from web pages to academic papers and photographs – with semantically meaningful information in the form of text labels, or “tags”. Tags are freely chosen and users associate resources with them in a totally uncoordinated fashion. Nevertheless, the tagging activity of each user is globally visible to the user community and the tagging process develops genuine social aspects and complex interactions huberman ; noi_tagging , eventually leading to a bottom-up categorization of resources shared throughout the user community. The open-ended set of tags used within the system – commonly referred to as “folksonomy” – can be used as a sort of semantic map to navigate the contents of the system itself.
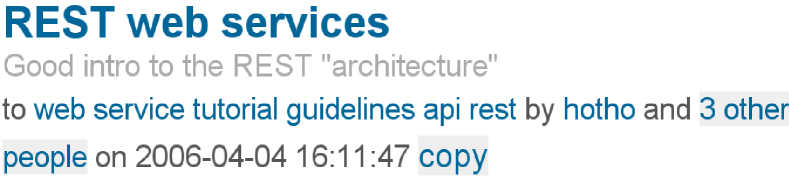
In figure 1 a single annotation example (said “post”) is shown, as appears in the interface of bibsonomy.org system.
Our work is based on experimental data from one of the largest and most popular collaborative tagging systems, del.icio.us, currently used by over a million users to manage and share their collections of web bookmarks.
The main point of our work is neither to present a new spectral community detection algorithm, nor to report a large data set analysis. Rather, we want to show that, choosing the right projection and the right weighting procedure, we can produce a weighted undirected network of resources from the full tri-partite folksonomy network, which embed a meaningful social classification of resources. This is especially surprising, considering that users annotate resources in a very anarchic, uncoordinated and noisy way.
In section 2 we describe the experimental data we collected. In Section 3 we introduce a notion of resource distance based on the collective activity of users. Based on that, we set up an experiment using actual data from del.icio.us and we build a weighted network of resources. In section 4 we show that spectral methods from complex networks theory can be used to detect clusters of resources in the above network and we characterize those clusters in terms of user tags, exposing semantics. Finally, section 5 gives an overview of our results and points to directions for future work.
2 Experimental Data
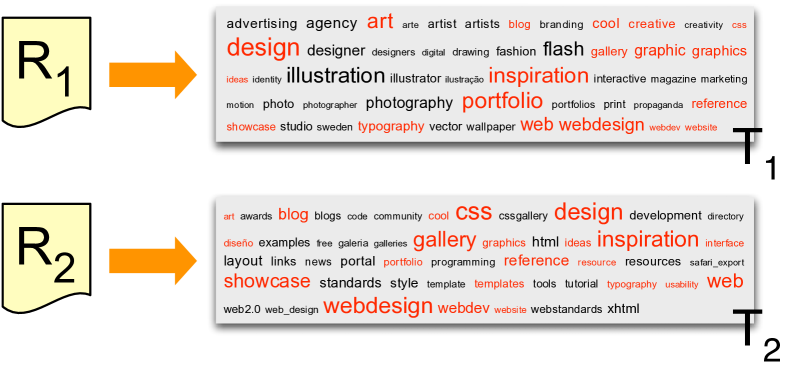
Our analysis focuses on del.icio.us for several reasons: i) it was the first system to deploy the ideas of collaborative tagging on a large scale, so it has acquired a paradigmatic character and it is the natural starting point for any quantitative study. ii) it has a large user community and contains a huge amount of raw data on the structure and dynamics of a folksonomy. iii) it is a broad folksonomy vanderwal , i.e. single tag associations by different users retain their identity and can be individually retrieved. This allows us to measure the number of times that a given tag was associated with a specific resource as the number of users who established that resource-tag association (see also Fig. 2). That is, a broad folksonomy has a natural notion of weight for tag associations, which is based on social agreement. On studying del.icio.us we adopt a resource-centric view of the system, that is we investigate the emergent correspondence between a given resource and the tags that all users associate with it. We factor out the detailed identity of the users and only deal with the set of tags associated by the user community with a given resource, as well as with the frequencies of occurrence of those tags in the context of the resource.
To collect data, we used a web crawler that connects to del.icio.us and navigates the system’s interface as an ordinary user would do, extracting tagging metadata and storing it for further post-processing. Our client connects to del.icio.us and downloads the web pages associated with a given set of resources, using an HTML parser to extract the tagging information from the page. The system allows to get the complete set of annotations associated with each resource. The data used for the present analysis were retrieved in October 2006.
3 Resource Networks from Collective Tagging Patterns
In a collaborative tagging system, a set of resources defines a “semantic space” that is explored and mapped by a community of users, as they bookmark and tag those resources hotho2006emergent . We want to investigate whether the tagging activity is actually structuring the space of resources in a semantically meaningful way, i.e. whether partitions or subsets of resources emerge, associated with tagging patterns that point to well-defined meanings, areas of interest or topics. These groups of resources could also identify, in principle, communities of users sharing the same view of resources, or the same emergent vocabulary.
In order to gain insight into the above problem, we set up an experiment using del.icio.us as a data source. We want to stress here that, since the aim of the work is to investigate whether an emergent community structure exists in folksonomy data, we are not concerned with the completeness of the dataset used. Rather, we decided to perform the experiment on the following subset: we selected two popular tags that appear to be semantically unrelated (design and politics), and for each of them we extracted from del.icio.us a set of randomly chosen resources (we take the first returned by the system, representing the most recently introduced by users). For each resource, we collected the complete set of annotations, i.e. all the tag assignments relative to that resource. The corresponing dataset used for this experiment, thus consists of resources: half of them have been associated with the tag design, while the other half has been tagged with politics. The idea is to construct a dataset containing at least two semantically well-separated subsets. For each resource in the dataset, the entire tagging history was retrieved from del.icio.us, so that all the tag associations involving the chosen resources are known. In other words, we know how the entire user community of del.icio.us “categorized” the selected resources in terms of freely-chosen tags, with no biases due to data collection.
To uncover structures linked to specific tagging patterns we introduce a notion of similarity between resources based on how those resources were tagged by the user community. For each resource, we define a tag-cloud as the weighted set of tags that have been used to bookmark that resource, where the weight of tag is its frequency of occurrence in the context of that resource (Fig. 2). We want to formalize the intuitive idea that two resources are similar if the corresponding tag-clouds have a high degree of overlap. Given two generic resources and , and the corresponding sets of tags and , a natural measure of tag-cloud overlap would be the standard set overlap given by the cardinality of the intersection set divided by the cardinality of the union set . This simple measure, however, has a major fault: since no notion of tag weight (frequency) is used, it is not sensitive to the social aspects of tagging encoded in tag frequencies (and as such, it is also vulnerable to tagging noise, i.e. errant, strange, incorrect or even malicious tagging, or spamming networkproperties ; spamfight ; heymann2007spam ). To overcome this limitation we adopt a TF-IDF weighting procedure tfidf . The TF-IDF weight (Term Frequency - Inverse Document Frequency) is commonly used in information retrieval and text mining and represents a statistical measure used to evaluate how specific a term is in identifying a document belonging to a collection of documents. The importance of a term increases proportionally to the number of times the term appears in the document, and inversely proportional to the global frequency of the same term in the document collection.
We denote with and the frequencies of occurrence of tag in and , respectively, and with the global frequency of tag , that is the total number of times that tag was used in association with all the resources under study.
In the spirit of the TF-IDF techniques, we normalize the frequencies of tags by their global frequencies. When a tag is shared by resources and , it has two different frequencies, in the context of and in the context . When performing the intersection between tag-clouds, we use the lowest of those frequencies to define the weight of tag in the intersection set , while we use the highest of those frequencies when weighting the contribution of same tag in the union set . More precisely, we define the similarity between and as:
| (1) |
The above expression is an extension of the simple measure of set overlap, where the numerator is a weighted form of set intersection and the denominator is a weighted form of set union. By definition, . Of course the above definition is just one of the possible similarity measures that can be employed, and the validation of the measure we introduce here is left to the results obtained by using it, as shown in section 4. The similarity matrix introduced above can be regarded as the adjacency matrix of a weighted network of resources vespignani , where is the strength of the edge connecting nodes and .
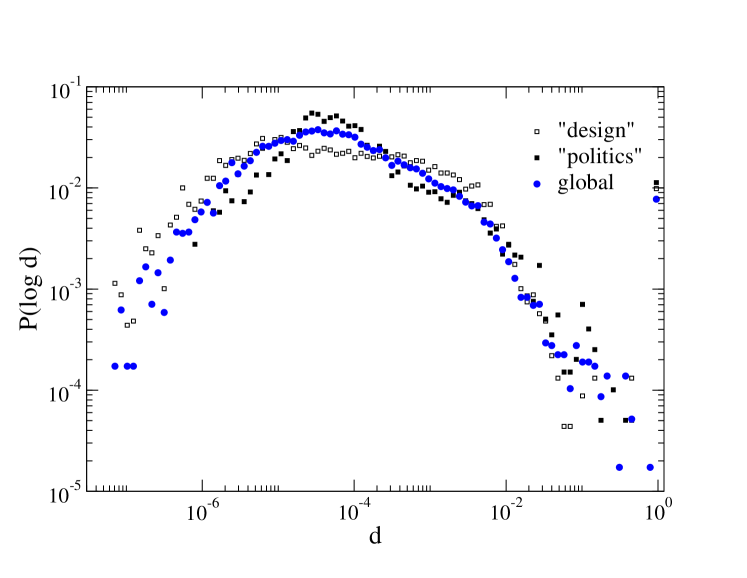
Fig. 3 shows the distribution of similarities (edge strengths in the weighted network) among all the pairs of resources, for three different sets of resources: the subset of resources sharing the tag design, the subset of resources sharing the tag politics and the union of those sets. Notice that the global frequency of a given tag depends on the set of resources chosen for the analysis. From the plot it is evident that weights span a wide range of values and the logarithm of the weight is best suited to appreciate the full range of strength variability.
4 Community Structure of the Resource Network
In order to investigate the existence of underlying structures in the set of resources we proceed as follows. First, we transform the similarity matrix in order to compress the dynamic range of strength values. Since the logarithmic scale gives a good representation of the strength variability (Fig. 3), but has divergence problems in the neighborhood of zero, we consider a matrix where each element is raised to a small (arbitrary) power . Thus, the similarity matrix we will use in the following is defined as:
| (2) |
Note that the similarity metrics 2 is similar to the one introduced in filippoalex1 and filippoalex2 for a clastering experiment in an ontology of web pages, and was inspired by information theory arguments.
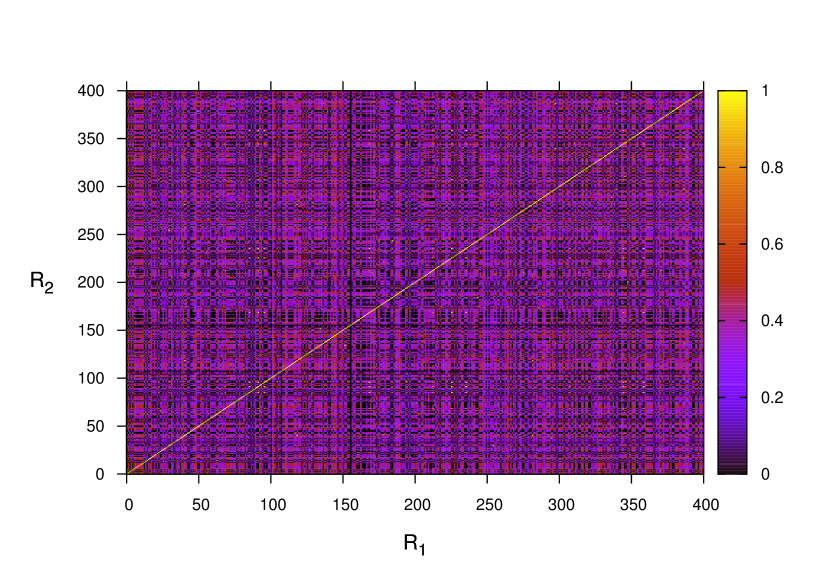
Figure 4 displays the similarity matrix (link strengths of the weighted similarity network) between pairs of resources for the full set of resources. The resources are randomly ordered and no structures are visible in this representation.
The problem we have to tackle now is finding the sequence of row and column permutations of the similarity matrix that permits to visually identify the presence of communities of resources, if at all possible. The goal is to obtain a matrix with a clear visible block structure on its main diagonal. One possible way to approach this problem is to construct an auxiliary matrix and use information deduced from its spectral properties to rearrange row and columns of the original matrix. The quantity we consider is the matrix
| (3) |
where and is a diagonal matrix where each element on the main diagonal equals the sum of the corresponding row of , i.e. . The matrix is non negative and resembles the Laplacian matrix of graph theory. As shown in capocci05 ; newman06 , the study of its spectral properties can reveal the community structure of the network.
The main idea is to consider the lowest eigenvalues of . According to the definition of , there is a always a zero eigenvalue corresponding to an eigenvector with equal components, i.e. a trivial constant eigenvector. Let us now consider the simple case where the matrix is composed of exactly two non-zero blocks along its main diagonal (i.e. with two clearly separated semantic communities). In this case, two eigenvectors with zero eigenvalue are present, signalling the existence of two disconnected components. When non-zero entries connecting the two blocks are present, only one null eigenvalue survives, and the components of the eigenvectors with the lowest eigenvalues reveal the community structure. Given the set of these non trivial eigenvectors, a very simple way to identify the communities consists in plotting their components on a (multidimensional) scatter plot. Each axis reports the values of the components of the eigenvectors. In particular each point has coordinates equal to the homologous components of one eigenvector. In this kind of plot communities emerge as well defined clusters of points aligned along specific directions. The components involved in each clusters identify the elements belonging to a given community. Once identified the communities, it is interesting to permute the indexes of the original matrix such that the components of the same community become adjacent. The corresponding matrix should appear roughly made by diagonal blocks, possibly with mixing terms signalling an overlap between communities (blocks).
Figure 5 displays the eigenvalues of sorted by their value. As expected, the null eigenvalue is present, corresponding to the trivial constant eigenvector.
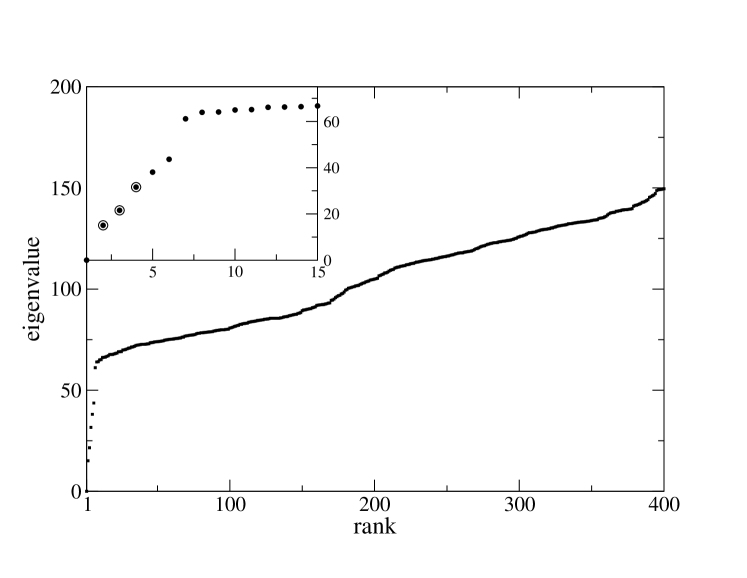
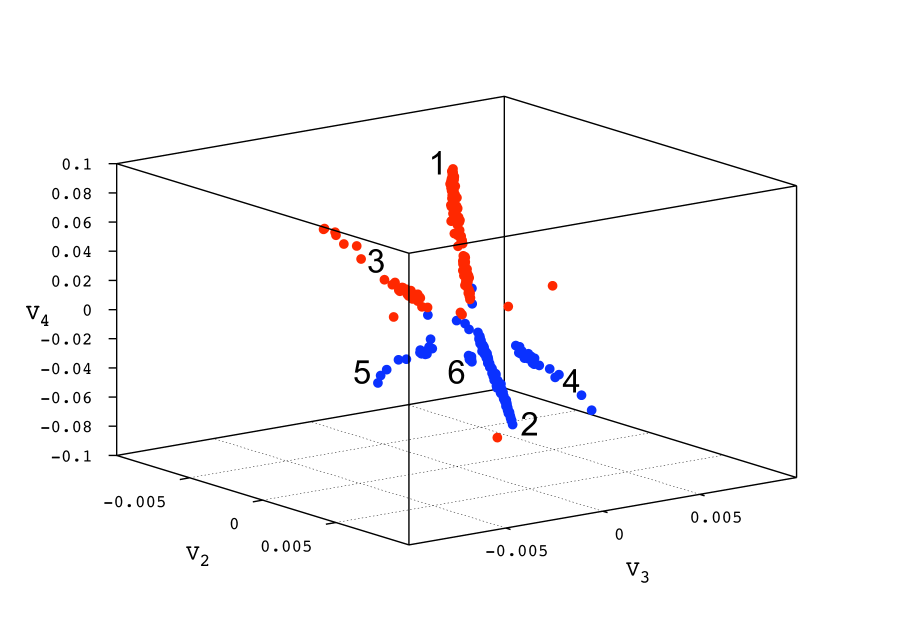
Figure 6 displays a 3-dimensional scatter plot illustrating the structure of the three eigenvectors that correspond to the three lowest non-trivial eigenvalues of (the second, third and fourth ones, see Fig.5). The axes report the values of the components of the second, third and fourth eigenvectors, respectively (denoted by , and ). In particular each point has coordinates equal to the homologous components for the three non-trivial eigenvectors considered. The existence of at least well defined communities is evident, with each community corresponding to one of the five well-separated non-null eigenvalues of Fig. 5. A sixth very small community, corresponding to the sixth non-trivial eigenvalue, is barely visible.
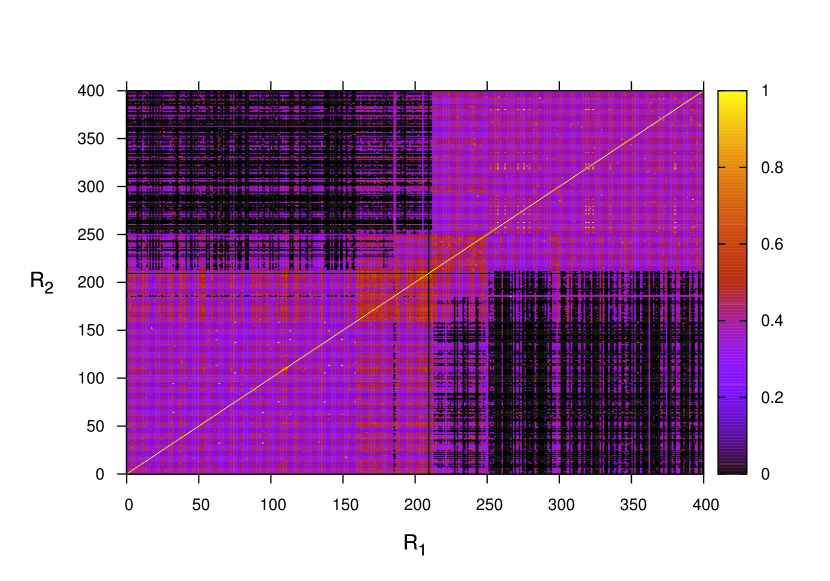
Once we have diagonalized the matrix the permutation of indexes necessary to sort the component values of these eigenvectors yields the desired ordering of rows and columns in the original matrix . By performing this reordering it is possible to visualize the matrix of strengths of Fig. 4 in a way that makes it maximally diagonal. Fig. 7 reports the reordered matrix.
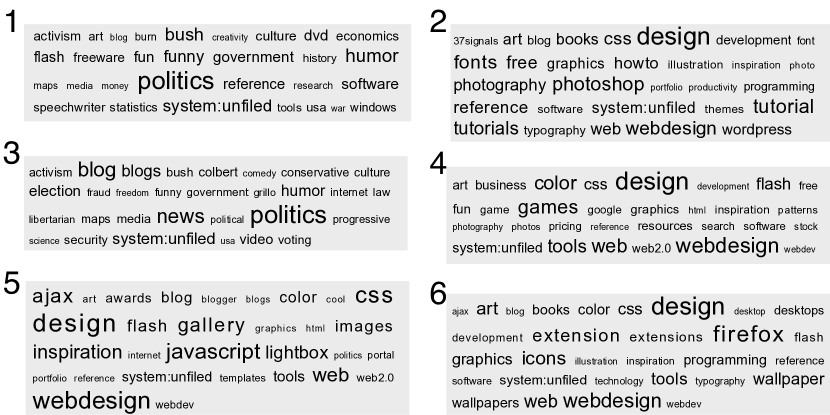
An interesting question is now whether the communities we have found correspond to semantic differences in the set of resources. In order to check this point we build for each community a tag-cloud from the tags associated with the corresponding group of resources. Fig. 8 reports the six tag-clouds (ordered by decreasing number of member resources), where the font size of each tag, as usual, is proportional to the logarithm of its frequency of occurrence. Despite the intrinsic difficulty of identifying the semantic context defined by a given tag-cloud, it is possible to recognize that each comunity of resources – at least for the four largest four – comprises resources with a specific semantic connotation. In particular the first community can be associated to humor in politics, the second one to visual design, the third one to political blogs and the fourth one to web design.
5 Conclusions
The increasing impact of web-based social tools for the organization and sharing of resources is motivating new research at the frontier of complex systems science and computer science, with the goal of harvesting the emergent semantics steels of these new tools.
The increasing interest on such new tools is based on the belief that the anarchic, uncoordinated activity of users can be used to extract meaningful and useful information. For instance, in social bookmarking systems, people annotate personal list of resources with freely chosen tags. Wheter or not this could provide a ”social” classification of resources, is the point we want to investigate with this work. In other words, we investigate whether an emergent community structure exists in folksonomy data. To this aim, we focused on a popular social bookmarking system and introduced a notion of similarity between resources (annotated objects) in terms of social patterns of tagging. We used our notion of similarity to build weighted networks of resources, and showed that spectral community-detection methods can be used to expose the emergent semantics of social tagging, identifying well-defined communities of resources that appear associated with distinct and meaningful tagging patterns. The present analysis was limited to an experiment where the set of resources was artificially built by selecting resources tagged with semantically unrelated tags: future directions for this research include large-scale experiments on broader sets of resources, to assess the robustness of our method, as well as the investigation of other indicators of social agreement that can be leveraged to expose structures in folksonomies. Such efforts could lead to improved user interfaces, increasing both usability and utility of these new powerful tools.
Acknowledgements
The authors wish to thank Melanie Aurnhammer, Andreas Hotho and Gerd Stumme for very interesting discussions. This research has been partly supported by the TAGora project funded by the Future and Emerging Technologies program (IST-FET) of the European Commission under the contract IST-34721. The information provided is the sole responsibility of the authors and does not reflect the Commission’s opinion. The Commission is not responsible for any use that may be made of data appearing in this publication.
References
- (1) A. Mates, Folksonomies - Cooperative Classification and Communication Through Shared Metadata, Computer Mediated Communication, LIS590CMC, Graduate School of Library and Information Science, University of Illinois Urbana-Champaign (2004).
- (2) T. Hammond, T. Hannay, B. Lund and J. Scott, Social Bookmarking Tools (I): A General Review, D-Lib Magazine 11(4), (2005).
- (3) S. Golder and B. A. Huberman, Usage patterns of collaborative tagging systems, Journal of Information Science 32, 198 (2006).
- (4) C. Cattuto, V. Loreto, and L. Pietronero, Semiotic Dynamics and Collaborative Tagging, Proc. Natl. Acad. Sci. USA 104, 1461 (2007).
- (5) T. Vander Wal, Explaning and Showing Broad and Narrow Folksonomies, http://www.personalinfocloud.com/2005/02/explaining_and_.html, (2005).
- (6) A. Hotho, R. Jäschke, C. Schmitz and G. Stumme, Emergent Semantics in BibSonomy, Proc. Workshop on Applications of Semantic Technologies. In: eds. C. Hochberger and R. Liskowsky, Informatik für Menschen. Band 2, p94 (2006).
- (7) G. Salton and M.J. McGill, Introduction to modern information retrieval (McGraw-Hill, 1983).
- (8) A. Barrat, M. Barthelemy, R. Pastor-Satorras and A. Vespignani, The architecture of complex weighted networks, Proc. Natl. Acad. Sci. USA 101, 3747 (2004).
- (9) A. Capocci, V.D.P. Servedio, G. Caldarelli and F. Colaiori, Physica A 352, 669 (2005).
- (10) M.E.J. Newman, Phys. Rev. E 74, 036104 (2006).
- (11) L. Steels, Semiotic Dynamics for Embodied Agents, IEEE Intelligent Systems, 21, 32 (2006).
- (12) Ciro Cattuto, Christoph Schmitz, Andrea Baldassarri, Vito D. P. Servedio, Vittorio Loreto, Andreas Hotho, Miranda Grahl and Gerd Stumme, Network Properties of Folksonomies, AI Communications Journal, Special Issue on ”Network Analysis in Natural Sciences and Engineering”, S. Hoche and A. Nürnberger and Jürgen Flach Eds., IOS PRESS, 20, n.4, 245–262 (2007).
- (13) Georgia Koutrika, Frans Adjie Effendi, Zoltán Gyöngyi, Paul Heymann and Hector Garcia-Molina, Combating spam in tagging systems, AIRWeb ’07: Proceedings of the 3rd international workshop on Adversarial information retrieval on the web, p. 57–64, ACM Press (2007).
- (14) Paul Heymann and Georgia Koutrika and Hector Garcia-Molina, Fighting Spam on Social Web Sites: A Survey of Approaches and Future Challenges, IEEE Internet Computing, 11, 35–46 (2007)
- (15) Ana G. Maguitman, Filippo Menczer, Heather Roinestad and Alessandro Vespignani, Algorithmic detection of semantic similarity WWW ’05: Proceedings of the 14th international conference on World Wide Web 107–116 (2005).
- (16) Ana Maguitman, Filippo Menczer, Fulya Erdinc, Heather Roinestad and Alessandro Vespignani, Algorithmic Computation and Approximation of Semantic Similarity World Wide Web 9 431–456 (2006)