Modeling The Star Forming Universe at z=2: Impact of Cold Accretion Flows
Abstract
We present results of a semi-analytic model (SAM) that includes cold accretion and a porosity-based prescription for star formation. We can recover the puzzling observational results of low seen in various massive disk or disk-like galaxies, if we allow 18 of the accretion energy from cold flows to drive turbulence in gaseous disks at . The increase of gas mass through cold flows is by itself not sufficient to increase the star formation rate sufficiently to recover the number density of M⊙ yr-1 galaxies in our model. In addition, it is necessary to increase the star formation efficiency. This can be achieved naturally in the porosity model, where star formation efficiency scales , which scales as cloud velocity dispersion. As cold accretion is the main driver for gas velocity dispersion in our model, star formation efficiency parallels cold accretion rates, and allows fast conversion into stars. At , we find a space density Mpc-3 in star-forming galaxies with M⊙ yr-1, in better agreement than earlier estimates form SAMs. However, the fundamental relation between and is still offset from the observed relation, indicating the need for possibly more efficient star formation at high z perhaps associated with a role for AGN triggering.
Subject headings:
galaxies: evolution – galaxies: kinematics and dynamics – galaxies: spiral1. Introduction
Multiple lines of evidence suggest that galaxy formation is taking place with a varying degree of efficiency over cosmic time. The overall star formation density in the universe declines at (e.g. Hopkins, 2004, and references therein), a feature seen also in the normalization of the relation between stellar mass and star formation rate (Caputi et al., 2006; Daddi et al., 2007; Noeske et al., 2007). Further support for the notion of rapid early formation of galaxies at , especially massive ones, comes from high Fe ratios (Thomas et al., 2005), early metal enrichment (Maiolino et al., 2008), growth of super-massive black holes (Hasinger et al., 2005) and the assembly rate of massive galaxies (Pérez-González et al., 2008). The redshift range has been targeted by various surveys combining broadband color selection techniques (e.g. Daddi et al., 2004; Steidel et al., 2004; Daddi et al., 2007, (D07)) and recently by high-resolution H integral field spectroscopy (Förster Schreiber et al., 2006). The latter reveals massive M⊙, rotating disk galaxies with star formation rates of M⊙ yr-1 and velocity dispersions of km s-1 (e.g. Genzel et al., 2006). The origin of the high star formation rates and the large velocity dispersion in these galaxies is not presently understood.
On the theoretical side, detailed comparisons between observations at and N-body-SPH simulations or semi-analytical models (SAM) show discrepancies. Although the overall slope of the SFR is well recovered in the models, the normalization is significantly smaller (D07; Davé, 2008, see however Dekel et al. 2008).
Theory and numerical simulations show that galaxies accrete cold gas in two modes. At early times and in small dark matter halos, most of the gas never shock heats to the virial temperature and is accreted on a free fall time scale (Birnboim & Dekel, 2003; Kereš et al., 2005; Dekel & Birnboim, 2006; Ocvirk et al., 2008; Kereš et al., 2009). The general condition for a stable extended shock to be maintained is that the post-shock gas remains highly pressurized. In practice, this means that the loss of energy by radiative cooling needs to be at least compensated by the compression of post-shock infall material (Dekel & Birnboim, 2006). This condition leads to a critical halo mass of M M⊙ (Ocvirk et al., 2008) for shock heating of gas and hence a transition from fast and efficient ”cold accretion” onto the galaxy to a more moderate ”hot accretion ” mode set by the radiative cooling time of the gas. In an earlier study Genzel et al. (2008) showed that the number density and accretion rates of dark matter halos suffice to provide enough high star forming galaxies, assuming that the newly accreted dark matter provides the universal fraction of baryons, and that these baryons are all transformed into stars. Alternatively, using a hydrodynamical simulation, Dekel et al. (2009) showed that the gas accretion rates are comparable to the observed star formation rates thus requiring a very efficient transformation of accreted gas into stars.
In this Letter, we aim at addressing the interlinked questions of high star formation rates and velocity dispersion observed in galaxies at . Our work expands on the results previously presented by Dekel et al. (2009) and Genzel et al. (2008). In particular, we model the effect of cold accretion on driving turbulence in the interstellar medium (ISM) and employ a porosity description for the ISM and star formation within it. The latter hypothesis is able to provide high star formation efficiencies in the context of a physically motivated model.
2. Model
In the following, we briefly outline our fiducial semi-analytic model (Khochfar & Burkert, 2005; Khochfar & Silk, 2006, and references therein) and the changes we have introduced. We generate merger trees for dark matter halos using a Monte-Carlo approach based on the extended Press-Schechter formalism (Somerville & Kolatt, 1999) down to a mass resolution of . Once a tree reaches , we start moving the tree forward in time including physical processes associated with the baryons within each dark matter halo that include gas cooling, star-formation, supernova feedback, reionization and merging of galaxies on a dynamical friction time-scale. In this Letter, we will omit including detailed prescriptions for AGN-feedback (e.g. Schawinski et al., 2006) or environmental effects (Khochfar & Ostriker, 2008).
In our modeling approach, we try to include the cold and hot accretion modes by first assigning the fraction of gas within the halo, that is in a cold accretion flow. If is the mass of gas within the halo, then we can readily calculate the amount of gas in the hot phase as . We use an approximate fit to the fraction of cold accreted material as shown in Fig. 3 of Kereš et al. (2009) and the bottom part of Fig. 4 in Ocvirk et al. (2008). Please note that the results of Kereš et al. (2009) indicate a mild evolution with redshift in this relation, which we for the sake of simplicity neglect in this study. Throughout this work we will use , with a lower and upper floor of and for halos greater M⊙ and less M⊙, respectively. In a second step, we then calculate the cold and hot mode accretion onto the galaxy via and , respectively. Part of the underlying assumption is that cold accretion flows will reach the galaxy on a halo dynamical time , and that the hot accretion rate will be governed by the radiatively cooling time using recipes laid out as in e.g. Springel et al. (2001). We find in general that cold accretion clearly dominates over hot accretion in agreement with results of numerical simulations (e.g. Dekel et al., 2009; Kereš et al., 2009). The accretion rate of gas onto the disk of the central galaxy is then approximated as . This choice of accretion rate is the simplest possibility and shows results in agreement with those from hydrodynamical simulations presented by Dekel et al. (2009).
Star formation is modeled following the Schmidt-Kennicutt-law (Kennicutt, 1998) with a porosity-based prescription for the multiphase structure of the ISM (Silk, 2001). Momentum balance yields a star formation efficiency km s km s M erg (Silk, 2005). The dependence arises because of the enhancement in star formation efficiency via momentum input from supernova remnants with increasing ambient turbulent pressure. Note that gas accretion also drives gas turbulence, as in our model. Momentum input is only effective once the remnant expansion speed has slowed to below Here is the gas velocity dispersion, is the IMF-dependent mass in stars formed for each type II supernovae, the energy released by each supernova and the shell velocity at which strong radiative energy losses set in. We set km s-1 and use a Chabrier IMF with M⊙ throughout this paper. To calculate the gas velocity dispersion in the disk, we assume equilibrium between the rate at which energy is dissipated in the disk and energy added due to kinetic energy of infalling gas and supernovae. Including the dependence of the star formation rate predicted by the porosity model, this leads to . The free parameter allows to adjust for our ignorance with respect to the actual fraction of the kinetic energy being used to drive turbulence and the relation between the dissipation time-scale and dynamical time of the disk. is set to match the observed relation between and of galaxies at . The constant km s-1 is set to ensure that in the limiting case of no accretion, the local observed velocity dispersion in disks is recovered. Simulations show that cold accretion comes in along filaments on almost radially orbits before hitting the galactic disk (Ocvirk et al., 2008), thus being able to contribute a large fraction of the gas kinetic energy to the heating of the gaseous disk, in contrast to hot-mode accreted material that settles more gradually onto the disk.
In this study, we simulate a volume of Mpc3, and use the following set of cosmological parameters derived from a combination of the 5-year WMAP data with Type Ia supernovae and measurements of baryon acoustic oscillations (Komatsu et al., 2008): , , , and .
3. Low Disk Galaxies
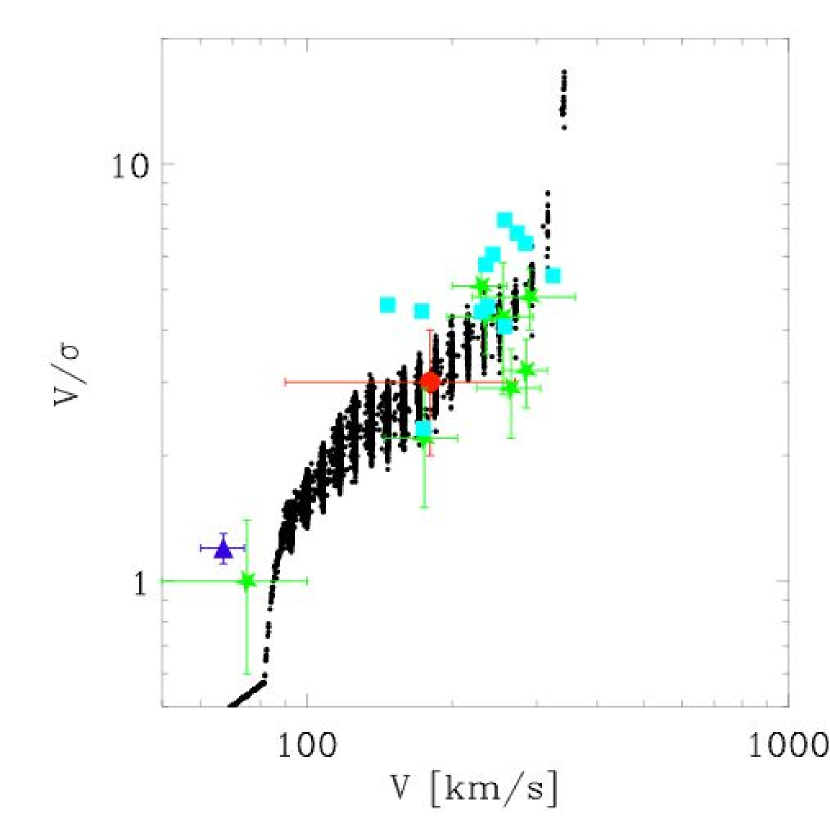
We start by investigating the increase in gas velocity dispersion in gaseous disks due to cold accretion. Fig. 1 shows the correlation between and . In general only of the accretion energy is sufficient to drive turbulence that agrees with the range of observed values (Genzel et al., 2006, 2008; Stark et al., 2008). It is interesting to note that this value is in agreement with recent theoretical predictions by Dekel et al. (2009). Cold accretion-driven turbulence in galaxies living in small dark matter halos with km s-1 results in velocity dispersions similar to or larger than the rotational velocity, mainly because of the high accretion rates and the low gas masses in the disks to absorb the associated accretion energy. These galaxies are dynamically hot system that are pressure-supported against gravitational collapse in contrast to classical cold disks. More massive galaxies with larger typically live in massive halos which only have small fractions of cold accretion via filaments and massive gaseous disks that are not easily heated. The steep transition from low to high reflects the steep decline of cold accretion flows as a function of dark halo mass that we have adopted based on simulations. The scatter seen in the plot is largely due to the varying accretion histories of individual halos.
4. Star Formation Rates and Mass Function
The inclusion of explicit cold accretion in the SAM increases the overall accretion rate onto model galaxies. This might suggest that the star formation rates will increase as well. However, using a constant star formation efficiency normalized to the locally observed value of the number density of star forming galaxies with M⊙ yr-1 falls short by almost an order of magnitude in agreement with previous reports by D07 and (Davé, 2008). Fueling of the galaxies with gas is not the limiting factor for high star formation rates. Rather, it is the conversion of gas into stars over a short time-scale. The porosity-based model for star formation predicts that star formation efficiency scales as , thus providing a natural way to increase the star formation rate with redshift in parallel with the cold gas accretion rate.
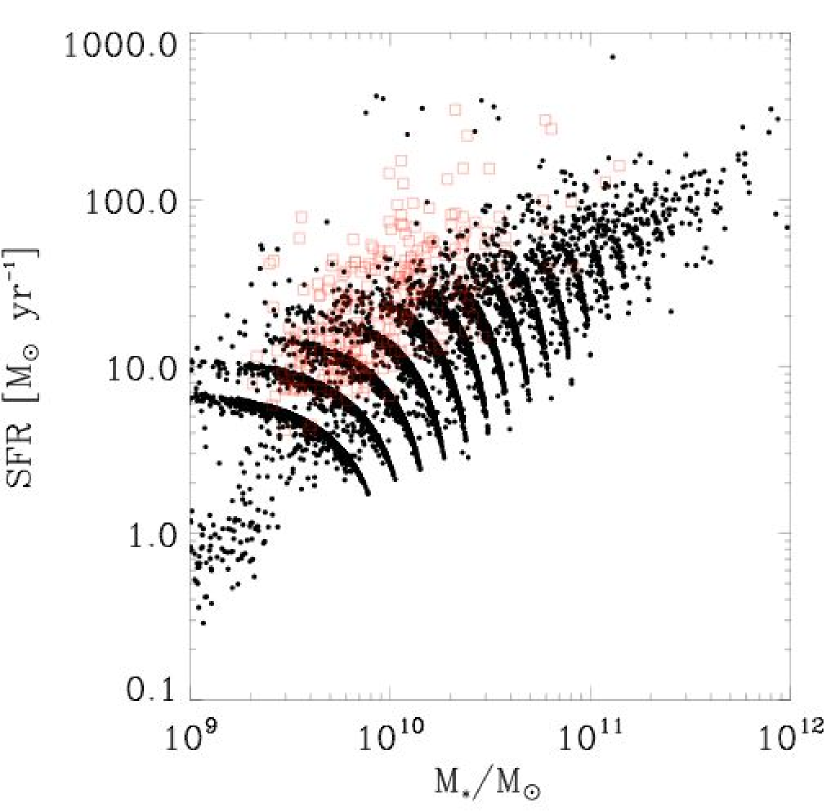
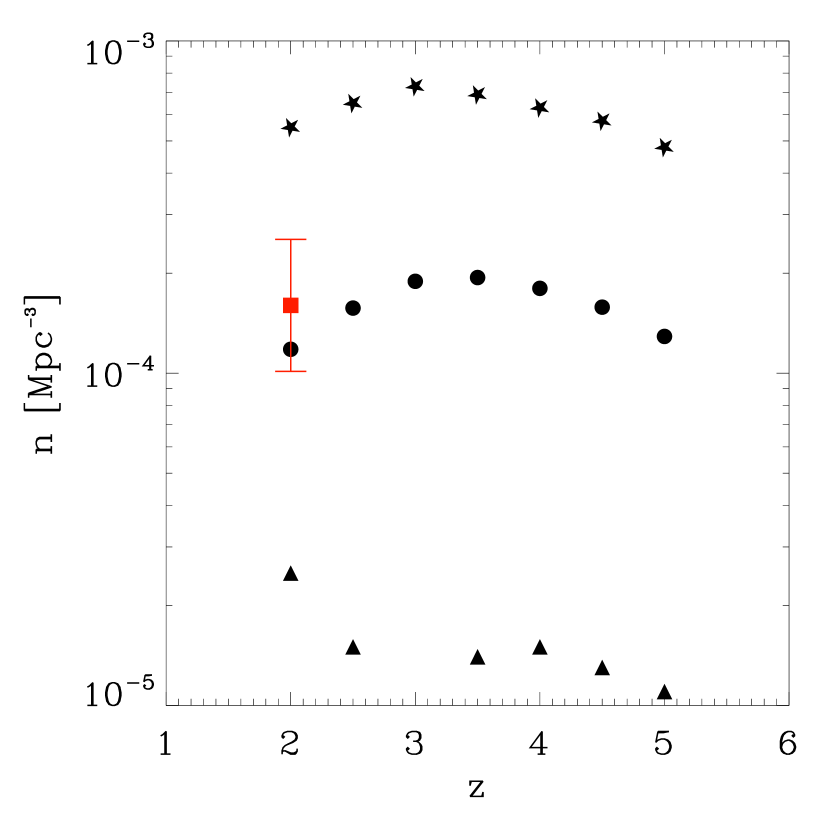
In Fig. 2, we present the SFR- relation for central galaxies at . The model galaxies cover most of the observed range. However, we find that the slope is slightly tilted. Mostly massive model galaxies have too low star formation rates. Inspection of the D07 data reveals that the statistics at the massive end is rather poor and that a possible flattening at high masses as seen in our models cannot be ruled out. It is interesting to note that the modeled SFR relation at lies perfectly on the region covered by the observed galaxies. The number density of star-forming galaxies with M⊙ yr-1 at is Mpc-3 and within a factor two of the observed density of in D07. Again our estimates for are in excellent agreement with the results of D07 at . The number density of star-forming galaxies increases by a factor two to and then starts to drop again (see Fig. 3). Dekel et al. (2009) find in their simulation a similar increase in the number density of galaxies accreting gas with M⊙ yr-1 going from to . However, their overall number densities are larger by a factor or more. Also do they not find a peak around as we do, but a steady decline in the number density of systems accreting with high rates.
As we are not generating light cones to compare with the observations, but use redshift slices, we need to ask the question whether the ULIRG sub-sample of D07 is biased toward within the overall sample which spans the range . Inspecting their Fig. 6, we find that galaxies with L L⊙ span a wide range in redshift between and with brighter galaxies preferably being at , suggesting that we are underestimating number densities because we neglect the contribution. Taking this into account, the difference with D07 should be even less than a factor of two.
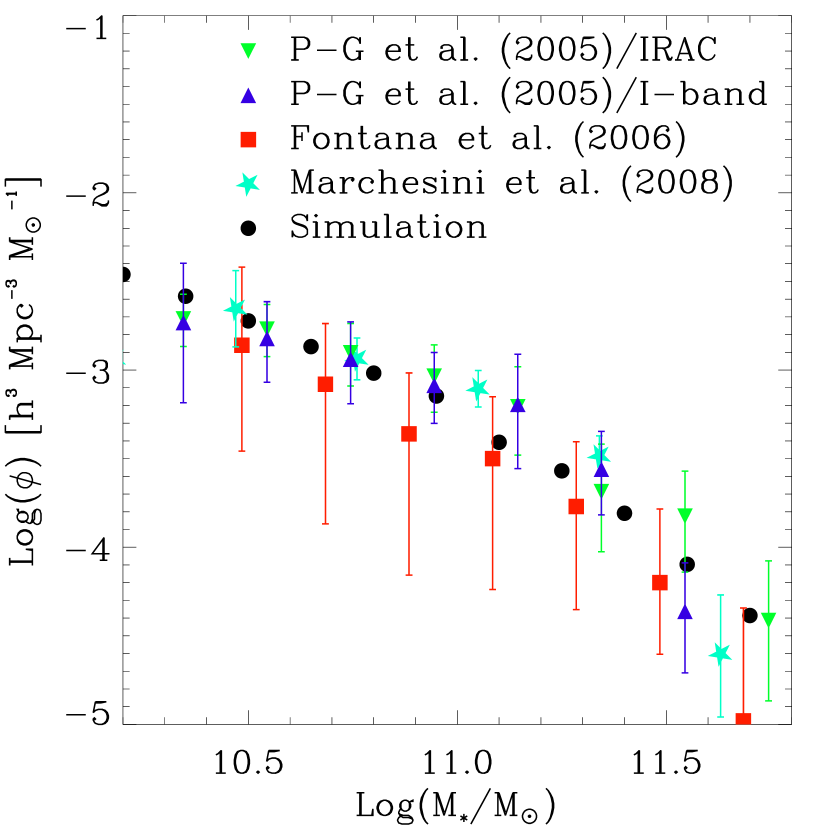
Finally, we turn to the overall mass function of galaxies at , shown in Fig. 4. One might expect that due to the enhancement of early star formation in the revised model, basic properties like the mass function will change significantly. However, good agreement is found between the modeled mass function and those based on Spitzer observations by Pérez-González et al. (2005) and a recent study by Marchesini et al. (2008). The GOODS-MUSIC results of Fontana et al. (2006) are a bit lower, but agree within their error margin.
5. Conclusions
We have investigated a possible scenario for the formation of galaxies at high redshifts that is driven mainly by cold accretion flows. Massive galaxies at live in halos that are at the intersections of filaments that form the cosmic web. As shown in numerical simulations, these filaments provide a steady stream of dense cold gas that can reach the galaxy on a free-fall time scale and fuel ongoing star formation. Not only do these streams provide cold gas, but they can also drive turbulence in the gaseous disk by depositing some fraction of the accretion energy into the ISM. We find that between of this accretion energy is sufficient to increase the gas velocity dispersion to observed values. In particular we choose , which still leaves accretion driven turbulence dominant with respect to supernovae driven one. A natural consequence of cold accretion driving turbulence is that it becomes less important in massive halos and at low redshifts,
where the fraction of cold mode accretion drops and increases. Low redshift observations find velocity dispersions of 10 km s-1, much lower than those at . This can be understood as a natural consequence of the steady demise of cold accretion with redshift in halos that host disk galaxies today. The host halos of these galaxies live no longer at the intersection of filaments, but in the filaments itself. Those galaxies living in halos above the critical dark matter mass for stable shocks (Dekel & Birnboim, 2006) will no longer accrete from cold flows, but from hot halo gas, if at all, that radiatively cools and the main driver of turbulence will be supernovae. Such a picture does fit in nicely with observation of low redshift disk galaxies, which have much larger than their high- counter parts (Kassin et al., 2007).
Only increasing the amount of available fuel due to cold accretion is not enough to increase the number density of galaxies with large star formation rates. It is necessary to also increase the star formation efficiency at the same time. We
tested an analytic model for a multiphase ISM that is based on a porosity
prescription, that has been shown to capture some of the relevant physical mechanism related to star formation seen in high-resolution simulations (Slyz et al., 2005). The star formation efficiency in this model is
, resulting in an increasing efficiency that parallels the gas supply by cold accretion and allows to convert it into stars on a very short
time-scale. With this model we find improved agreement with the observed number density of star-forming galaxies. However our predicted star formation rates are lower than in the observed sample especially for the more massive galaxies. We have two comments on this point. Firstly, the data are most likely biased to high star formation rates. Secondly, galaxies with high star-forming rates at high redshift commonly show weak AGN activity (see for example a recent study of a sample of ULIRGs (Huang et al., 2009) ). This most likely is the tip of the AGN iceberg because of possible obscured AGN. AGN outflows could trigger as well as play the more accepted role of quenching star formation at high redshift.
It remains to be investigated how well the agreement at different redshifts is, and we plan on addressing this in a future paper.
We would like to thank the referee Avishai Dekel for his very helpful comments that helped improve the manuscript, Andreas Burkert and the SINS team for useful discussions, and Emanuele Daddi as well as Giovanni Cresci for kindly providing their observational data.
References
- Birnboim & Dekel (2003) Birnboim, Y., & Dekel, A. 2003, MNRAS, 345, 349
- Caputi et al. (2006) Caputi, K. I., et al. 2006, ApJ, 637, 727
- Daddi et al. (2004) Daddi, E., Cimatti, A., Renzini, A., Fontana, A., Mignoli, M., Pozzetti, L., Tozzi, P., & Zamorani, G. 2004, ApJ, 617, 746
- Daddi et al. (2007) Daddi, E., et al. 2007, ApJ, 670, 156
- Davé (2008) Davé, R. 2008, MNRAS, 385, 147
- Dekel & Birnboim (2006) Dekel, A., & Birnboim, Y. 2006, MNRAS, 368, 2
- Dekel et al. (2009) Dekel, A., et al. 2009, Nature, 457, 451
- Dekel et al. (2009) Dekel, A., Sari, R., & Ceverino, D. 2009, arXiv:0901.2458
- Fontana et al. (2006) Fontana, A., et al. 2006, A&A, 459, 745
- Förster Schreiber et al. (2006) Förster Schreiber, N. M., et al. 2006, ApJ, 645, 1062
- Genzel et al. (2008) Genel, S., et al. 2008, ApJ, 688, 789
- Genzel et al. (2006) Genzel, R., et al. 2006, Nature, 442, 786
- Genzel et al. (2008) Genzel, R., et al. 2008, ApJ, 687, 59
- Hasinger et al. (2005) Hasinger, G., Miyaji, T., & Schmidt, M. 2005, A&A, 441, 417
- Hopkins (2004) Hopkins, A. M. 2004, ApJ, 615, 209
- Huang et al. (2009) Huang, J-S et al. 2009, arXiv:0904.4479
- Kennicutt (1998) Kennicutt, R. C., Jr. 1998, ApJ, 498, 541
- Kassin et al. (2007) Kassin, S. A., et al. 2007, ApJ, 660, L35
- Kereš et al. (2005) Kereš, D., Katz, N., Weinberg, D. H., & Davé, R. 2005, MNRAS, 363, 2
- Kereš et al. (2009) Kereš, D., Katz, N., Fardal, M., Davé, R., & Weinberg, D. H. 2009, MNRAS, 395, 160
- Khochfar & Burkert (2005) Khochfar, S., & Burkert, A. 2005, MNRAS, 359, 1379
- Khochfar & Silk (2006) Khochfar, S., & Silk, J. 2006, MNRAS, 370, 902
- Khochfar & Ostriker (2008) Khochfar, S., & Ostriker, J. P. 2008, ApJ, 680, 54
- Komatsu et al. (2008) Komatsu, E., et al. 2008, arXiv:0803.0547
- Kong et al. (2006) Kong, X., et al. 2006, ApJ, 638, 72
- Marchesini et al. (2008) Marchesini, D., van Dokkum, P. G., Forster Schreiber, N. M., Franx, M., Labbe’, I., & Wuyts, S. 2008, arXiv:0811.1773
- Maiolino et al. (2008) Maiolino, R., et al. 2008, A&A, 488, 463
- Noeske et al. (2007) Noeske, K. G., et al. 2007, ApJ, 660, L43
- Ocvirk et al. (2008) Ocvirk, P., Pichon, C., & Teyssier, R. 2008, MNRAS, 390, 1326
- Pérez-González et al. (2005) Pérez-González, P. G., et al. 2005, ApJ, 630, 82
- Pérez-González et al. (2008) Pérez-González, P. G., et al. 2008, ApJ, 675, 234
- Schawinski et al. (2006) Schawinski, K., et al. 2006, Nature, 442, 888
- Slyz et al. (2005) Slyz, A. D., Devriendt, J. E. G., Bryan, G., & Silk, J. 2005, MNRAS, 356, 737
- Silk (2001) Silk, J. 2001, MNRAS, 324, 313
- Silk (2005) Silk, J. 2005, MNRAS, 364, 1337
- Springel et al. (2001) Springel, V., White, S. D. M., Tormen, G., & Kauffmann, G. 2001, MNRAS, 328, 726
- Stark et al. (2008) Stark, D. P., Swinbank, A. M., Ellis, R. S., Dye, S., Smail, I. R., & Richard, J. 2008, Nature, 455, 775
- Steidel et al. (2004) Steidel, C. C., Shapley, A. E., Pettini, M., Adelberger, K. L., Erb, D. K., Reddy, N. A., & Hunt, M. P. 2004, ApJ, 604, 534
- Somerville & Kolatt (1999) Somerville, R. S., & Kolatt, T. S. 1999, MNRAS, 305, 1
- Thomas et al. (2005) Thomas, D., Maraston, C., Bender, R., & Mendes de Oliveira, C. 2005, ApJ, 621, 673