The role of static disorder in negative thermal expansion in ReO3
Abstract
Time-of-flight neutron powder diffraction and specific heat measurements were used to study the nature of thermal expansion in rhenium trioxide, an electrically conducting oxide with cubic symmetry. The temperature evolution of the lattice parameters show that ReO3 can exhibit negative thermal expansion at low temperatures and that the transition from negative to positive thermal expansion depends on sample preparation; the single crystal sample demonstrated the highest transition temperature, 300 K, and largest negative value for the coefficient of thermal expansion, K -1. For the oxygen atoms, the atomic displacement parameters are strongly anisotropic even at 15 K, indicative of a large contribution of static disorder to the displacement parameters. Further inspection of the temperature evolution of the oxygen displacement parameters for different samples reveals that the static disorder contribution is greater for the samples with diminished NTE behavior. In addition, specific heat measurements show that ReO3 lacks the low energy Einstein-type modes seen in other negative thermal expansion oxides such as ZrW2O8.
I Introduction
Metals that contract upon heating are exceedingly rare, if they exist at all. This observation can be understood by considering the types of cohesive interactions bonding atoms into solids. As a material is heated, interatomic distances expand due to the asymmetric shape of the potential energy well and therefore to anharmonic effects.Kittel (2005); Sleight (1998a) A chemical bond with a deeper potential well will confine atomic vibrations to remain more harmonic and consequently, covalently bonded materials such as diamond exhibit lower thermal expansion than metals such as copper. In some covalent crystals with open framework structures, the low thermal expansion can even become negative. Among the negative thermal expansion (NTE) materials most studied are framework oxides such as ZrW2O8Mary et al. (1996); Evans et al. (1997); Ernst et al. (1998) and more recently metal cyanide frameworks such as Zn(CN)2,Goodwin and Kepert (2005); Chapman et al. (2006) all of which are electrical insulators or semiconductors. In contrast, the oxide ReO3 is a superb electrical conductor with a room temperature resistivity close to that of copper.Ferretti et al. (1965); King et al. (1971) Recently, Chatterji et al. have demonstrated through neutron powder diffraction and first-principles calculations that ReO3 also exhibits isotropic NTE,Chatterji et al. (2008) making it the only known simple binary oxide to combine metallic conductivity with NTE.
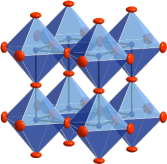
A topological feature that can lead to NTE behavior in an open framework structure is a linear chain consisting of a ligand coordinated to two metals or vice versa.Sleight (1998a, b) For example, simple binary oxides such as Cu2O, Ag2O (O–M–O chains)Mittal et al. (2007)and certain phases of SiO2 (Si–O–Si chains)Attfield and Sleight (1998); Lightfoot et al. (2001) demonstrate NTE behavior. While this is not a requisite for NTE behavior (magnetostriction and phase transitions can also result in NTE), it is a simple principle by which new NTE materials can be pursued. The structure of rhenium trioxide contains such linear chains in a three dimensional framework consisting of corner-sharing ReO6 octahedra (See Fig. 1). The simple ReO3 structure is a prototype for closely related materials such as the perovskite ferroelectrics, ferromagnets, and high Tc superconductors and can also be thought of as the cubic perovskite ABO3 with a void in the place of the cation.
Thermal expansion investigations of ReO3 have presented conflicting results. A laser interferometry study on a single crystal concluded that ReO3 displayed NTE between 100 K and 340 K,Matsuno et al. (1978). In contrast to the single crystal work, a catalogue of powder X-ray diffraction (XRD) studies reported the coefficient of thermal expansion of ReO3 to be small but positive for all temperature ranges.Taylor (1985) The latter study has been more frequently cited in reviews of NTE in oxide frameworks,Sleight (1998a); Tao and Sleight (2003) leaving ReO3 largely unrecognized as a potential NTE material until the recent article by Chatterji et al, which showed through diffraction studies NTE up to 200 K.Chatterji et al. (2008) In the present study, we show that ReO3 can exhibit isotropic NTE up to room temperature, that the positive to negative transition is dependent on sample quality, and that specific heat measurements show a lack of any low energy Einstein-type modes that lead to the NTE behavior in other oxides. Furthermore, we show through careful analysis of the atomic displacement parameters the role of static disorder of the oxygen atoms in impeding NTE behavior and therefore explain the discrepancy between past thermal expansion studies of ReO3.
II Experimental Methods
The thermal expansion properties of various ReO3 powder samples were investigated by performing variable temperature neutron powder diffraction (NPD) with time-of-flight neutron data. The first sample investigated, labeled ReO3-a throughout this paper, was a powder prepared by the decomposition of an Re2O7–1,4 dioxane adduct at 140 ∘C as first described by Nechamkin et al.Nechamkin et al. (1951) The second sample studied, ReO3-b, was a powder purchased from Alfa Aesar (99.99% chemical purity). Finally, the third sample, ReO3-c, was prepared by crushing single crystals of ReO3 grown by chemical vapor transport (CVT). By using HgCl2 as the transport agent in an evacuated Pyrex glass ampoule with ReO3 powder (ReO3-b as the starting powder), the crystals were grown across a temperature gradient of about 100 ∘C as described by Feller et al.Feller et al. (1998). In addition to growing single crystals, CVT also separates the lower oxide phase impurities from the freshly grown ReO3 crystals. Hence, sample ReO3-c was expected to be of higher chemical and phase purity than the others.
NPD patterns were obtained on the high intensity powder diffractometer (HIPD) at the Lujan Neutron Scattering Center at the Los Alamos Neutron Science Center (LANSCE). HIPD is suitable for studying the behavior of materials as a function of temperature and pressure due to its relatively high data acquisition rates. HIPD data were collected on all samples between 15 K and 300 K. The Lujan Center employs a pulsed spallation neutron source, so the NPD histograms were collected in time-of-flight mode on fixed detector banks. The backscattering detector banks, located with respect to the incident beam, provide the highest resolution pattern and higher-index reflections while the normal () and forward scattering () banks have a lower resolution but probe higher -spacings. In the study by Chatterji et al., the neutron diffraction measurements were performed on a constant wavelength source ( Å),Chatterji et al. (2008) limiting the diffractogram up to Å-1 in momentum transfer . More accurate structural parameters such as atomic displacement parameters can be accessed with time-of-flight neutron data since higher ranges can be probed. In our measurements, a of Å-1 was used for all the structural refinements.
The specific heat data were collected upon warming from 2 K to 20 K on a 28.5 mg single crystal using a quasiadiabatic method as implemented on a Quantum Design Physical Property Measurement System (PPMS). Like sample ReO3-c, the single crystal was grown by CVT.
III Results and Discussion
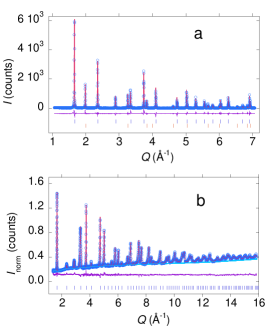
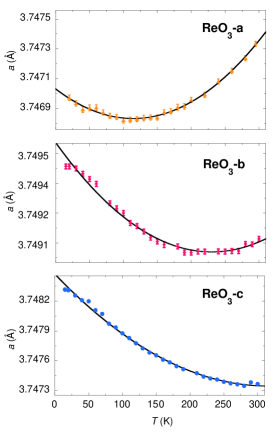
Least squares structural refinements by the Rietveld method were performed with all six histograms of the NPD data using the GSAS software package.Larson and Von Dreele (2004) In space group , only four variables were refined for each temperature: the lattice parameter; the isotropic displacement parameter of Re, and the anisotropic displacement parameters (), and of O. To determine the lattice parameters of the sample accurately, X-ray powder diffraction was performed at room temperature with Si Standard Reference Material 640c purchased from National Institute of Standards (See Fig. 2a). The neutron powder profile for the sample prepared from single crystals, ReO3-c, is shown in Fig. 2b. In this sample, the lattice parameter plotted as a function of temperature clearly demonstrates NTE behavior from 15 K up to 300 K (See Fig. 3c). NTE in the other powder samples was indeed observed but limited to a narrower temperature range (See Fig. 3a,b). For sample ReO3-a, the NTE behavior was observed only up to 110 K, and for ReO3-b, only up to 220 K. Clearly sample quality has an effect on the thermal expansion properties and this may, in part, explain the discrepancy between past findings on the thermal expansion behavior of ReO3 and the reason why Chatterji et al. found NTE only up to 200 K from their neutron measurements while their dynamical lattice calculations predicted NTE up to 350 K.Chatterji et al. (2008)
The linear coefficient of thermal expansion for a cubic system is defined as where is the cubic cell parameter and the temperature. A least squares polynomial fit (second-order) to the lattice parameters obtained from the neutron data affords , which can be differentiated with respect to and divided by the experimental values of to obtain as a function of . For sample ReO3-c the average below 300 K was found to be K-1. For sample ReO3-a, was found to be K-1, and K-1 for sample ReO3-b. Thus, lowering of the transition temperature is correlated with a smaller, negative value for .
For sample ReO3-c, the values for are close to those determined by Matsuno et al. in their interferometry study on single crystals where the value of is K-1 at about 120 K and slowly rises to K-1 at about 230 K.Matsuno et al. (1978) While we did not make measurements above room temperature, Matsuno et al. found to be positive and smaller than K-1 between 340 K and 500 K.Matsuno et al. (1978) In an XRD study carried out on single crystals as well as powder samples, Chang et al. found a value of K-1 above room temperature.Chang and Trucano (1978) The volumetric calculated by Chatterji et al. is not linear as in our simplified model from the fitted curves, but nevertheless shows a volumetric ( linear ) varying between to zero below 350 K.Chatterji et al. (2008)
The atomic displacement parameters obtained from the NPD data offer some clues as to the mechanism responsible for NTE in ReO3. Due to the high range of momentum transfer available from time-of-flight neutrons as well as the lack of any decay with in the atomic form factors for neutron diffraction, accurate atomic displacement parameters were obtained from the Rietveld analysis (See Fig. 4a). The Re atom is located on the special position (site symmetry ), which constrains the atomic displacement parameter to remain isotropic. The oxygen atoms are located on the position (site symmetry ), constraining them to have only two values, () and . While the displacement of the O atoms along the Re–O–Re direction remains fairly constant, the transverse motion increases upon heating, as also observed by Chatterji et al.Chatterji et al. (2008) The most striking feature is the gap between () and as represented by the flatness of the displacement ellipsoids of the O atoms (See Fig. 1). The anisotropy only increases with temperature, suggesting that the transverse motion contracts the cubic lattice upon heating and is therefore the most likely mechanism for the observed NTE behavior.
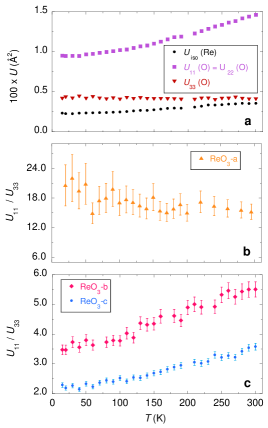
Further inspection of the oyxgen displacement parameters of all three samples reveals differences that may explain the varying thermal expansion behavior. Though sometimes loosely referred to as thermal parameters or Debye-Waller factors, the values for have contributions from both dynamic and static displacements of the atoms. Extrapolation of the parameters for ReO3 down to 0 K reveals non-zero values, which indicates significant contribution from static displacement, especially in the case of (See Fig. 4a). The large gap between and at low temperatures was observed for all three samples. A useful parameter to describe the extent of anisotropy in the atomic displacements is the ratio of the maximum value to the minimum value of ;Trueblood et al. (1996) in our case, it is /. When plotted versus temperature (See Fig. 4b,c), this measure of anisotropy reveals that it is constant (within the error bars) and large for sample ReO3-a, while it is increases upon heating for ReO3-b and ReO3-c. Most importantly, the higher / ratios for ReO3-a and ReO3-b than for ReO3-c at low temperatures suggest more static disorder in the first two, which should affect the lattice dynamical properties. The mode calculated by Chatterji et al involves rotation of the ReO6 octahedra in the plane and arises from transverse motion of the O atoms in this plane.Chatterji et al. (2008) Since the mode has the largest contribution to the negative value for at low temperatures, static displacement of the O atoms, transversely from the Re–O–Re bond, would diminish the NTE behavior.
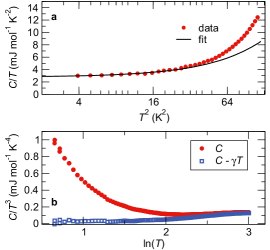
Specific heat measurements on a single crystal of ReO3 were carried out to understand the type of lattice vibrations contributing to the specific heat. The low temperature behavior in the heat capacity of ReO3 is that of a straightforward Debye solid, with a Debye temperature of 344 K and a Sommerfeld coefficient of 2.8 mJ mol-1 K-2 (See Fig. 5a). These values agree very well with the values of 327 K for and 2.85 mJ mol-1 K-2 for found in the early studies by King et al.King et al. (1971) Fig. 5b shows the specific heat over vs. , which is an approximate representation of the one-dimensional phonon density of states of a solid.Ramirez and Kowach (1998); Junod et al. (1983) A signature of an Einstein mode in this representation is a Gaussian-like peak–clearly missing in the low temperature region of the specific heat. These measurements strengthen the argument by Chatterji et al. from their lattice dynamical calculations that NTE in ReO3 is caused by low energy acoustic modes with the mode contributing the most to the NTE behavior.Chatterji et al. (2008) Also, the specific heat results rule out the suggestion by Matsuno et al. that a low energy, bending-like optical mode is responsible for NTE in ReO3.Matsuno et al. (1978)
Although both ZrW2O8 and ReO3 have cubic symmetry, it is interesting to compare how their structures lead do different NTE behavior. The primitive cubic structure of ReO3 (given the absence of the cation in its structure and thus an extremal value of the perovskite tolerance factor) is of course the consequence of metallicity: the large volume is maintained by the Fermi pressure of the delocalized d-electrons in the conduction band. Nevertheless, the proximity to a ‘buckling transition’ is revealed by a pressure-induced collapse of the structure produced by cooperative counter-rotation of the octahedra,Jørgensen et al. (2000); Batlogg et al. (1984) in this case very similar to ZrW2O8.Jorgensen et al. (1999); Pantea et al. (2006) The linear obtained for ReO3 is smaller than that observed in ZrW2O8, where K-1. Indeed, the smaller absolute value of the NTE and the smaller temperature range at which it occurs in ReO3 compared to ZrW2O8 is consistent with the much weaker precursor effects in the pressure-induced collapse in the former than in the latter.Pantea et al. (2006) In turn, the weakness of the fluctuations in ReO3 is possibly a consequence of it possessing fewer soft degrees of freedom than the more open framework structure of ZrW2O8. In addition, the low energy Einstein-type modes observed in ZrW2O8 and implicated in that material’s NTE behavior,Ernst et al. (1998); Ramirez and Kowach (1998) are clearly missing in ReO3.
The relatively small NTE effect observed in ReO3 remains, nevertheless, remarkable because it is isotropic and unprecedented for a material with the electronic properties of a simple metal. While classifying an oxide as a simple metal is atypical, the free-electron model works well enough in ReO3 that it qualifies under the scheme of electrical transport properties (other examples include the NaxWO3 bronzes and RuO2).Cox (1992) Most simple metals have a much larger than that of ReO3. For example, for copper, is K-1 at room temperature.Lide (2008) Another notable exception is the intermetallic YGaGe, which has such small that its behavior has been termed zero thermal expansion.Salvador et al. (2003) Like YGaGe, ReO3 is also remarkable in that its above room temperature is as low as in a highly covalent material like diamond where is K-1.Chang and Trucano (1978) While ReO3 does exhibit highly metallic behavior, the strong covalency between the Re d-states and O p-states and its unique framework topology allow for negative thermal expansion, demonstrating the propensity for transition metal oxides to challenge our conventions on bonding and properties in solid materials. Furthermore, ReO3’s relatively simple structure has provided a way to quantify the role of static disorder of the oxygen atoms on interesting behavior such as negative thermal expansion.
IV Acknowledgements
This work has benefited from the use of HIPD at the Lujan Center at Los Alamos Neutron Science Center, funded by DOE Office of Basic Energy Sciences. Los Alamos National Laboratory is operated by Los Alamos National Security LLC under DOE Contract DE-AC52-06NA25396. We would also like to thank J. C. Lashley and A. Lawson from Los Alamos for stimulating discussions and L. L. Daeman, also from Los Alamos, for help with sample preparation. BCM and RS acknowledge the National Science Foundation for support through a Career Award (NSF-DMR-0449354), and for the use of MRSEC facilities (Award NSF-DMR0520415).
References
- Kittel (2005) C. Kittel, Introduction to Solid State Physics (Wiley, 2005), 8th ed.
- Sleight (1998a) A. W. Sleight, Inorg. Chem. 37, 2854 (1998a).
- Mary et al. (1996) T. A. Mary, J. S. O. Evans, Z. Hu, T. Vogt, and A. W. Sleight, Science 272, 90 (1996).
- Evans et al. (1997) J. S. O. Evans, Z. Hu, J. D. Jorgensen, D. N. Argyriou, S. Short, and A. W. Sleight, Science 275, 61 (1997).
- Ernst et al. (1998) G. Ernst, C. Broholm, G. R. Kowach, and A. P. Ramirez, Nature 396, 147 (1998).
- Goodwin and Kepert (2005) A. L. Goodwin and C. J. Kepert, Phys. Rev. B 71, 140301 (2005).
- Chapman et al. (2006) K. W. Chapman, M. Hagen, C. J. Kepert, and P. Manuel, Physica B 385–386, 60 (2006).
- Ferretti et al. (1965) A. Ferretti, D. B. Rogers, and J. B. Goodenough, J. Phys. Chem. Sol. 26, 2007 (1965).
- King et al. (1971) C. N. King, H. C. Kirsch, and T. H. Geballe, Sol. State Comm. 9, 907 (1971).
- Chatterji et al. (2008) T. Chatterji, P. F. Henry, R. Mitall, and S. L. Chaplot, Phys. Rev. B 78, 134105 (2008).
- Sleight (1998b) A. W. Sleight, Annu. Rev. Mater. Sci. 28, 29 (1998b).
- Mittal et al. (2007) R. Mittal, S. L. Chaplot, S. K. Mishra, and P. P. Bose, Phys. Rev. B 75, 174303 (2007).
- Attfield and Sleight (1998) M. P. Attfield and A. W. Sleight, Chem. Comm. 5, 601 (1998).
- Lightfoot et al. (2001) P. Lightfoot, D. A. Woodcock, M. J. Maple, L. A. Villaescusa, and P. A. Wright, J. Mater. Chem. 11, 212 (2001).
- Matsuno et al. (1978) N. Matsuno, M. Yoshimi, S. Ohtake, T. Akahane, and N. Tsuda, J. Phys. Soc. Japan 45, 1542 (1978).
- Taylor (1985) D. Taylor, Br. Ceram. Trans. J. 84, 9 (1985).
- Tao and Sleight (2003) J. Z. Tao and A. W. Sleight, J. Sol. State Chem. 173, 442 (2003).
- Nechamkin et al. (1951) H. Nechamkin, A. N. Kurty, and C. F. Hiskey, J. Am. Chem. Soc. 73, 2829 (1951).
- Feller et al. (1998) J. Feller, H. Opermann, M. Binnewies, and E. Milke, Z. Naturforsch 53b, 184 (1998).
- Larson and Von Dreele (2004) A. C. Larson and R. B. Von Dreele, Tech. Rep., Los Alamos National Laboratory Report, LAUR 86-748 (2004).
- Chang and Trucano (1978) T.-S. Chang and P. Trucano, J. Appl. Cryst. 11, 286 (1978).
- Trueblood et al. (1996) K. N. Trueblood, H.-B. Bürgi, H. Burzlaff, J. D. Dunitz, C. M. Gramaccioli, H. H. Schulz, U. Shmueli, and S. C. Abrahams, Acta Cryst. A52, 770 (1996).
- Ramirez and Kowach (1998) A. P. Ramirez and G. R. Kowach, Phys. Rev. Lett. 80, 4903 (1998).
- Junod et al. (1983) A. Junod, T. Jarlborg, and J. Muller, Phys. Rev. B 27, 1569 (1983).
- Jørgensen et al. (2000) J.-E. Jørgensen, J. Staun Olsen, and L. Gerward, J. Appl. Cryst. 33, 279 (2000).
- Batlogg et al. (1984) B. Batlogg, R. G. Maines, and M. Greenblatt, Physica B 29, 3762 (1984).
- Jorgensen et al. (1999) J. D. Jorgensen, Z. Hu, T. S., D. N. Argyriou, S. Short, J. S. O. Evans, and A. W. Sleight, Phys. Rev. B 59, 215 (1999).
- Pantea et al. (2006) C. Pantea, A. Migliori, P. B. Littlewood, Y. Zhao, H. Ledbetter, J. C. Lashley, T. Kimura, J. Van Duijn, and G. R. Kowach, Phys. Rev. B 73, 214118 (2006).
- Cox (1992) P. A. Cox, Transition Metal Oxides: An Introduction to their Electronic Structure and Properties (Oxford University Press, New York, 1992).
- Lide (2008) D. R. Lide, ed., CRC Handbook of Chemistry and Physics (Taylor and Francis Group, Boca Raton, FL, USA, 2008), 88th ed.
- Salvador et al. (2003) J. R. Salvador, F. Guo, T. Hogan, and M. G. Kanatzidis, Nature 425, 702 (2003).