Detection of node group membership in networks with group overlap
Abstract
Most networks found in social and biochemical systems have modular structures. An important question prompted by the modularity of these networks is whether nodes can be said to belong to a single group. If they cannot, we would need to consider the role of “overlapping communities.” Despite some efforts in this direction, the problem of detecting overlapping groups remains unsolved because there is neither a formal definition of overlapping community, nor an ensemble of networks with which to test the performance of group detection algorithms when nodes can belong to more than one group. Here, we introduce an ensemble of networks with overlapping groups. We then apply three group identification methods—modularity maximization, k-clique percolation, and modularity-landscape surveying—to these networks. We find that the modularity-landscape surveying method is the only one able to detect heterogeneities in node memberships, and that those heterogeneities are only detectable when the overlap is small. Surprisingly, we find that the k-clique percolation method is unable to detect node membership for the overlapping case.
pacs:
89.75.FbStructures and organizations in complex systems1 Introduction
Real-world networks including man-made and natural networks are strongly modular, that is, the pattern of connections among nodes is not homogeneous newman04b ; guimera05 . The modularity of a network is a consequence of the fact that there are groups of nodes in the network that preferentially connect to one another newman04b ; guimera05 ; watts02 ; donetti04 ; guimera04 ; reichardt04 ; duch05 ; palla05 . However, the assignment of nodes into those groups still remains a challenging task because, typically, nodes also connect to nodes that are not in their group watts02 ; reichardt04 ; palla05 . Additionally, nodes may hold membership in more than one group reichardt04 ; palla05 ; baumes05 ; gfeller05 ; nepusz08 , resulting in groups that “overlap.”
The question of whether there are nodes that belong to more than one group and how important overlapping groups are to the network’s organization is especially relevant in social and biochemical systems, in which typically nodes are thought to belong to more than one group. Consider, for instance, the network of scientific collaborations within an institution: People with joint appointments would be expected to appear in more than one group. Or, consider the network of physical interactions between proteins: Topological modules are thought to have a strong correlation with biological function pereira-leal04 . Since many proteins are known to have more than one function, one would expect these proteins to belong to more than one group.
Recently, methods to uncover the hierarchical organization of networks sales-pardo07 ; clauset08 have been proposed, opening the possibility of performing multi-scale analysis on social, biological, and economical systems for which large amounts of data are available. However, a potential caveat of these methods is that they do not take into account the fact that nodes could hold membership in more than one group. Modularity maximization methods duch05 ; guimera05a ; newman06 , which have been successful at finding correlations between network function and structure, suffer from the same problem. The impact of neglecting overlapping groups has not been assessed so far, since there is neither a formal definition of overlapping group nor a set of models on which to test overlap identification algorithms.
Here, we introduce an ensemble of networks newman03h that have overlapping groups by construction nepusz08 . We then apply three different group detection methods—modularity maximization newman04b ; guimera05a , k-clique percolation palla05 , and modularity-landscape surveying sales-pardo07 —to these networks. We find that the modularity-landscape surveying method is the only one able to detect heterogeneities in node memberships, and that these heterogeneities are detectable provided the overlap is significantly smaller than the size of the modules involved.
2 Model networks
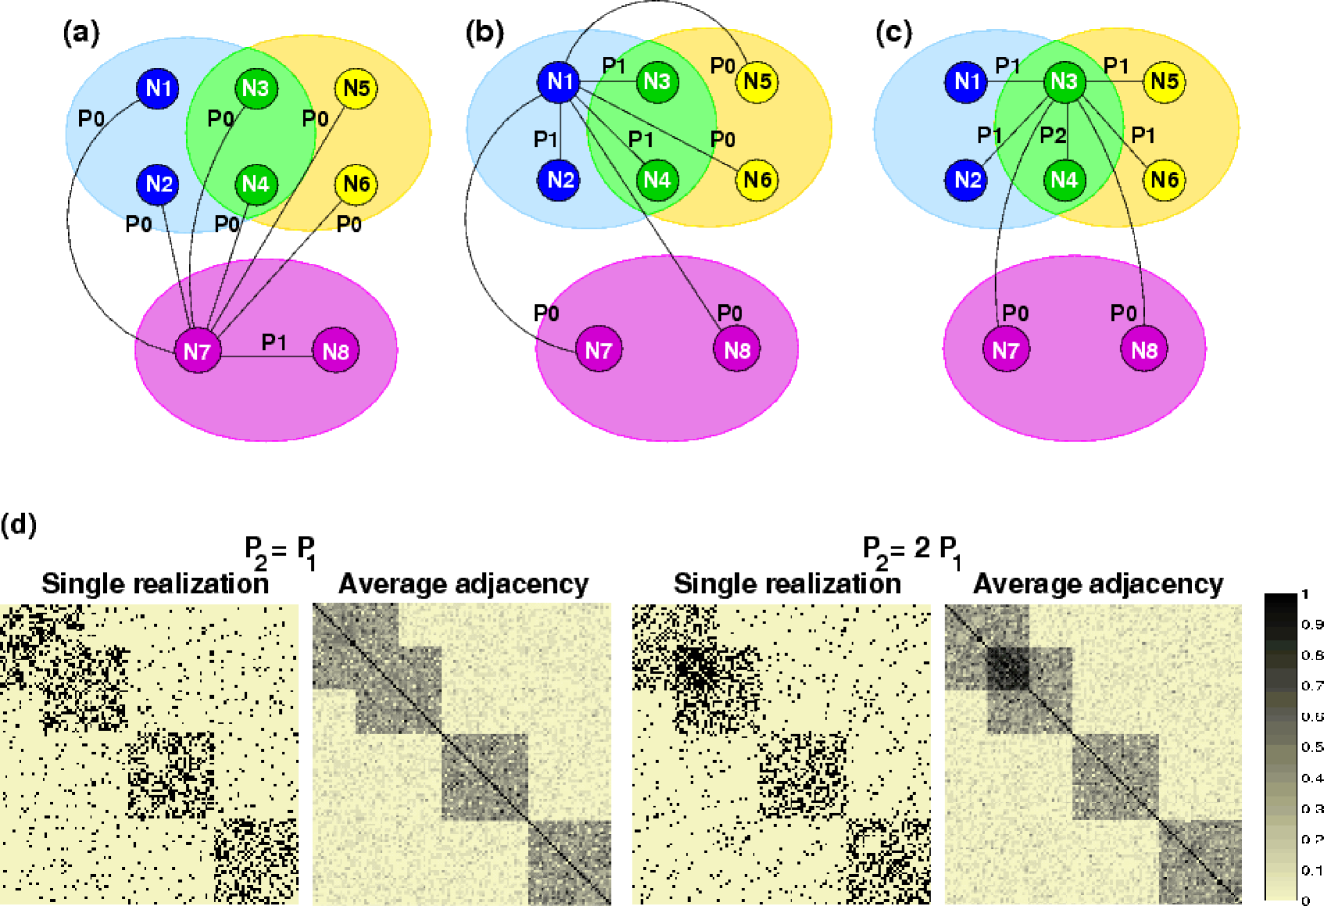
Consider a network comprised of nodes and edges. Let {} be the set of nodes and be the set of groups in which the nodes can hold membership. Specifically, let be the set of groups in which node holds membership. Without loss of generality, we assume that all groups with identical membership lists have been merged and that all groups have at least two members.
Here, we focus on the ensemble of random networks in which the probability of the edge being present in a network is a function solely of the set of co-memberships of the two nodes . We restrict our attention to the case where is a non-decreasing function of the cardinality of . For undirected networks, this is the most plausible case. Indeed, most clustering algorithms used to investigate the modular structure of networks have at their basis the assumption that this is the appropriate case. Such an assumption is supported by the fact that those methods return plausible results for those networks duch05 ; newman03h ; guimera05b ; hastings06 ; newman06b .
We consider the case where , where is the cardinality of , and, further, we assume that . An implication of our choice for is that if one selects a sub-set of in which all pairs of nodes have non-empty co-membership sets, then there will be more edges connecting these nodes than one would expect to find by chance. Or, in other words, we expect to find more edges connecting these nodes than if all links had the same probability of being present. In contrast, if one selects a sub-set of in which all pairs of nodes have empty co-membership sets, then there will be fewer edges connecting these nodes than one would expect to find by chance. These facts directly suggest that the maximization of a modularity function such as that proposed by Newman and Girvan newman04b will enable one to identify node membership in modular networks (see sales-pardo07 ; fortunato07 ; kumpula07 for caveats to this argument).
The ensemble of networks we focus on comprises two distinct sub-ensembles. The first sub-ensemble, which we denote transitive, conforms to a transitive relationship among co-membership sets. That is, if the co-membership set is non-empty and the co-membership set is also non-empty, then the co-membership set must also be non-empty. The second sub-ensemble, which we denote non-transitive, does not conform to a transitive relationship among co-membership sets.
Networks in the transitive sub-ensemble have the property that every node must hold membership in only one group (if identical groups have been collapsed). In contrast, networks in the non-transitive sub-ensemble have some nodes that hold membership in more than one group. Most module detection algorithms in the literature deal only with the transitive sub-ensemble duch05 ; guimera05a ; newman06b ; danon05 , that is, nodes are divided into “exclusive groups.” A notable exception is the work of Palla et al. palla05 , which highlights the possibility that a network will contain nodes belonging to more than one group, thus allowing for “overlapping communities.” Regretfully, Palla et al. palla05 do not define ensembles of networks with overlapping groups.
Another significant exception is the work of Sales-Pardo et al. sales-pardo07 , which determines community structure even when hierarchical levels of structure exist. These hierarchical levels of structure indicate that nodes may belong to more than one group, but only when multiple layers are considered. Here, we define an ensemble of networks in which most nodes hold membership in a single group, while a small fraction of nodes hold membership in two or three groups (Fig. 1).
3 Community detection
3.1 Description of the methods
Let us now address the question of detectability of the memberships of individual nodes. Ideally, one wishes to detect all group memberships from the topology of the network alone. For the case of transitive networks, it has already been shown that when , the probability that two nodes belonging to the same group are connected, is not much larger than , it is impossible to extract the correct membership assignment from the network structure alone guimera05a . Here, we focus on the detection of node membership for the ensemble of non-transitive networks described above. We consider three different classes of group detection algorithms: modularity maximization newman04b ; guimera05a , k-clique percolation palla05 , and modularity-landscape surveying sales-pardo07 .
Modularity maximization methods are the current “gold standard” for group identification danon05 . In this approach, nodes are classified into groups that maximize the number of within group edges compared to those that would be expected from chance alone newman04b ; guimera05 ; donetti04 ; guimera04 ; duch05 . Some of the proposed algorithms, such as spectral decomposition, are extremely fast and can handle networks comprised of hundreds of thousands of nodes duch05 . However, this approach is clearly geared toward networks with transitive membership structures since every node must be classified into a single group.
The k-clique percolation method introduced by Palla et al. palla05 is based on the observation that networks sometimes contain connected cliques of the same size palla05 . In this method, a group comprises chains of “adjacent” k-cliques—where two k-cliques are adjacent if they share nodes. A strength of this approach is that nodes can be classified into more than one group, making it a priori well-suited to investigate non-transitive networks. Two limitations of this this approach, however, are that different values of will result in different group membership patterns, and that sparse networks might contain a very small number of cliques with .
The modularity-landscape surveying method sales-pardo07 , or MLS, is based upon the observation that the modularity landscape is very rugged and has many local maxima, which means that there are many partitions of nodes into groups characterized by high values of the modularity function. In analogy to disordered physical systems whose landscapes are also rugged stillinger82 ; stillinger84 ; stillinger85 , one expects that the set of all local maxima conveys the relevant contribution to the system’s physical properties. Thus, the method samples all the partitions corresponding to local maxima with probabilities proportional to the size of their basins of attraction. Then, it builds a co-classification matrix , in which each element corresponds to the expected fraction of the time in which a pair of nodes is classified in the same group. As discussed above, this method does not restrict nodes to hold membership in a single group, but rather, by collecting statistics, it reports the likelihood that two nodes are members of the same group (or sets of groups), and therefore it is a priori suitable to identify node memberships in networks with both transitive and non-transitive memberships.
3.2 Random network ensembles
In order to investigate the detectability of the membership structure of a network, we generate random networks in which nodes can belong to five groups, . We consider the cases in which most of the nodes belong to a single group, , or , and the remaining nodes belong to two groups, , or to three groups, . We then assume that if two nodes have membership in the same group, they will be linked with probability . Similarly, if two nodes have membership in the same two groups, they will be connected with probability . Note that as approaches one, the harder it becomes to detect the co-membership structure of a network. Also, since some nodes belong to multiple groups, the degree of these overlapping nodes will be larger than that for a node belonging to only one group. Henceforth, we denote the average degree of a node belonging to only one group by .
If a node holds membership in only one group, say , then it belongs to group . If some nodes hold membership in two groups {}, then they belong to groups and . If the latter case is true, then groups and overlap. We define the “overlap size” as
| (1) |
that is, the number of nodes in both and divided by the combined size of groups and . Thus, an important issue regarding co-membership detection when nodes hold membership in more than one group is how the size of the overlap affects the accuracy in detecting group membership.
3.3 Mutual information
To quantify the similarity between two partitions of nodes, we calculate the mutual information between the two partitions danon05 :
| (2) |
where is the list of groups in the first partition, is the list of groups in the second partition, is the total number of nodes, is the number of nodes in group in the first partition, is the number of nodes in in the second partition, and is the number of nodes that are both in and . Note that this expression is symmetric; thus, it is an unbiased metric to compare the similarity of two partitions.
If the partitions are identical, , whereas if the two partitions are totally uncorrelated, . Note, however, that for the case in which each node is placed into a separate group, one has . We thus report , so that values of greater than zero indicate significant accuracy.
4 Results
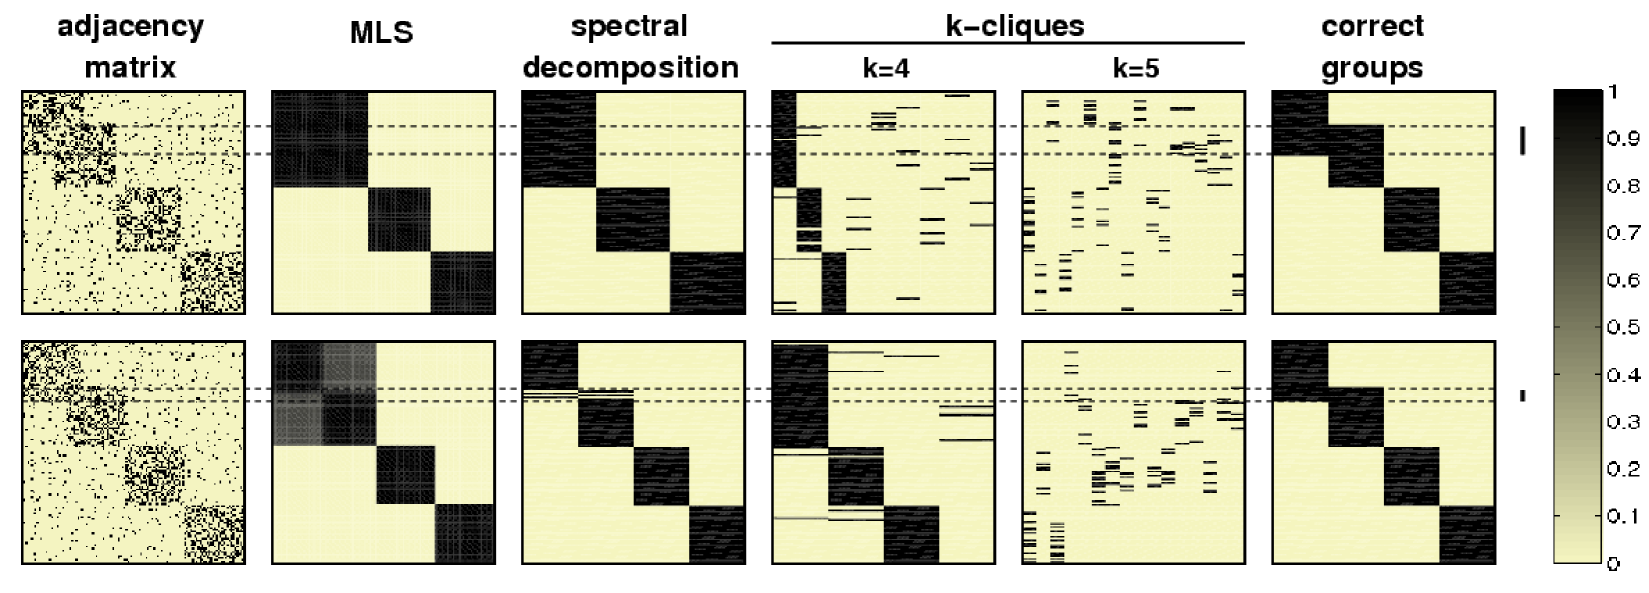
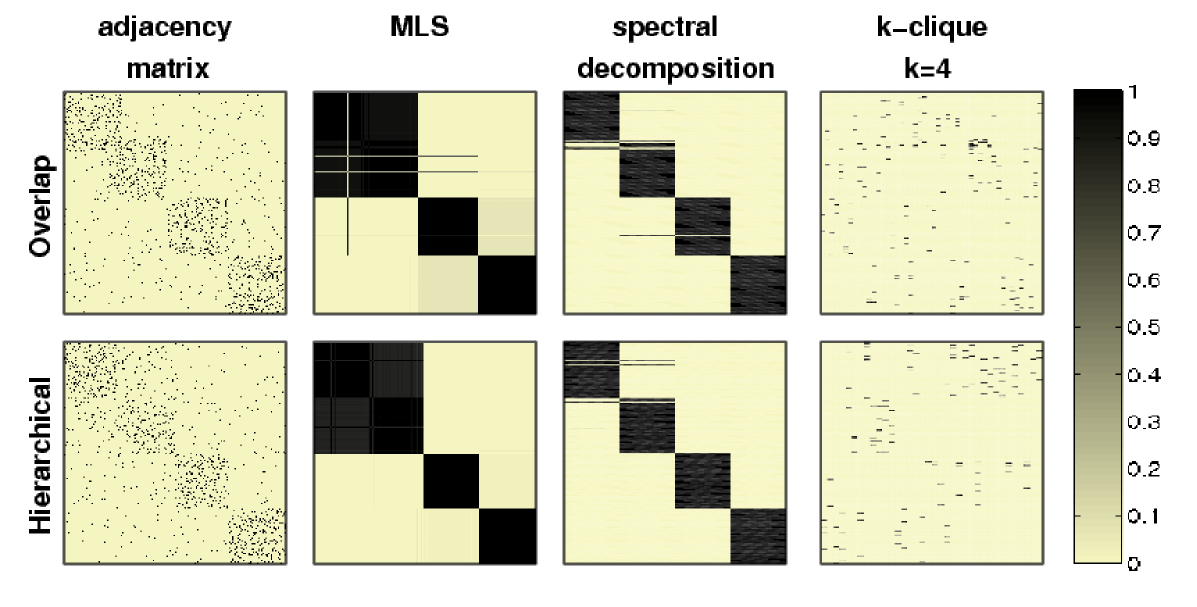
To compare the performance of the methods for the ensemble of model networks with overlapping groups previously introduced, we generate ten networks for each set of parameter values and apply the three group detection algorithms to each network. Figure 2 displays the typical results obtained for a network with parameters , , or , and or .
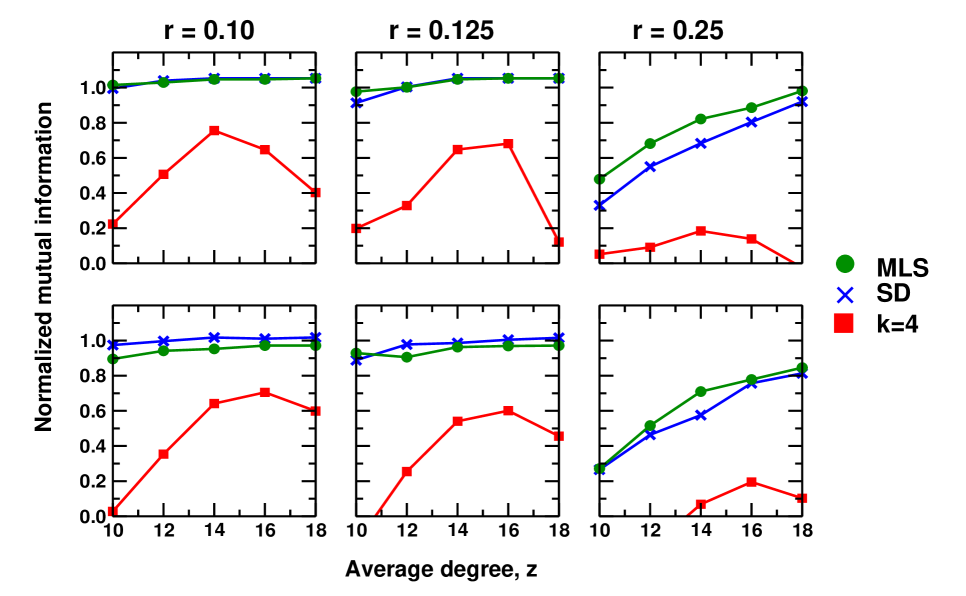
To determine the accuracy of each method, we compare the partitions returned by each method to the known division of nodes into groups. Specifically, we use the normalized mutual information , which quantifies the amount of information that two different partitions share danon05 . Figure 3 displays the average versus for and or and different values of .
Since the average degree of a node should strongly affect the ability of each group detection method to detect the known group structure, we systematically investigate degree effects. We expect that, as degree increases, the difficulty of detection should decrease. Also, as the number of nodes having membership to two or more groups increases, the difficulty of detection should increase.
4.1 Modularity maximization
The results obtained with the spectral decomposition method exhibit different behaviors depending on the size of the overlap: for small overlaps (), the method identifies four groups, whereas for large overlaps (), it identifies three groups, such that the two overlapping groups are combined into a single one, as predicted by Fortunato and Barthélemy fortunato07 . Note that there are no significant differences between the cases and .
4.2 Modularity-landscape surveying
In contrast, the modularity-landscape surveying method is able to uncover more information about the underlying organization of the nodes in the network than either the modularity maximization or k-clique percolation methods. Even for small overlaps, the algorithm is able not only to identify densely interconnected groups of nodes, but is also able to detect that the overlapping groups have more in common with each other than with the remaining groups (Fig. 2).
4.3 k-clique percolation
The results obtained with the k-clique method depend strongly on the value of . For , the method is unable to detect the modular structure of the networks; it places all the nodes into a single group. For , the two overlapping groups are mostly combined into one group for both large and small overlaps. Finally, for , the algorithm does not identify any sizable group of nodes in the network. In fact, the signal provided by the k-clique method is weaker than that provided by the adjacency matrix. Surprisingly, even though the k-clique method allows nodes to belong to more than one group, the nodes placed in multiple groups do not in general correspond to the nodes belonging to the overlapping groups (Fig. 2).
We find that the accuracy of the k-clique method is always much smaller than that of the spectral decomposition and modularity-landscape surveying methods. In fact, in order for the k-clique method to return results that are significant, one must have . Moreover, for , the accuracy of the method decreases as the density of edges increases.
For low edge densities, the network does not contain any 5-cliques, so the groups identified for are unreliable. These results point to a severe limitation of the k-clique method: similar networks require different k values in order to yield meaningful results, and even when group detection is meaningful the method always performs significantly worse than modularity based methods.
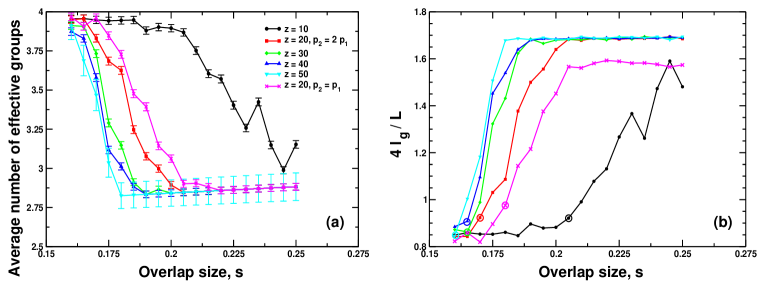
4.4 Overlap detectability
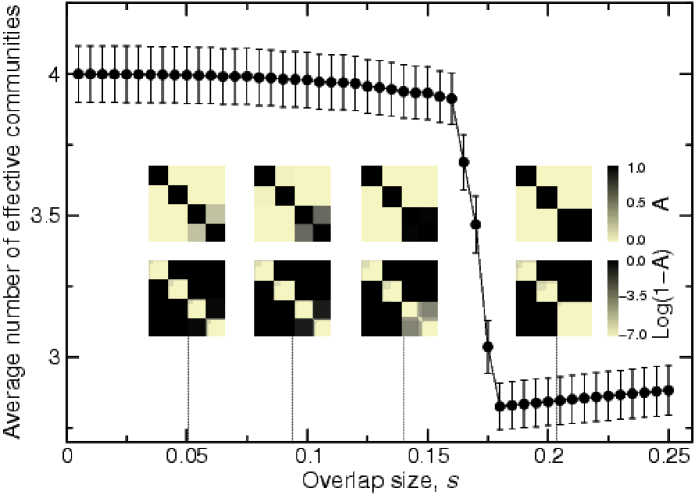
These results suggest that the detection of overlapping groups may be essentially impossible when the overlap is large. However, for small overlaps, the modularity-landscape surveying method is able to detect heterogeneities in node group membership. The question that arises is thus how small should the overlap be in order to be detected and whether detection may ever be unambiguous. To answer this question, we analyze model networks with groups comprising nodes, , , and , for a wide range of overlap sizes (Figs. 4 and 6). The spectral decomposition method shows a transition from identifying four groups () to identifying three groups (). For , the modularity-landscape surveying method is able to detect the signature of heterogeneities in node membership. However, the “signal” fades as increases.
Like the spectral decomposition method, the modularity-landscape surveying method also indicates that there are three different groups for . Additionally, it is impossible to detect the overlap between groups from the collection of edges alone. The signal is only distinct for , and even then it is not clear whether one can distinguish between the case in which two groups overlap and the case in which a group comprises two sub-groups (Fig. 5) sales-pardo07 .
5 Conclusions
The ability to detect overlapping communities within real-world networks would greatly enhance understanding of phenomena such as synchronization arenas06 . However, our analysis reveals that the group detection methods in the literature are not entirely equipped to handle such information. In some cases, these methods may require tunable parameters, such as in the k-clique percolation method palla05 and the method of Gfeller et al. gfeller05 . The promising method of Nepusz et al. nepusz08 aims to obtain the global organization of a network while determining which nodes act as “bridges” between communities. This method captures some of the same information as the modularity-landscape surveying method, but requires additional centrality calculations to correct for the “bridgeness” score. Furthermore, even the recently proposed modularity-landscape surveying method, which can detect small overlaps, is not able to unambiguously differentiate overlapping groups from hierarchically-organized groups.
Acknowledgments
We thank R. Guimerà, M.J. Stringer, and M.E.J. Newman for comments. L.A.N.A. gratefully acknowledges the support of the Keck Foundation, an NIH/NIGMS K-25 award, and of NSF.
Appendix A
To characterize how the degree and the size of the overlap affect group detection, we generate forty networks composed of four groups of 100 nodes each for every set of conditions tested. We tested the degree of a non-overlapping node at values of , and we tested the size of the overlap, , for through . Each of these networks was generated with , except for the case , for which we also studied networks with .
Since the spectral decomposition method is very fast and is considered the gold standard for group detection, we applied this method on each of the networks generated (Fig. 6a). We expected the spectral decomposition method to detect four groups for low overlap sizes for every degree tested, and that it would detect three groups at higher overlap sizes or at higher node degree. We expected also that the higher the degree, the faster the transition between four detectable groups and three detectable groups. Since some of the groups reported by the method were very small, we calculated the effective number of groups, .
| (3) |
where is the list of groups in the partition of the network returned by the method, is the number of nodes in a group within , and is the total number of nodes in the network. For the networks with an average degree of and , we find a transition from detecting four groups to detecting three groups for , while for , the transition occurs by .
However, we wanted to further investigate the detectability for the degrees and overlap sizes chosen. Specifically, we examine the detection resolution limits as outlined by Fortunato and Barthélemy in fortunato07 . In their paper, Fortunato and Barthélemy indicate that in order for a group to be unambiguously detectable by spectral decomposition, it must meet two criteria: (i) the number of links within group , or , should be less than the total number of links divided by four, or ; and (ii) the ratio of links leaving the module, , to links within the module should be less than two, or . All of the detected groups for each of the networks satisfied the second condition. Figure 6 shows versus for each degree. In this figure, a value less than one indicates that the resolution detection limit is satisfied. Comparing Figures 6a and b, we see that as soon as the resolution detection limit is violated, the number of detected groups decreases, so our results are consistent with those of Fortunato and Barthélemy fortunato07 .
References
- (1) M.E.J. Newman, M. Girvan, Phys. Rev. E 69(2), art. no. 026113 (2004)
- (2) R. Guimerà, L.A.N. Amaral, J. Stat. Mech.: Theor. Exp. p. art. no. P02001 (2005)
- (3) D.J. Watts, P.S. Dodds, M.E.J. Newman, Science 296, 1302 (2002)
- (4) L. Donetti, M.A. Muñoz, J. Stat. Mech.: Theor. Exp. p. art. no. P10012 (2004)
- (5) R. Guimerà, M. Sales-Pardo, L.A.N. Amaral, Phys. Rev. E 70, art. no. 025101 (2004)
- (6) J. Reichardt, S. Bornholdt, Phys. Rev. Lett. 93, art. no. 218701 (2004)
- (7) J. Duch, A. Arenas, Phys. Rev. E 72, art. no. 027104 (2005)
- (8) G. Palla, I. Derényi, I. Farkas, T. Vicsek, Nature 435(7043), 814 (2005)
- (9) J. Baumes, M. Goldberg, M. Magdon-Ismail, Efficient Identification of Overlapping Communities, in Intelligence and Security Informatics: IEEE International Conference on Intelligence and Security Informatics, ISI 2005, edited by P. Kantor, G. Muresan, F. Roberts, D. Zeng, F.Y. Wang, H. Chen, R. Merkle, IEEE (Springer, Berlin, 2005), Vol. 3495 of Lecture Notes in Computer Science, pp. 27–36
- (10) D. Gfeller, J.C. Chappelier, P.D.L. Rios, Phys. Rev. E 72, 056135 (2005)
- (11) T. Nepusz, A. Petróczi, L. Négyessy, F. Bazsó, Phys. Rev. E 77, 016107 (2008)
- (12) J.B. Pereira-Leal, A.J. Enright, C.A. Ouzounis, Proteins 54(1), 49 (2004)
- (13) M. Sales-Pardo, R. Guimerà, A.A. Moreira, L.A.N. Amaral, Proc. Natl. Acad. Sci. U. S. A. 104, 15224 (2007)
- (14) A. Clauset, C. Moore, M.E.J. Newman, Nature 453(7191), 98 (2008)
- (15) R. Guimerà, L.A.N. Amaral, Nature 433, 895 (2005)
- (16) M.E.J. Newman, Proc. Natl. Acad. Sci. USA 103(23), 8577 (2006)
- (17) M.E.J. Newman, Phys. Rev. E 68, 026121 (2003)
- (18) R. Guimerà, S. Mossa, A. Turtschi, L.A.N. Amaral, Proc. Natl. Acad. Sci. USA 102(22), 7794 (2005)
- (19) M.B. Hastings, Phys. Rev. E 74(3 Pt 2), art. no. 035102 (2006)
- (20) M.E.J. Newman, Phys. Rev. E 74(3 Pt 2), art. no. 036104 (2006)
- (21) S. Fortunato, M. Barthélemy, Proc. Natl. Acad. Sci. USA 104(1), 36 (2007)
- (22) J.M. Kumpula, J. Saramaki, K. Kaski, J. Kertesz, Eur. Phys. J. B 56, 41 (2007)
- (23) L. Danon, A. Díaz-Guilera, J. Duch, A. Arenas, J. Stat. Mech.: Theor. Exp. p. art. no. P09008 (2005)
- (24) F.H. Stillinger, T.A. Weber, Phys. Rev. A 25, 978 (1982)
- (25) F.H. Stillinger, T.A. Weber, Science 225, 983 (1984)
- (26) Stillinger, Weber, Phys. Rev. B 31(8), 5262 (1985)
- (27) A. Arenas, A. Díaz-Guilera, C.J. Pérez-Vicente, Phys. Rev. Lett. 96, art. no. 114102 (2006)