Ferromagnetism and Lattice Distortions in the Perovskite YTiO3
Abstract
The thermodynamic properties of the ferromagnetic perovskite YTiO3 are investigated by thermal expansion, magnetostriction, specific heat, and magnetization measurements. The low-temperature spin-wave contribution to the specific heat, as well as an Arrott plot of the magnetization in the vicinity of the Curie temperature K, are consistent with a three-dimensional Heisenberg model of ferromagnetism. However, a magnetic contribution to the thermal expansion persists well above , which contrasts with typical three-dimensional Heisenberg ferromagnets, as shown by a comparison with the corresponding model system EuS. The pressure dependences of and of the spontaneous moment are extracted using thermodynamic relationships. They indicate that ferromagnetism is strengthened by uniaxial pressures and is weakened by uniaxial pressures and hydrostatic pressure. Our results show that the distortion along the - and -axes is further increased by the magnetic transition, confirming that ferromagnetism is favored by a large GdFeO3-type distortion. The -axis results however do not fit into this simple picture, which may be explained by an additional magnetoelastic effect, possibly related to a Jahn-Teller distortion.
pacs:
75.30.-m,75.50.Dd,75.50.Ee,75.80.+qI Introduction
ABO3 perovskites exhibit a large variety of electronic and magnetic properties goodenough04 . The titanate family ATiO3 recently attracted particular interest, since YTiO3 orders ferromagnetically below the Curie temperature K, whereas LaTiO3 orders antiferromagnetically below the Néel temperature K goral82 ; okimoto95 ; goodenough04 ; mochizuki04 ; pavarini05 ; komarek07 . In these systems, the spins localized on the ions are responsible for the magnetic properties. A change from ferromagnetism to antiferromagnetism can be continuously tuned by varying the lanthanum concentration in the alloys Y1-xLaxTiO3, or by changing the lanthanide A (A = YbLa) in the undoped ATiO3 goral82 ; okimoto95 ; goodenough04 ; mochizuki04 . A GdFeO3-type distortion is driven by ion-size mismatch and comprises rotations of the TiO6 octahedra. It is responsible for the distorted structure of the ATiO3 crytals, with the space group . This distortion is more pronounced in YTiO3 than in LaTiO3, being favored by smaller A3+ ions (A = Y,La) mochizuki04 ; pavarini05 . In YTiO3, an additional elongation, by about 3 , of the TiO6 octahedra is observed. This distortion has been ascribed to staggered ordering of the orbitals (Ti3+ ions) akimitsu01 ; iga04 ; komarek07 . The switch from antiferromagnetism to ferromagnetism in the ATiO3 perovskites is probably controlled by the extreme sensitivity of the magnetic superexchange interactions to the distortions of the lattice mochizuki04 ; pavarini05 ; solovyev06 . However, the mechanism driving this transition is still a matter of considerable debate pavarini05 ; komarek07 ; akimitsu01 ; iga04 ; zhou05 ; khaliullin03 ; craco06 ; okatov05 ; solovyev06 . For a proper description of the magnetic properties, it is thus crucial to carefully consider their dependence on the lattice distortion.
In this article, we present a study of the thermodynamic properties of YTiO3. Experimental details will be given in Section II. In Section III, the specific heat, thermal expansion, magnetization, and magnetostriction data measured with magnetic fields applied along the easy -axis will be presented. In Section IV, these results will be discussed and compared to the behavior expected within a three-dimensional (3D) Heisenberg ferromagnetic model ulrich02 . As a specific example, we will show data on the typical 3D Heisenberg system EuS maletta82 ; maletta89 . In Section V, the relation between the distortion and the magnetic properties will be discussed in the light of our results. The dependence of the distortion on the A3+ ionic sizes, on uniaxial pressures, and on the temperature will be considered.
II Experimental details
Single crystals of YTiO3 were prepared by the floating zone method using a four-mirror-type infrared image furnace from Crystal System Corporation. More details about the crystal growth are given in Ref. kovaleva07, . Two samples have been investigated and the measurements presented here were obtained on the sample with the sharpest transition at . This sample was cut so that its faces are perpendicular to the -, -, and -axes, its dimensions at room temperature being equal to mm, mm, and mm along , , and , respectively, with a mass of 116 mg. Thermal expansion and magnetostriction were measured using a home-made high-resolution capacitive dilatometer meingast90 ; pott83 , with temperature and field sweep rates of 20 mK/s and 0.5 T/min, respectively. Three sets of measurements were performed, where the length was measured along the -, -, and -axes (, , and , respectively). Specific heat and magnetization were measured using a Physical Properties Measurement System and a Magnetic Properties Measurement System, respectively (Quantum Design). For all measurements, the magnetic field was applied parallel to the easy axis . The thermal expansion of EuS was measured using a 8 mm long single crystal grown from the melt by K. Fischer at the Forschungszentrum Jülich, as described elsewhere kobler75 .
III Results
III.1 Specific heat and thermal expansion
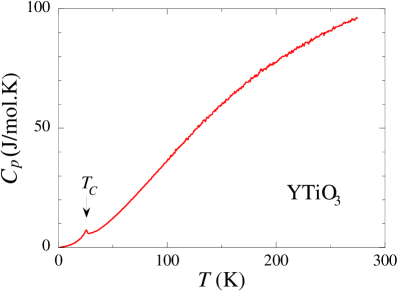
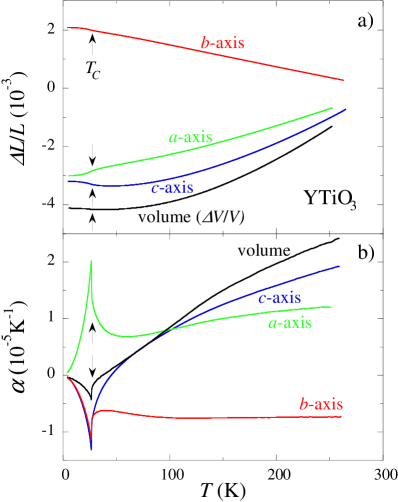
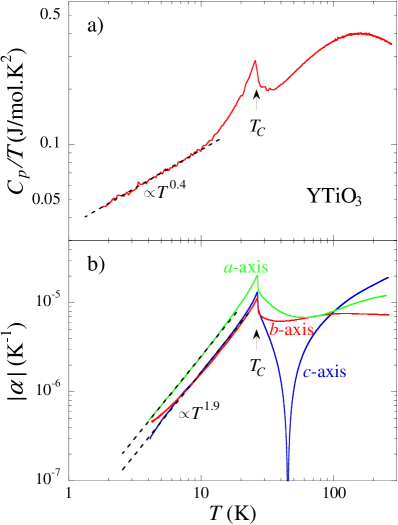
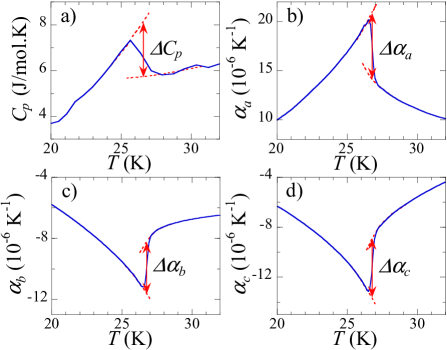
In Fig. 1, the specific heat of YTiO3 is shown in a versus plot. Ferromagnetic ordering is characterized by an anomaly at K, defined at the minimum of slope of . In Fig. 2 (a), the variation with of the relative lengths is shown for , , and , being fixed to zero at room temperature. The linear thermal expansion coefficients , with , , and , are extracted from these data and are plotted in Fig. 2 (b). The volume change and the related volume thermal expansion coefficient are also shown in Fig. 2 (a) and (b), respectively. As seen in Fig. 2, changes of slope in , , , and are induced at , leading to a positive anomaly in and to negative anomalies in , , and . The volume decrease below , which is similar to the invar effect, will be further related to the negative hydrostatic pressure dependence of . From the thermal expansion data, we extract a Curie temperature K at the extremum of slope of . This is in good agreement with prior observations kovaleva07 . At temperatures sufficiently higher than , , , and increase with , while decreases with (Fig. 2 (a)). This leads to the positive values of , , and and to the negative values of observed at high temperatures in Fig. 2 (b). The anisotropy of at high temperatures is a consequence of the lattice distortions, which will be discussed in Section V.
III.2 Magnetization and magnetostriction
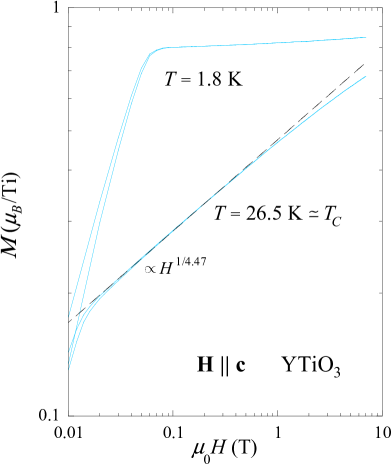
In Fig. 3, the magnetization versus field is shown for in a log-log plot, at 1.8 K and K . At 1.8 K, a linear increase of is obtained for T and is related to the alignment of ferromagnetic domains. For , the spins are aligned parallel to and the magnetization reaches . In this regime, a slight increase of is observed. Indeed, is not yet fully saturated and is somewhat smaller than the full moment of 1 expected for the Ti3+ ions ulrich02 ; tsubota00 . At , increases first almost linearly with , for T, and then varies as , with , for T. This power law, observed above 1 T, is characteristic of the critical ferromagnetic regime. Deviations are observed when becomes close to .
In Ref. kovaleva07, , low temperature magnetization measurements were reported on the same sample as in the present work and moments of 0.84 and 0.82 were found for a magnetic field of 7 T applied along and , respectively. These data agree well with the saturated magnetic moment of 0.84 reported in Ref. tsubota00, and garret81, , and with the moments of 0.83 0.05 and 0.84 0.05 , for the a- and c axis, respectively, determined by recent Magnetic Compton Profile experiments tsuji08 .
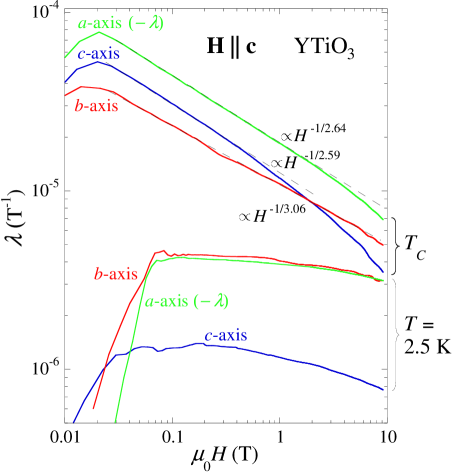
In Fig. 4, the magnetostriction coefficients are plotted as a function of on a log-log scale, at K and K, with , , and , and . For all temperatures and magnetic fields, and are positive while is negative. For the three configurations at K, increases for T and is almost constant for , when the domains are aligned. At , increases before reaching a maximum at T. For , a critical regime is observed, where , with 2.64, 3.06, and for , , and , respectively. While the power law is followed up to almost 10 T in , deviations are found for T in and .
IV Ferromagnetic properties
IV.1 Low temperature spin waves
In Fig. 5 (a), the specific heat of YTiO3 is plotted in a log-log plot of versus . Well below , the phonon contribution can be neglected and the signal, which varies as up to 10 K, is believed to be only magnetic. This power law is compatible with isotropic 3D Heisenberg ferromagnetic spin waves, for which a law would be expected, and is thus in good agreement with the spin-wave dispersion observed by neutron scattering ulrich02 . The slight deviation from the law might result from a small spatial anisotropy of the exchange, the spin-wave contribution to the specific heat of a ferromagnet varying as , where is the dimensionality of the exchange. It may also be related to possible additional antiferromagnetic spin fluctuations and/or to spin anisotropies originating from spin-orbit coupling (see below).
In Fig. 5 (b), the thermal expansion is plotted in a log-log plot of versus , for , , and . Power laws are found up to almost 20 K for and , while no clear power law is observed for . As simple 3D Heisenberg ferromagnetic spin waves should lead to , the different -dependences of and reported here may result from anisotropic exchange interactions, which lead to weak additional magnetic Bragg reflections due to canting of the ferromagnetic moments ulrich02 . Weak low-energy spin fluctuations around these wave vectors may contribute to the deviation of the temperature dependence of the low-temperature specific heat and thermal expansion from the predictions of a simple ferromagnetic Heisenberg model notespinwave . Further studies of the spin wave spectra (e.g. by neutron scattering) and detailed calculations are needed for a quantitative explanation of the results obtained here. Systematic studies by specific heat and thermal expansion of the ATiO3 family, such as the work initiated in Ref. komarek07, , may be of importance to understand the evolution of the low temperature magnetic properties.
IV.2 Arrott plot and critical fluctuations
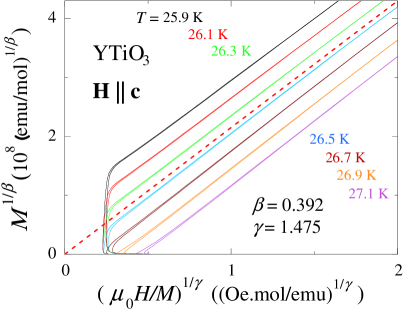
To analyze the critical ferromagnetic regime, the magnetization was measured as versus at several temperatures close to . In Fig. 6, an Arrott plot of these data is shown as versus , for K. The critical exponents and used in this plot were determined from a fit of using Arrott’s equation of state arrott67 ; notecriticalexponents :
| (1) |
for T and K. The value of K obtained from this fit agrees well with that obtained from the specific heat and thermal expansion (Section III.1). From Equation (1):
| (2) | |||||
| (3) |
Using the exponents and obtained with Arrott’s method, we calculate the critical exponent , which agrees favorably with directly obtained from the fit by a power law of at 26.5 K (Section III.2).
In Table 1, the exponents , , and expected for different classes of universality collins89 are listed for comparison. The exponents extracted from the Arrott plot of the magnetization of YTiO3 are rather close to those of the 3D Heisenberg universality class. A similar plot was made in Ref. cheng08, using 3D Heisenberg exponents, but without a preliminary fit of the data as done here. As already inferred from the behavior of the low temperature spin waves, the critical behavior of the magnetization, too, is thus consistent with a 3D Heisenberg picture of ferromagnetism (cf. Section IV.1 and Ref. ulrich02, ).
In the following, the power laws reported for the magnetostriction at (Fig. 4) are related to the critical power law of the magnetization (Fig. 3) and to the critical exponents and . Using the Maxwell relation:
| (4) |
the magnetostriction coefficients can be expressed as functions of the uniaxial pressure dependences of the magnetization. Assuming that , the derivative of Equation (1) leads to, at :
| (5) | |||||
| (6) |
From the exponents and obtained by the Arrott fit of the magnetization, a critical exponent is expected to characterize the magnetostriction at . This value is in good agreement with the values determined from the fits of at (see Section III.2). For each set of (,), the corresponding values are also given in Table 1. These values are compatible with a 3D Heisenberg scenario of ferromagnetism for YTiO3 associated with . The slight variations of with are not understood and may result from various secondary effects (anisotropic energy scales, defects etc.).
To our knowledge, YTiO3 is the second ferromagnetic system known, after the itinerant ferromagnet UIr knafo08a , where a critical power law is reported in the magnetostriction at . We believe that such an effect is quite general and should be present in most ferromagnets, once the field and temperature ranges are properly chosen. We note that, more than 60 years ago, Belov has theoretically predicted a similar law belov56 , but only within a mean-field approach, which corresponds to , , and (cf. Table 1). Our approach is more general and permits to obtain the critical exponent for each combination of (,) and thus, for each universality class.
| Critical exponents | ||||
|---|---|---|---|---|
| YTiO3 (best fit) | 0.392 (50) | 1.475 (100) | 4.76 (20) | 3.07 (50) |
| 3D Heisenberg | 0.367 | 1.388 | 4.78 | 2.77 |
| 3D XY | 0.345 | 1.316 | 4.81 | 2.54 |
| 3D Ising | 0.326 | 1.238 | 4.80 | 2.32 |
| 2D Ising | 0.125 | 1.75 | 15 | 2.14 |
| Mean Field | 0.5 | 1 | 3 | 3 |
IV.3 High-temperature magnetic signal: deviation from a pure 3D Heisenberg ferromagnet
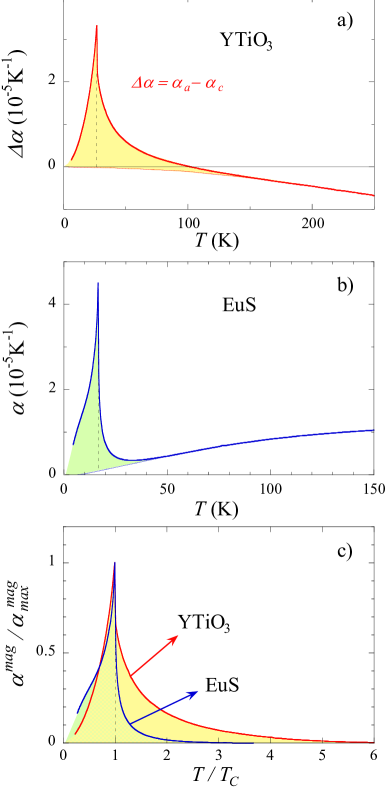
The distortion of the lattice induces the strong anisotropy observed in the high-temperature thermal expansion of YTiO3 (see Fig. 2). This anisotropic lattice signal must be properly taken into account to extract the magnetic contribution to the thermal expansion. Since and are rather close above 100 K, we assume that the lattice contributions to and are similar, so that , which is plotted in Fig. 7 (a), can be considered as a signal representative of the magnetic thermal expansion. In this plot, the thin red line is a guide to the eye indicating the ”remaining” non-magnetic background and the yellow area corresponds to the estimated magnetic contribution. In Fig. 7 (b), the thermal expansion of cubic EuS notecubicalpha , which is known as a prototype of 3D Heisenberg ferromagnetism kornblit78 ; wosnitza89 ; boni95 , is shown for comparison. The thin blue line is a guide to the eye indicating the non-magnetic background and the magnetic contribution is estimated by the blue area. The estimates of the magnetic contribution to the thermal expansion of YTiO3 and EuS are plotted in Fig. 7 (c). In this plot, the magnetic thermal expansion coefficient is normalized by its maximal value and the temperature is normalized by . Fig. 7 (c) indicates that, in YTiO3, the magnetic signal has a significant weight above and extends up to about while, in EuS, it has most of its intensity below and vanishes completely above about . Thus, the magnetic fluctuations of YTiO3 cannot be described as those of a simple 3D Heisenberg ferromagnet.
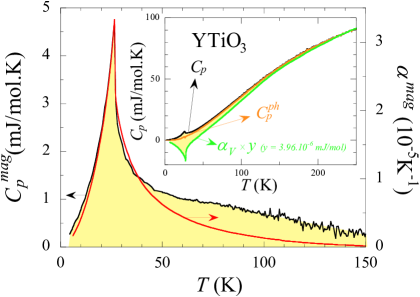
As shown in the inset of Fig. 8, the specific heat and the volume thermal expansion can be scaled at high temperatures using an empirical parameter mJ/mol defined by . Assuming that the magnetic contribution to and is negligible above 200 K, and that there is a single Gruneisen parameter associated with the phonons for the [0,300 K] range, we can estimate the phonon contribution to the specific heat by , being adjusted so that no anomaly remains at . The main frame of Fig. 8 shows the resulting estimate of the magnetic contribution to the specific heat. This plot confirms the conclusions from Fig. 7, i.e. that a magnetic contribution is present up to more than 100 K. Integration of the estimated magnetic heat capacity leads to the magnetic entropy J/mol.K. This entropy is roughly equal to the full spin entropy J/mol.K expected for spin system; the fact that is about 20 % smaller than may be imputed to the experimental error.
In Fig. 8, the estimated magnetic contributions to the thermal expansion and to the specific heat are plotted together; above 50 K, the different shapes of the signals indicate the limit of the methods used here. Both plots indicate clearly the presence of a magnetic signal at temperatures well above ferromagnetic ordering. The origin of this behavior, which is not expected for usual 3D-Heisenberg ferromagnets (see Fig. 7), is not yet understood. In principle, a modified conventional spin-only fluctuation model, for example with competing (and possibly low-dimensional) antiferromagnetic and ferromagnetic interactions, could describe this anomalously high-temperature magnetic signal. However, this is in apparent contradiction with the magnon spectra reported by neutron scattering, which do not exhibit pronounced deviations from the predictions of a 3D Heisenberg model with nearest-neighbor interactions ulrich02 . An alternative explanation of the extended magnetic fluctuation regime could be offered by spin-orbital fluctuations models, where an energy scale significantly exceeding the magnon bandwidth (in Ref. ulrich06, ; ulrich08, , orbital fluctuations were associated with an excitation at about 250 meV) could actuate ferromagnetic fluctuations at temperatures between and room temperature khaliullin03 . Further work is required to ascertain whether a quantitatively consistent picture of the spin ulrich02 and orbital ulrich06 ; ulrich08 excitation spectra and thermodynamics of YTiO3 can be obtained.
V Coupling between the lattice and the magnetic properties
V.1 Uniaxial pressure dependences - Comparison with LaTiO3
| YTiO3 | LaTiO3 | |||
|---|---|---|---|---|
| (10-3kbar-1) | (10-3kbar-1) | (10-2kbar-1) | ||
| 9.9 1.0 | 2.7 0.4 | 3.7 1.0 | -1.9 0.4 | |
| -5.1 0.5 | -2.7 0.4 | 1.9 0.5 | 1.9 0.4 | |
| -7.1 0.7 | -0.77 0.15 | 9.1 2.5 | ||
| -2.3 0.3 | -0.77 0.15 | 2.9 1.0 | ||
Fig. 9 shows the anomalies at in the specific heat and in the thermal expansion of YTiO3. These anomalies are typical of a second-order phase transition, whose jumps are estimated as J/molK in the specific heat and as K-1, K-1, and K-1 in the thermal expansion. Using the Ehrenfest relation:
| (7) |
where m3/mol is the molar volume and a uniaxial pressure applied along (, , and ), we extract the uniaxial pressure dependences reported in Table 2. The sum of the three uniaxial pressure dependences of gives the hydrostatic pressure dependence K/kbar. Assuming that, in YTiO3, remains constant under hydrostatic pressure, ferromagnetism may be destroyed above kbar.
For comparison, the uniaxial pressure dependences of , for the antiferromagnet LaTiO3, are also listed in Table 2. To calculate them, in Equation (7) was substituted by K, J/molK, K-1, K-1, and being estimated from Ref. hemberger03, . While is too small to be extracted from Ref. hemberger03, , and are such that . For , the uniaxial pressure dependences of and , for YTiO3 and LaTiO3, respectively, have thus opposite sign. The effects of pressure along are such that and . In Sections V.2 and V.3, the uniaxial pressure-dependences of and in YTiO3 and LaTiO3, respectively, will be interpreted as resulting from pressure-induced modifications of the distortion.
Well below and for T, 0.8 (Fig. 3) and the magnetostriction coefficients of YTiO3 are almost constant, having the values T-1, T-1, and T-1 (Fig. 4). Using the Maxwell relation given in Eq. (4), we extract:
| (8) |
The values of , for , , and , as well as their sum, the hydrostatic pressure dependence , are summarized in Table 2.
For each , , , and ( hydrostatic), the pressure dependences and have always the same sign, being both positive for and both negative for (Table 2). Ferromagnetic order is thus stabilized by uniaxial pressure and is destabilized by uniaxial pressure and by hydrostatic pressure. Consequently, the ratio , defined by:
| (9) |
is always positive. As shown in Table 2, we find that is strongly anisotropic, being bigger when the -axis is easier ( easy, intermediate, and hard tsubota00 ; kovaleva07 ).
Although YTiO3 is a localized ferromagnet, its saturated moment, at about 5 T, is only 80 % of the fully saturated moment . A small canted antiferromagnetic moment was reported by neutron scattering in YTiO3 ulrich02 and explains partly why is reduced. In addition, the reduction of may indicate an enhanced phase space for quantum magnetic fluctuations. The question is whether this reduction comes from usual spin-only fluctuations, or if it results from more complicated fluctuations involving orbital degrees of freedom khaliullin03 ; ulrich02 . The high values of in YTiO3 may result from the combination of two effects, which can be summarized as the uniaxial pressure-induced transfers of weight (i) between the ferromagnetic moment and the antiferromagnetic moment and, (ii) between and some quantum magnetic fluctuations . The second effect is similar to what happens in itinerant ferromagnets, where is reduced by quantum fluctuations of the magnetic moment, and where the strong pressure dependences of are related to those of .
A similar analysis as the one presented here was reported for the itinerant weak ferromagnet UIr (Ref. knafo08a, ), in the framework of the Moriya’s spin fluctuation theory of itinerant magnetism moriya95 ; takahashi06 . By analogy, a spin fluctuation theory, adapted to the particular case of YTiO3, may be appropriate.
V.2 Coupling between the GdFeO3-type distortion and the magnetic ordering
In the ATiO3 perovskites, the GdFeO3-type distortion comprises a combination of tilts and rotations of the TiO6 octaedra. This results in an orthorhombic structure, where , being the lattice parameter of an undistorted cubic structure duboulay95 ; notelatticecubic . In the alloys Y1-xLaxTiO3, La-substitution induces a decrease of the GdFeO3-type distortion, which is believed to control the change from ferromagnetism to antiferromagnetism goral82 ; okimoto95 ; goodenough04 ; mochizuki04 ; pavarini05 (Fig. 10). This picture, in which ferromagnetism is favored by a large GdFeO3-type distortion, is qualitatively confirmed by the increase of the distortion of the (,) plane induced below (see Fig. 2). In the following, we will further show that, for , the uniaxial pressure dependences of and are mainly controlled by those of the GdFeO3-type distortion.
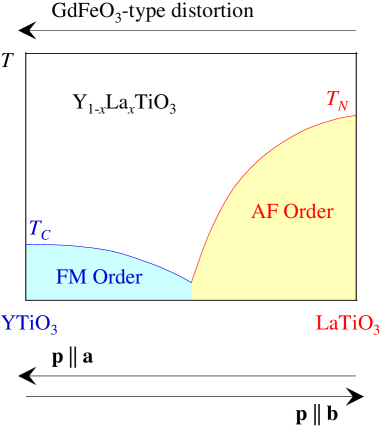
In YTiO3 and LaTiO3, the negative sign of and the positive sign of (see Table 2), respectively, imply that a uniaxial pressure can be seen as equivalent to La-doping (cf. the corresponding arrow in Fig. 10). Conversely, the fact that is positive while is negative (Table 2) implies that is equivalent to Y-doping (see Fig. 10). As induces a compression along and, because of elasticity, extensions along and , its effects are very similar to those of reducing the GdFeO3-type distortion. By analogy, leads to a compression along and to small extensions along and , which is similar to increasing the GdFeO3-type distortion. Thus, we conclude that and induce an increase and a decrease of the GdFeO3-type distortion, respectively, which are responsible for the various signs of , for .
The uniaxial pressures dependences of and are a consequence of the high sensitivity of the superexchange interactions to the bond angles between the ions, whose positions are very sensitive to the pressure-induced modifications of the GdFeO3-type distortion. The application of uniaxial pressures , as well as the variation of the A3+ ion, permits thus to tune the competition between the ferromagnetic and the antiferromagnetic exchange interactions, via a change of the GdFeO3-type distortion.
However, a pressure-driven change of the GdFeO3-type distortion cannot explain the results obtained for , i.e. and . Indeed, and would be expected if merely modified the GdFeO3-type distortion (since contracts , it should increase the GdFeO3-type distortion). Another mechanism, in addition to the GdFeO3-type distortion, is needed to understand the pressure dependences of and for . In the next Section, we will show that a higher sensitivity of the -axis length to the intrinsic elongations of the octahedra may be the origin of this behavior.
V.3 Distortion of the TiO6 octahedra
V.3.1 Microscopic description
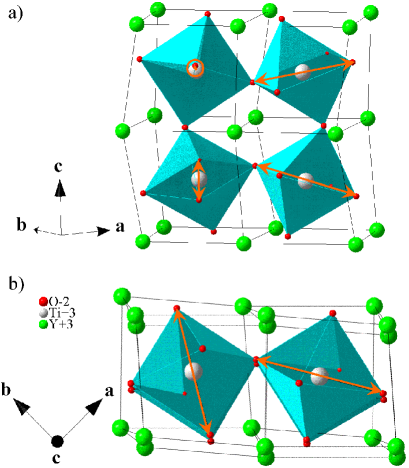
The lattice structure of YTiO3 is represented schematically in Fig. 11, where the alternation of tilts and rotations of the TiO6 octahedra (in blue) is due to the GdFeO3-type distortion. An additional distortion consists of an elongation of each octahedron along a particular axis (orange arrows in Fig. 11), and of contractions perpendicularly to this axis. In Ref. mochizuki04, ; pavarini05, ; akimitsu01, ; iga04, , the fact that the elongated axes vary from one site to another was ascribed to a staggered ordering of the orbitals (Ti3+ ions) via a collective Jahn-Teller effect. By geometrical considerations, we can qualitatively estimate the macroscopic distortion induced by the elongations of the octahedra. As seen in Fig. 11, the elongated axes are almost contained within the () plane, i.e. perpendicularly to the -axis. This implies that the elongations of the octahedra induce a contraction of the -axis. In the () plane, the elongated axes of two adjacent octahedra subtend an angle of about 60 ∘, so that the elongations and contractions of the different octahedra almost cancel each other. Since the projections of the elongated axes are larger along than along (the elongated axes subtend an angle of about 30 ∘ with and of about 60 ∘ with ), we finally conclude that the elongations of the octahedra are responsible for a small elongation of and for a tiny compression of , in addition to the main effect, a compression along .
V.3.2 Lattice parameters: comparison of the families ATiO3 and AFeO3
Here we propose a method, based on a comparison of the lattice parameters , and of the families ATiO3 and AFeO3, to confirm the description made in Section V.3.1 of the effects of the elongation of the octahedra on , and . Assuming that these elongations are related to a Jahn-Teller distortion note_jahn_teller , the comparison of the lattice parameters of ATiO3 and AFeO3 can be justified by the fact that, contrary to Ti3+, Fe3+ is not Jahn-Teller active so that AFeO3 can be considered as a non-Jahn-Teller reference for ATiO3.
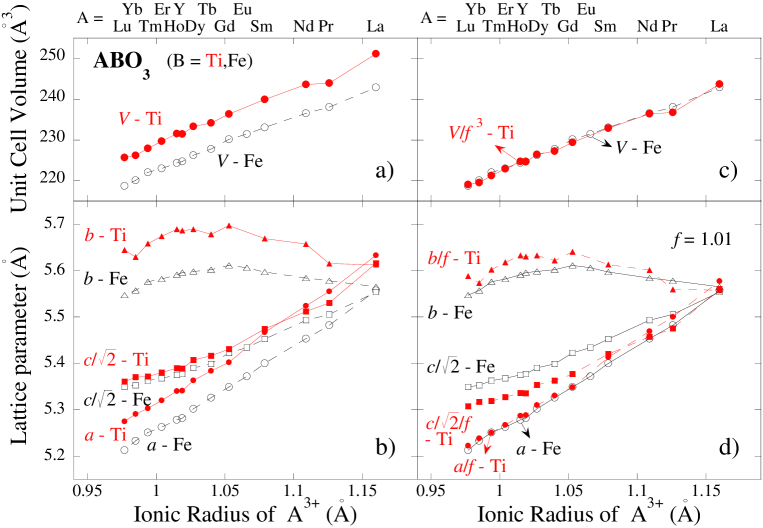
In Fig. 12 (a) and (b), the unit cell volume and the lattice parameters , , and are plotted versus the ionic radius of the A3+ ions, for several compounds of the families ATiO3 and AFeO3 (A=LuLa) zhou05 ; maclean79 ; duboulay95 ; marezio70 ; shannon76 . The ionic radii of the A3+ ions are taken from Ref. shannon76, , assuming a number of 8 nearest neighbors komarek07 . While LaTiO3 and LaFeO3 are almost undistorted (), Fig. 12 (b) shows a strong distortion of the pseudo-cubic lattice in ATiO3 and AFeO3, once A3+ is smaller than La3+.
In Fig. 12 (c), the unit cell volumes of the ATiO3 compounds are scaled empirically with the unit cell volumes of the AFeO3 compounds, using a scaling factor defined by . In Fig. 12 (d), the lattice parameters of ATiO3 are scaled to those of AFeO3 using the factor . As the undistorted limit in the ABO3 perovskites corresponds to a cubic lattice parameter , where and are the ionic radii of the O2- and B3+ ions, respectively, we associate the empirical scaling factor to the ratio , calculated with , , and Åshannon76 .
Since the ionic radii of Ti3+ and Fe3+ are very close,
we assume that, for the two families, the GdFeO3-type
distortion induces similar variations of their lattice parameters
in the scaled plot of Fig. 12 (d). Consequently, the
elongations of the octahedra, which can be neglected in the
non-Jahn-Teller compound AFeO3, might be responsible for the
slight differences, in Fig. 12 (d), between the
scaled lattice parameters of the two families. This implies that
the elongations of the TiO6 octahedra in YTiO3 induce a
decrease of by about 0.5 , accompanied by a
smaller increase of , by about 0.3 , and by no
noticeable change of . These conclusions, obtained using the
scaled plot of Fig. 12 (d), confirm those deduced
from geometrical arguments in Section
V.3.1.
V.3.3 Anomalous character of the -axis?
When is reduced, the decrease of is slowing down as the ferromagnetic transition at is approached, which ends by an upturn below , where increases with decreasing (see Fig. 2 (a)). The behavior of the -axis contrasts with those of the - and -axes, whose variations are monotonic for K and are amplified below (see Fig. 2 (a)). The distortion of the (,) plane results mainly from the GdFeO3-type distortion, whose modifications also control the uniaxial pressure dependences of and for (see Section V.2). In Sections V.3.1 and V.3.2, was shown to be more sensitive than and to the elongations of the TiO6 octahedra, possibly related to a Jahn-Teller effect. The sensitivity of to the distortions of the octahedra may be related to the anomalous uniaxial pressure-dependences of and for (see Section V.2), but also to the anomalous behavior of the c-axis in the spectral weight transfers of the optical conductivity kovaleva07 . Our findings are in apparent contradiction to theories according to which the Jahn-Teller distortion is an essential prerequisite of ferromagnetism in YTiO3 (Refs. mochizuki04, ; pavarini05, ). Rather, the properties of YTiO3 seem to be reminiscent of those of La7/8Sr1/8MnO3, where a Jahn-Teller distortion is fully suppressed at the onset of ferromagnetism Geck04 .
V.4 High-temperature extrapolation
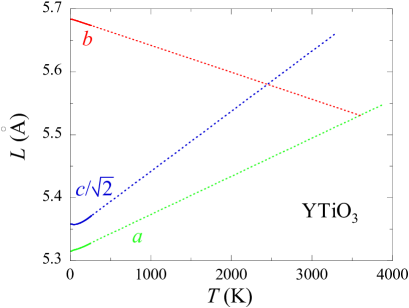
Equivalently to uniaxial pressures and variations of the A3+ ion size, increasing the temperature leads to a reduction of the distortion in the ABO3 perovskites. Indeed, the strong anisotropy of the thermal expansion coefficients , shown in Fig. 2 (b), is governed by the effects of temperature on the crystal distortion. Assuming constant thermal expansion coefficients above room temperature, Fig. 13 shows high-temperature extrapolations, up to 4000 K, of the lattice parameters , , and note_lattice_param . This plot indicates that, in YTiO3, a cubic structure with notelatticecubic might be recovered around 3000-4000 K. However, this temperature scale, characteristic of the lattice distortion, is inaccessible since it is far above the melting temperature of YTiO3.
VI Conclusion
The thermodynamic study of the perovskite system YTiO3 presented here allowed us to extract information about the ferromagnetic ordering and its coupling to the lattice distortions. While the low-temperature specific-heat data, as well as an Arrott plot of the magnetization close to , are consistent with a 3D Heisenberg picture of ferromagnetism, deviations from this simple picture were observed in the thermal expansion data at low temperature, where an unexpected power law is found. Above , a magnetic signal persists up to the remarkably high temperature of . Further work is required to show whether models incorporating combined spin-orbital fluctuations, instead of spin-only fluctuations, could quantitatively describe this extended fluctuation regime.
Ehrenfest and Maxwell relations enabled us to extract the uniaxial pressure dependences of the Curie temperature and of the spontaneous moment , which indicates that ferromagnetism is stabilized by uniaxial pressures and is destabilized by uniaxial pressures and by hydrostatic pressure. We interpreted the uniaxial pressure dependences of and obtained for as resulting from uniaxial pressure-induced modifications of the GdFeO3-type distortion. A high sensitivity of the -axis to an additional distortion of the TiO6 octahedra, possibly related to a Jahn-Teller effect, is believed to be responsible for the anomalous uniaxial pressure dependences of and observed for . This confirms that both kinds of distortion play an important role for the formation of ferromagnetism in YTiO3, Jahn-Teller distortion being not a necessary condition for ferromagnetism in YTiO3. While the - and -axes are more sensitive to the GdFeO3-type distortion, the -axis is more sensitive to the elongations of the octahedra. Finally, a high-temperature extrapolation of the lattice parameters led to the onset of the distortion at a virtual temperature of about 3000-4000 K. These results might be considered to further develop models for the electronic properties of the titanates.
Acknowledgments
We acknowledge useful discussions with T. Schwarz, D. Fuchs, M. Merz, R. Eder, O. Andersen, E. Pavarini, and G. Khaliullin. We thank K. Fischer for synthesizing the EuS crystal studied here. This work was supported by the Helmholtz-Gemeinschaft through the Virtual Institute of Research on Quantum Phase Transitions and Project VH-NG-016.
References
- (1) J.B. Goodenough, Rep. Prog. Phys. 67, 1915, (2004).
- (2) J.P. Goral, J.E. Greedan, and D.A. Maclean, J. Solid State Chem. 43, 244 (1982).
- (3) Y. Okimoto, T. Katsufuji, Y. Okada, T. Arima, and Y. Tokura , Phys. Rev. B 51, 9581, (1995).
- (4) M. Mochizuki and M. Imada, New J. Phys. 6, 154 (2004).
- (5) E. Pavarini, A. Yamasaki, J. Nuss, and O.K. Andersen, New J. Phys. 7, 188 (2005).
- (6) A.C. Komarek, H. Roth, M. Cwik, W.-D. Stein, J. Baier, M. Kriener, F. Bourré , T. Lorenz, and M. Braden, Phys. Rev. B 75, 224402, (2007).
- (7) J. Akimitsu, H. Ishikawa, N. Eguchi, T. Miyano, M. Nishi, and K. Kakurai, J. Phys. Soc. Jpn. 70, 3475 (2001).
- (8) F. Iga, M Tsubota, M. Sawada, H.B. Huang, S. Kura, M. Takemura, K. Yaji, M. Nagira, A. Kimura, T. Jo, T. Takabatake, H. Namatame, and M. Taniguchi, Phys. Rev. Lett. 93, 257207, (2004).
- (9) H.D. Zhou and J.B. Goodenough, Phys. Rev. B 71, 184431 (2005).
- (10) G. Khaliullin and S. Okamoto, Phys. Rev. B 68, 205109, (2003).
- (11) L. Craco, S. Leoni, and E. Müller-Hartmann, Phys. Rev. B 74, 155128, (2006).
- (12) S. Okatov, A. Poteryaev, and A. Lichtensein, Eur phys. Lett. 70, 499, (2005).
- (13) I.V. Solovyev, Phys. Rev. B 74, 054412, (2006).
- (14) C. Ulrich, G. Khaliullin, S. Okamoto, M. Reehuis, A. Ivanov, H. He, Y. Taguchi, Y. Tokura, and B. Keimer, Phys. Rev. Lett. 89, 167202, (2002).
- (15) H. Maletta, J. Appl. Phys. 53, 2185, (1982).
- (16) H. Maletta and W. Zinn, Handbook of the Physics and Chemistry of Rare Earth, Vol. 12, p. 213, edited by K.A. Gschneidner, L. Eyring, (Elsevier, 1989).
- (17) N.N. Kovaleva, A.V. Boris, P. Yordanov, A. Maljuk, E. Brücher, J. Strempfer, M. Konuma, I. Zegkinoglou, C. Bernhard, A.M. Stoneham, and B. Keimer, Phys. Rev. B 76, 155125 (2007).
- (18) C. Meingast, B. Blank, H. Bürkle, B. Obst, T. Wolf, H. Wühl, V. Selvamanickam, and K. Salama, Phys. Rev. B 41, 11299, (1990).
- (19) R. Pott and R. Schefzyk, J. Phys. E 16, 444 (1983).
- (20) U. Köbler and K. J. Fischer, Z. Phys. B 20, 391, (1975).
- (21) M. Tsubota, F. Iga, T. Takabatake, N. Kikugawa, T. Suzuki, I. Oguro, H. Kawanaka, and H. Bando, Physica B 281-282, 622 (2000).
- (22) J.D. Garret and J.E Greedan: Inorg. Chem. 20, 1025 (1981).
- (23) N. Tsuji, M. Ito, H. Sakurai, K. Suzuki, K. Tanaka, K. Kitani, H. Adachi, H. Kawata, A. Koizumi, H. Nakao, Y. Murakami, Y. Taguchi, and Y. Tokura, J. Phys. Soc. Japan 77, 023705 (2008).
- (24) Well below the ordering temperature, ungapped ferromagnetic spin waves should lead to a contribution to the specific heat and thermal expansion, while ungapped antiferromagnetic spin waves should lead to a contribution ( is the dimensionality of exchange). If there were the two kinds of branches in the low-energy excitations (strong ferromagnetic and weak antiferromagnetic-like spin waves), then two kinds of contributions should be present in both the specific heat and thermal expansion. In this case, the ferromagnetic contribution should dominate the specific heat because it has a higher intensity. Since the thermal expansion is related to the pressure dependence of the entropy, it is dominated by the most pressure-dependent energy scales. This means that weak antiferromagnetic-like spin waves could dominate the low-temperature thermal expansion if they were associated with a strongly pressure-dependent energy scale.
- (25) A. Arrott and J.E. Noakes, Phys. Rev. Lett. 19, 786, (1967).
- (26) In a limit with no domain effect and with , Equation (1) implies that for and for .
- (27) M.F. Collins, Magnetic critical scattering (Oxford University Press, New York, 1989).
- (28) J.-G. Cheng, Y. Sui, J.-S. Zhou, J. B. Goodenough, and W. H. Su, Phys. Rev. Lett. 101, 087205 (2008).
- (29) W. Knafo, C. Meingast, S. Sakarya, N.H. van Dijk, A. de Visser, E. Brück, Y. Huang, H. Rakoto, J.-M. Broto, and H. v. Löhneysen, to be published (arXiv:0807.4411).
- (30) K.P. Belov, Fiz. Metall. Metalloced. 2, 447 (1956).
- (31) For symmetry reasons, the thermal expansion coefficient of a cubic system does not depend on the direction of the measured length from which it is derived.
- (32) A. Kornblit, G. Ahlers, and E. Buehler, Phys. Rev. B 17, 282, (1978).
- (33) J. Wosnitza and H. v. Löhneysen, Europhys. Lett. 10, 381 (1989).
- (34) P. Böni, M. Hennion, and J.L. Martínez, Phys. Rev. B 52, 10142, (1995).
- (35) P. Bloembergen, Physica 85B, 51 (1977).
- (36) W. Knafo, C. Meingast, K. Grube, S. Drobnik, P. Popovich, P. Schweiss, P. Adelmann, Th. Wolf, and H. v. Löhneysen, Phys. Rev. Lett. 99, 137206 (2007).
- (37) W. Knafo, C. Meingast, A. Inaba, Th. Wolf, and H. v. Löhneysen, J. Phys.: Condens. Matter 20, 335208 (2008).
- (38) T. Moriya and T. Takimoto, J. Phys. Soc. Japan 64, 960 (1995).
- (39) Y. Takahashi and T. Kanomata, Mater. Trans. 47, 460 (2006).
- (40) J. Hemberger, H.-A. Krug von Nidda, V. Fritsch, J. Deisenhofer, S. Lobina, T. Rudolf, P. Lukenheimer, F. Lichtenberg, A. Loidl, D. Bruns, and B. Büchner, Phys. Rev. Lett. 91, 066403, (2003).
- (41) C. Ulrich, A. Gössling, M. Grüninger, M. Guennou, H. Roth, M. Cwik, T. Lorenz, G. Khaliullin, and B. Keimer, Phys. Rev. Lett. 97, 157401, (2006).
- (42) C. Ulrich, G. Ghiringhelli, A. Piazzalunga, L. Braicovich, N. B. Brookes, H. Roth, T. Lorenz, and B. Keimer, Phys. Rev. B 77, 113102, (2008).
- (43) In an undistorted perovskite structure, the lattice parameters , , and of the orthorhombic unit cell are related to the lattice parameter of the cubic unit cell by .
- (44) In YTiO3, elongations by 3 % of the octahedra were explained by a Jahn-Teller effect in Ref. mochizuki04, ; pavarini05, ; akimitsu01, ; iga04, . In the non-Jahn-Teller LaFeO3 and YFeO3, but also in LaTiO3, elongations, by about 1 %, were reported in Ref. komarek07, ; duboulay95, ; zhou08, and are presumably consequences from the GdFeO3-type distortion.
- (45) D.A. MacLean, H-N NG, and J.E. Greedan, J. Solid State Chem. 30, 35 (1979).
- (46) D. du Boulay, E.N. Maslen, V.A. Streltsov, and N. Ishizawa, Acta Cryst. B 51, 921 (1995).
- (47) J.-S. Zhou and J. B. Goodenough, Phys. Rev. B 77, 132104 (2008).
- (48) M. Marezio, J.P. Remeika, and P.D. Dernier, Acta Cryst. B 26, 2008 (1970).
- (49) R.D. Shannon, Acta Cryst. A 32, 751 (1976).
- (50) J. Geck, P. Wochner, S. Kiele, R. Klingeler, A. Revcolevschi, M. v. Zimmermann, B. Büchner, and P. Reutler, New J. Phys. 6, 152 (2004).
- (51) , where (cf. Fig. 2 (a)), and where , , and were extracted from diffraction measurements at room temperature kovaleva07 .