Compact groups in theory and practice - III. Compact groups of galaxies in the Sixth Data Release of the Sloan Digital Sky Survey
Abstract
We present the largest publicly available catalogue of compact groups of galaxies identified using the original selection criteria of Hickson, selected from the Sixth Data Release (DR6) of the Sloan Digital Sky Survey (SDSS). We identify 2297 compact groups down to a limiting magnitude of ( groups degree-2), and 74791 compact groups down to a limiting magnitude of ( groups degree-2). This represents of all galaxies in the SDSS DR6 at these magnitude levels. Contamination due to gross photometric errors has been removed from the bright sample of groups, and we estimate it is present in the large sample at the level. Spectroscopic information is available for 4131 galaxies in the bright catalogue (43 % completeness), and we find that the median redshift of these groups is . The median line-of-sight velocity dispersion within the compact groups from the bright catalogue is km s-1and their typical inter-galactic separations are of order kpc. We show that the fraction of groups with interloping galaxies identified as members is in good agreement with the predictions from our previous study of a mock galaxy catalogue, and we demonstrate how to select compact groups such that the interloper fraction is well defined and minimized. This observational dataset is ideal for large statistical studies of compact groups, the role of environment on galaxy evolution, and the effect of galaxy interactions in determining galaxy morphology.
keywords:
catalogues - surveys - galaxies: general - galaxies: interactions1 Introduction
Galaxies cluster on all scales, and a basic tenet of the CDM cosmological paradigm is that structure formation is hierarchical. Consequently, both weak and strong galaxy interactions are expected to be part of the typical life-cycle of a galaxy, and are believed to be among the main drivers in determining a galaxy’s star formation history, chemical evolution and morphology.
The majority of galaxies at are not found in rich environments and, while many are members of loose groups with a low velocity dispersion, few have nearby large companions with which they are interacting. In contrast, galaxy clusters have a high galaxy number density. However, the considerable mass of these structures means that their velocity dispersion is of order km s-1, and thus individual galaxy-galaxy mergers are rare. On the other hand, compact groups (CGs) of galaxies generally have the low velocity dispersions typical of galaxy groups, but with galaxy-galaxy separations small enough for interactions to be significant (e.g., Hickson 1997 and references therein).
Compact groups of galaxies were first quantitatively defined by Hickson (1982), and there now exist several catalogues of compact groups identified using a variety of criteria (e.g., the Digitized POSS CG catalog, Iovino et al. 2003; the Southern CG catalogue, Prandoni et al. 1994; Iovino 2002; CGs in the UZC galaxy catalogue, Focardi & Kelm 2002; the CfA2 redshift survey, Barton et al. 1996; the Las Campanas redshift survey, Allam & Tucker 2000; the SDSS Commissioning Data, Lee et al. 2004). The identification of genuine groups with only a few members is a difficult problem, and considerable effort has been spent on determining the three dimensional properties of the identified systems (particularly the Hickson Compact Groups) and the effect of interlopers (e.g., Mamon 1986; Hickson & Rood 1988; Walke & Mamon 1989; Hernquist et al. 1995; Ponman et al. 1996).
In this series of papers, we are conducting a homogeneous and systematic study of compact groups using a combination of theoretical and observational galaxy catalogues to provide a statistically-powerful platform from which to probe the effect of galaxy interactions on all aspects of galaxy evolution. In the first paper of this series (McConnachie et al. 2008, hereafter Paper I), we identified compact groups in a mock catalogue constructed from the Millennium Simulation (Springel et al. 2005; De Lucia & Blaizot 2007) and developed a robust understanding of their spatial and dynamical properties. This allowed us to refine the compact group selection criteria to more efficiently identify these systems and understand the sources of contamination in any observed sample. In the second paper of this series (Brasseur et al. 2008, hereafter Paper II), we compared the physical properties of compact group galaxies in our mock catalogue to previous observational studies. We demonstrated consistency with these earlier studies, and we concluded that interloping galaxies misidentified as compact group members have potentially affected our understanding of the influence of interactions on galaxy evolution and morphology.
In this paper, the third in the series, we create the largest observational catalogue of compact group galaxies to date by identifying all such groups in the Sloan Digital Sky Survey Data Release 6, consisting of more than 29 million galaxies to a limiting magnitude of . We make the resulting catalogue of compact groups publicly available through online tables associated with this paper. This catalogue is ideal for large statistical studies of compact groups, the role of environment on galaxy evolution, and the effect of galaxy interactions in determining galaxy morphology. Section 2 details our procedure for the identification of compact groups, Section 3 presents some of the basic observable properties of these systems, and Section 4 summarises our results.
2 Compact Group Finding in SDSS DR6
2.1 Compact group selection criteria
Hickson (1982) define a CG as a group of galaxies with projected properties such that
-
1.
;
-
2.
;
-
3.
mags arcsec-2.
is the number of galaxies within 3 magnitudes of the brightest galaxy and is the effective surface brightness of these galaxies, where the total flux of the galaxies is averaged over the smallest circle which contains their geometric centres and has an angular diameter . is the angular diameter of the largest concentric circle which contains no additional galaxies in this magnitude range or brighter. All magnitudes and surface brightnesses are measured in the band. We hereafter refer to these criteria collectively as the ‘Hickson criteria’.
Since the Hickson criteria were first introduced, there has been considerable debate regarding the physical nature of the galaxy associations identified (e.g., Mamon 1986; Hickson & Rood 1988; Walke & Mamon 1989), and determining the three dimensional reality of systems identified as compact groups has remained a focus of theoretical and observational study (e.g., Hernquist et al. 1995; Ponman et al. 1996). To address this issue, in Paper I of this series, we applied the Hickson criteria to an all-sky mock galaxy catalogue, with a limiting magnitude of , to determine the physical reality of the systems that these criteria identify. We found that the identified galaxy associations preferentially had a three-dimensional linking length, kpc (comoving, where km s-1Mpc-1). Defined in this way, % of all the identified galaxy associations were “genuine” compact groups, while the remaining systems were found to contain one or more interloping galaxies and were treated as contamination. We found that this physically well-defined sample of genuine compact groups could be identified with greatly reduced levels of contamination by modifying the original Hickson criteria to select more isolated groups and higher surface brightness groups: by changing the latter from to and mags arcsec-2, the contamination rates decrease from % to 57%, 44% and 33%, respectively. This is in general agreement with the search strategies adopted by some earlier surveys for compact groups (e.g., Iovino et al. 2003; Lee et al. 2004) which modified these criteria to try to reduce contamination.
In what follows, we apply the Hickson criteria in their original form to create our main compact group catalogues. Sub-catalogues can be created from this publicly-available resource, with different cuts applied in, for example, surface brightness, isolation or brightest members, depending upon the requirements of the specific project being undertaken (e.g., statistical size of dataset versus expected contamination rates).
2.2 The SDSS DR6 galaxy catalogue
The SDSS DR6 (Adelman-McCarthy et al. 2008) catalogue contains photometric parameters for million unique objects (stellar and galactic) over degrees2 (% of the sky), of which approximately 1.27 million objects have associated spectra. As such, SDSS DR6 is presently the largest publically available photometric and spectroscopic dataset of galaxies.
Some previous searches for compact groups of galaxies have identified compact groups in spectroscopic galaxy catalogues through linking-length analyses in projection and redshift space (following Huchra & Geller 1982; e.g., the CfA2 redshift survey, Barton et al. 1996; the Las Campanas redshift survey, Allam & Tucker 2000; the UZC galaxy catalogue, Focardi & Kelm 2002; the SDSS DR5 and DR6, Deng et al. 2007, 2008). However, spectroscopic galaxy catalogues are necessarily much smaller than corresponding photometric catalogues, and one of the main motivations for this work is to obtain a statistically large sample of compact groups for subsequent study. Further, compact groups generally have small angular extent ( arcmin), and the SDSS suffers from fiber collisions for objects which are very close together (Strauss et al. 2002), meaning that not all members of a compact group can be expected to possess redshift information. We therefore choose not to use the spectroscopic catalogue for our compact group search, and instead identify compact groups based upon their projected photometric properties.
We extract all objects identified as a galaxy from the SDSS DR6 catalogue, imposing a bright-end limit on the -band magnitude at , since the automated de-blending of galaxies is known to become unreliable above this limit (Strauss et al. 2002). We do not consider any objects which have been flagged as “SATURATED” and/or “DEBLENDED_AS_PSF”. The former removes all objects which appear saturated, implying that their photometric parameters are unreliable. The latter removes any point sources initially identified as part of larger photometric structures; they are therefore unlikely to be galactic in nature. The exclusion of galaxies with either of these two flags decreases the size of our dataset by .
We construct two different datasets from SDSS DR6, corresponding to two different faint-end magnitude limits of and . The former is identical to the magnitude limit of the mock galaxy catalogue discussed in Papers I and II, and ensures that the observational and mock catalogues can be robustly compared. The latter corresponds to a level above which photometric completeness and star-galaxy separation are reliable (Lupton et al. 2001; Abazajian et al. 2004), and ensures a large reliable dataset for statistical studies. All magnitudes are corrected for foreground Galactic extinction.
Our final galaxy catalogue (hereafter referred to as Catalogue A) has 1 107 622 members. Our final galaxy catalogue (hereafter referred to as Catalogue B) has 29 065 010 members.
2.3 Application of the search algorithm
We apply a search algorithm for compact groups by considering each galaxy in the magnitude-limited catalogues in turn. The galaxies in the immediate vicinity of the target galaxy (selected within a very generous 1 degree radius from the target galaxy) are initially considered as possible group members. The geometric centre of the group, its radius, magnitude range, surface brightness and distance to the nearest non-member galaxy in the appropriate magnitude range, are calculated. This procedure is repeated, with the most distant member galaxy from the target galaxy being eliminated each round, until a group of galaxies is found which satisfies the Hickson criteria. Failing this, if fewer than 4 galaxies remain in the group, we start the procedure afresh by considering the next galaxy in the catalogue (unless that galaxy has been determined to be a member of a previous compact group). This is an identical procedure to that which was applied to the mock catalogue in Paper I.
To speed up this computationally intensive algorithm, Catalogue B is split into 34 sub-areas and the algorithm applied separately to each sub-area. Catalogue A is split into 5 sub-areas. Compact groups which happen to lie on the borders of these sub-areas could conceivably elude detection. However, the maximum diameter of our compact groups is found to be arcmin and so only groups lying within a negligible area compared to the total survey area will not be detected.
In each dataset we identify all groups irrespective of the magnitude of the brightest galaxy; for groups where the brightest member is less than 3 magnitudes brighter than the magnitude limit of the catalogue, this means that the isolation criteria may not be met when nearby galaxies fainter than the magnitude limit of the catalogue are considered. This relaxation of the original Hickson criteria increases the number of groups identified significantly and allows for direct comparisons with the mock catalogue studied in Paper I and II which uses the same selection criteria.
In total, we initially identify 3108 compact groups of galaxies in Catalogue A and 74791 compact groups in Catalogue B, consisting of a total of 13233 and 313508 individual objects, respectively.
2.4 Contamination and Health Warnings
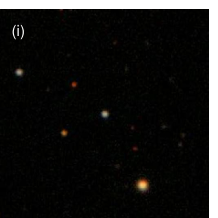
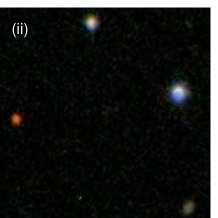
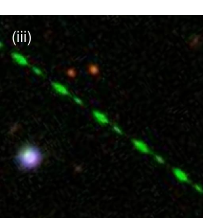
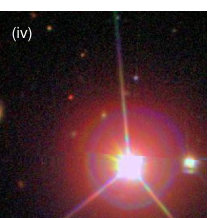
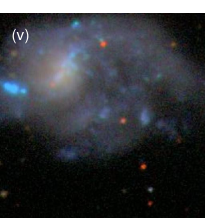
Obvious contamination in the compact group catalogues arises as a result of errors in the photometric galaxy catalogue on which the search is conducted. In each panel of Figure 1 is an example of a source of contamination for this study: (i) some objects which are classified as galaxies by the SDSS classification algorithm appear stellar on visual inspection; (ii) some objects are classified as reasonably bright sources but on inspection it is obvious that the magnitude assigned is grossly incorrect; (iii) fragments of satellite trails are occasionally classified as galaxies; (iv) some objects are found very close to saturated objects and have unreliable photometry. The largest source of contamination for this study, however, comes from (v) incorrect de-blending of extended galaxies into many smaller sources subsequently identified as galaxies.
Note that when discussing contamination, we do not at this stage consider redshift information for galaxies in our groups for which spectroscopic data is available; we consider only the photometric properties from which the groups were identified. Spectroscopic data and the identification of interloping groups with discordant redshift information are considered in detail in Section 3.
2.4.1 Groups in Catalogue A
To remove the sources of contamination from groups in Catalogue A, AWM, DLP and SLE independently visually inspected all 13233 objects belonging to groups in Catalogue A and recorded their findings. If each member of a group appeared galactic in nature, and did not appear to have any gross errors in its band photometry, then the group was marked as “genuine”; if one or more members of a group appeared to have been incorrectly classified as galactic, or the band magnitude of one or more members appeared grossly incorrect, the group was marked as “spurious”; if it was unclear if a group was genuine or not, it was marked “for further inspection”. This was done independently by the three co-authors and, once completed, the three sets of results were collated.
All groups marked as “genuine” by all three co-authors were classified as genuine and kept in the group catalogue; all groups marked as “spurious” by all three co-authors were accepted as spurious and rejected from the catalogue; any groups where the co-authors were not unanimous in their independent classifications were re-inspected and kept or rejected from the catalogue depending on the result of this re-inspection; any group marked as “for further inspection” by any co-author was re-inspected, and kept or rejected from the catalogue depending on the result of this re-inspection. In addition, a few groups were found to contain a galaxy brighter than the bright-end limit of the catalogue. These few groups were additionally removed from the sample.
The final list of groups from Catalogue A contains 2297 compact groups (9713 galaxies). Thus 26% of the groups in Catalogue A originally identified by our algorithm as a compact group in SDSS DR6 were found to contain a member or member(s) for which the automated photometric classification procedure was flawed, usually in one of the ways indicated in Figure 1 (over half of all contamination was due to (v) incorrect deblending, approximately one-third was due to (ii) grossly incorrect magnitudes, and the remaining fraction was due to the other types of contamination). However, due to the independent visual inspection of all members of groups in Catalogue A by three different co-authors, the level of contamination in the final version of the group catalogue is negligible.
2.4.2 Groups in Catalogue B
We identified 313508 individual objects belonging to groups found in Catalogue B. It is impractical to visually inspect each object in the same way as above to determine if each group is genuine. Instead, we seek to quantify the contamination fraction by selecting a random 1500 compact groups and visually inspecting each member (6252 individual objects).
Of the 1500 compact groups inspected, appear to contain a member or members which had been incorrectly classified by the SDSS DR6 automated algorithms. Thus, we estimate that the groups identified in Catalogue B contain contamination at the 14 % level. This is considerably lower than for Catalogue A, and reflects the fact that Catalogue B contains a smaller fraction of very bright galaxies (for which the de-blending algorithm runs into difficulty and which provides the primary source of contamination). Among the groups in Catalogue B containing bright galaxies, the contamination level can be expected to be similar to the initial contamination level of groups in Catalogue A. We have additionally flagged those groups in Catalogue B which contain objects which belong to groups originally identified in Catalogue A and which were subsequently classified as contamination (Section 2.5).
The final list of groups from Catalogue B contains 74791 compact groups (313508 galaxies) and has an estimated contamination fraction of .
We emphasise that the photometric parameterisation of all the objects in our published catalogues of compact groups is from the main SDSS DR6 reduction. Any errors in the SDSS DR6 photometric reduction procedure will therefore propagate through to the compact group catalogues. Any errors not discussed above which exist in the SDSS DR6 reduction will potentially also exist in the compact group catalogue. The final list of groups from Catalogue A only contains bright galaxies, , with negligible contamination due to gross photometric errors. The list of groups from Catalogue B is much larger and includes galaxies down to and has contamination due to poor photometric classification at the 14% level. As discussed in Section 2.2, groups are selected irrespective of the magnitude of their brightest member galaxy, and for groups where the brightest member is less than 3 magnitudes brighter than the magnitude limit of the catalogue, this means that the strict Hickson isolation criteria may not be met when nearby galaxies fainter than the magnitude limit of the catalogue are considered. For groups from Catalogue A, the brightest member galaxy has in 189 groups (8%); for groups in Catalogue B, the brightest member galaxy has in 20057 groups (27%).
2.5 Catalogue Format
| ID | (J2000) | (J2000) | |||||||||||
|---|---|---|---|---|---|---|---|---|---|---|---|---|---|
| SDSSCGA00001 | 14 | 49 | 34.3 | +11 | 14 | 53.4 | 4 | 20.991 | 0.22 | 4.63 | 15.01 | 1 | 0.055 |
| SDSSCGA00002 | 2 | 14 | 4.5 | +13 | 18 | 54.3 | 4 | 21.238 | 0.28 | 3.30 | 14.81 | 1 | 0.060 |
| SDSSCGA00003 | 23 | 54 | 13.5 | -10 | 23 | 17.2 | 4 | 21.279 | 0.16 | 5.96 | 16.42 | 1 | 0.079 |
| SDSSCGA00004 | 15 | 25 | 53.7 | +5 | 44 | 17.8 | 4 | 21.501 | 0.16 | 18.64 | 15.82 | 0 | |
| SDSSCGA00005 | 23 | 33 | 23.6 | -1 | 8 | 43.8 | 4 | 21.519 | 0.29 | 5.19 | 14.53 | 1 | 0.091 |
| SDSSCGA00006 | 21 | 40 | 17.4 | -8 | 4 | 11.7 | 4 | 21.566 | 0.14 | 4.31 | 16.84 | 0 | |
| SDSSCGA00007 | 8 | 24 | 31.6 | +20 | 27 | 28.5 | 4 | 21.585 | 0.19 | 9.26 | 15.77 | 2 | 0.109 |
| SDSSCGA00008 | 16 | 10 | 2.6 | +5 | 54 | 53.5 | 4 | 21.747 | 0.31 | 3.74 | 14.89 | 1 | 0.065 |
| SDSSCGA00009 | 12 | 3 | 12.9 | +57 | 53 | 39.2 | 4 | 21.755 | 0.32 | 7.84 | 14.95 | 2 | 0.034 |
| SDSSCGA00010 | 16 | 26 | 50.4 | +25 | 53 | 34.7 | 4 | 21.913 | 0.20 | 7.58 | 16.01 | 2 | 0.111 |
| SDSSCGA00011 | 16 | 21 | 56.5 | +25 | 41 | 20.1 | 4 | 22.054 | 0.21 | 5.84 | 16.48 | 3 | 0.100 |
| SDSSCGA00012 | 7 | 44 | 42.7 | +16 | 55 | 21.6 | 4 | 22.130 | 0.29 | 3.40 | 15.36 | 0 | |
| ID | (J2000) | (J2000) | |||||||||||
|---|---|---|---|---|---|---|---|---|---|---|---|---|---|
| SDSSCGB00001 | 14 | 12 | 15.8 | +35 | 50 | 59.0 | 4 | 19.730 | 0.08 | 14.67 | 16.01 | 1 | 0.059 |
| SDSSCGB00002 | 16 | 15 | 45.9 | +54 | 40 | 19.6 | 4 | 19.791 | 0.10 | 48.11 | 15.35 | 0 | |
| SDSSCGB00003 | 13 | 25 | 10.4 | +17 | 3 | 8.0 | 4 | 20.333 | 0.13 | 35.94 | 15.05 | 0 | |
| SDSSCGB00004 | 11 | 44 | 12.1 | +27 | 0 | 12.0 | 4 | 20.347 | 0.09 | 7.32 | 16.41 | 1 | 0.093 |
| SDSSCGB00005 | 7 | 55 | 30.4 | +10 | 25 | 51.8 | 4 | 20.366 | 0.14 | 17.32 | 15.11 | 0 | |
| SDSSCGB00006 | 9 | 4 | 34.9 | +14 | 35 | 42.4 | 5 | 20.547 | 0.19 | 15.32 | 15.14 | 1 | 0.050 |
| SDSSCGB00007 | 13 | 54 | 19.5 | +7 | 23 | 8.3 | 4 | 20.577 | 0.12 | 13.62 | 15.62 | 1 | 0.075 |
| SDSSCGB00008 | 11 | 4 | 36.7 | +6 | 23 | 46.1 | 4 | 20.725 | 0.13 | 24.23 | 15.43 | 1 | 0.032 |
| SDSSCGB00009 | 16 | 28 | 28.3 | +41 | 13 | 6.2 | 4 | 20.749 | 0.21 | 17.08 | 14.61 | 1 | 0.028 |
| SDSSCGB00010 | 16 | 13 | 18.9 | +50 | 2 | 12.7 | 4 | 20.805 | 0.04 | 7.93 | 18.78 | 0 | |
| SDSSCGB00011 | 14 | 29 | 17.4 | -3 | 9 | 13.3 | 4 | 20.889 | 0.16 | 3.33 | 16.03 | 1 | 0.082 |
| SDSSCGB00012 | 13 | 39 | 44.9 | +45 | 39 | 58.9 | 4 | 20.966 | 0.05 | 14.28 | 18.08 | 0 | |
| ID | ObjID (SDSS) | (J2000) | (J2000) | SpecObjID (SDSS) | ||||||||
|---|---|---|---|---|---|---|---|---|---|---|---|---|
| SDSSCGA00001.1 | 587736807771078936 | 14 | 49 | 34.5 | +11 | 14 | 53.2 | 15.01 | 0.86 | 0 | ||
| SDSSCGA00001.2 | 587736807771078937 | 14 | 49 | 34.9 | +11 | 14 | 55.2 | 15.29 | 0.82 | 0 | ||
| SDSSCGA00001.3 | 587736807771078935 | 14 | 49 | 34.2 | +11 | 14 | 44.0 | 16.23 | 1.07 | 482677981936877568 | 0.999 | 0.055 |
| SDSSCGA00001.4 | 587736807771078938 | 14 | 49 | 33.6 | +11 | 15 | 1.2 | 17.29 | 0.97 | 0 | ||
| SDSSCGA00002.1 | 587724198822412473 | 2 | 14 | 3.9 | +13 | 18 | 47.2 | 14.81 | 1.08 | 120694126130757632 | 0.999 | 0.060 |
| SDSSCGA00002.2 | 587724198822477903 | 2 | 14 | 5.1 | +13 | 18 | 39.5 | 15.07 | 0.87 | 0 | ||
| SDSSCGA00002.3 | 587724198822477905 | 2 | 14 | 5.0 | +13 | 19 | 2.3 | 15.52 | 1.12 | 0 | ||
| SDSSCGA00002.4 | 587724198822412475 | 2 | 14 | 4.2 | +13 | 19 | 8.1 | 17.71 | 0.68 | 0 | ||
| SDSSCGA00003.1 | 587727225689538694 | 23 | 54 | 13.2 | -10 | 23 | 11.0 | 16.42 | 0.85 | 182901462030876672 | 0.999 | 0.079 |
| SDSSCGA00003.2 | 587727225689538695 | 23 | 54 | 13.5 | -10 | 23 | 8.7 | 16.69 | 1.03 | 0 | ||
| SDSSCGA00003.3 | 587727225689538696 | 23 | 54 | 13.5 | -10 | 23 | 23.6 | 16.77 | 0.81 | 0 | ||
| SDSSCGA00003.4 | 587727225689538697 | 23 | 54 | 13.8 | -10 | 23 | 25.5 | 16.86 | 0.79 | 0 | ||
| SDSSCGA00004.1 | 587730023333625957 | 15 | 25 | 53.9 | +5 | 44 | 9.7 | 15.82 | 0.99 | 0 | ||
| SDSSCGA00004.2 | 587730023333625958 | 15 | 25 | 53.7 | +5 | 44 | 27.7 | 17.20 | 1.09 | 0 | ||
| SDSSCGA00004.3 | 587730023333625960 | 15 | 25 | 53.4 | +5 | 44 | 10.2 | 17.57 | 0.84 | 0 | ||
| SDSSCGA00004.4 | 587730023333625959 | 15 | 25 | 53.8 | +5 | 44 | 23.7 | 17.83 | 0.95 | 0 | ||
| SDSSCGA00005.1 | 588015507655819398 | 23 | 33 | 22.7 | -1 | 8 | 54.9 | 14.53 | 0.97 | 0 | ||
| SDSSCGA00005.2 | 588015507655819395 | 23 | 33 | 24.4 | -1 | 8 | 54.2 | 16.16 | 1.07 | 0 | ||
| SDSSCGA00005.3 | 588015507655819396 | 23 | 33 | 23.6 | -1 | 8 | 35.0 | 16.33 | 1.05 | 108308961144340480 | 1.000 | 0.091 |
| SDSSCGA00005.4 | 588015507655819397 | 23 | 33 | 23.6 | -1 | 8 | 31.0 | 17.04 | 0.84 | 0 | ||
| SDSSCGA00006.1 | 587727213348454817 | 21 | 40 | 17.3 | -8 | 4 | 14.8 | 16.84 | 1.36 | 0 | ||
| SDSSCGA00006.2 | 587727213348454819 | 21 | 40 | 16.9 | -8 | 4 | 8.9 | 16.95 | 0.46 | 0 | ||
| SDSSCGA00006.3 | 587727213348454818 | 21 | 40 | 17.5 | -8 | 4 | 17.4 | 17.22 | 0.83 | 0 | ||
| SDSSCGA00006.4 | 587727213348454820 | 21 | 40 | 17.8 | -8 | 4 | 5.7 | 17.87 | 0.93 | 0 | ||
| SDSSCGA00007.1 | 587739407832580481 | 8 | 24 | 32.1 | +20 | 27 | 26.2 | 15.77 | 1.22 | 586541553271439360 | 1.000 | 0.109 |
| SDSSCGA00007.2 | 587739407832580480 | 8 | 24 | 31.9 | +20 | 27 | 39.4 | 16.77 | 1.18 | 542631292303310848 | 0.998 | 0.110 |
| SDSSCGA00007.3 | 587739407832580484 | 8 | 24 | 31.5 | +20 | 27 | 27.8 | 17.01 | 1.59 | 0 | ||
| SDSSCGA00007.4 | 587739407832580482 | 8 | 24 | 31.1 | +20 | 27 | 20.7 | 17.48 | 0.98 | 0 | ||
| SDSSCGA00008.1 | 587736543103877672 | 16 | 10 | 2.5 | +5 | 55 | 1.4 | 14.89 | 0.81 | 513360322849931264 | 0.999 | 0.065 |
| SDSSCGA00008.2 | 587736543103877675 | 16 | 10 | 1.5 | +5 | 54 | 59.2 | 15.74 | 0.96 | 0 | ||
| SDSSCGA00008.3 | 587736543103877673 | 16 | 10 | 3.5 | +5 | 54 | 48.4 | 16.24 | 0.88 | 0 | ||
| SDSSCGA00008.4 | 587736543103877674 | 16 | 10 | 3.1 | +5 | 54 | 45.2 | 16.61 | 1.00 | 0 | ||
| SDSSCGA00009.1 | 587735696979656747 | 12 | 3 | 13.8 | +57 | 53 | 26.0 | 14.95 | 0.56 | 370085969178656768 | 1.000 | 0.034 |
| SDSSCGA00009.2 | 587735696979656750 | 12 | 3 | 12.5 | +57 | 53 | 36.4 | 15.02 | 0.48 | 0 | ||
| SDSSCGA00009.3 | 587735696979656749 | 12 | 3 | 13.4 | +57 | 53 | 53.0 | 16.64 | 0.47 | 369803378328338432 | 0.995 | 0.034 |
| SDSSCGA00009.4 | 587735696979656748 | 12 | 3 | 11.8 | +57 | 53 | 41.2 | 17.34 | 1.64 | 0 | ||
| SDSSCGA00010.1 | 587736920508858742 | 16 | 26 | 50.6 | +25 | 53 | 28.3 | 16.01 | 0.98 | 442988743981268992 | 1.000 | 0.110 |
| SDSSCGA00010.2 | 587736899576725804 | 16 | 26 | 50.4 | +25 | 53 | 39.6 | 16.97 | 1.09 | 0 | ||
| SDSSCGA00010.3 | 587736920508858744 | 16 | 26 | 49.7 | +25 | 53 | 27.8 | 17.32 | 1.09 | 443271293421223936 | 1.000 | 0.112 |
| SDSSCGA00010.4 | 587736899576725805 | 16 | 26 | 50.7 | +25 | 53 | 43.1 | 17.82 | 0.81 | 0 | ||
| SDSSCGA00011.1 | 587736919434789305 | 16 | 21 | 57.1 | +25 | 41 | 29.5 | 16.48 | 0.95 | 443834327290085376 | 1.000 | 0.099 |
| SDSSCGA00011.2 | 587736919434789307 | 16 | 21 | 56.1 | +25 | 41 | 19.1 | 16.76 | 1.11 | 0 | ||
| SDSSCGA00011.3 | 587736919434789306 | 16 | 21 | 56.2 | +25 | 41 | 21.1 | 16.87 | 0.84 | 443271292800466944 | 0.999 | 0.100 |
| SDSSCGA00011.4 | 587736919434789308 | 16 | 21 | 56.5 | +25 | 41 | 10.9 | 17.26 | 0.56 | 443552841290743808 | 0.947 | 0.101 |
| SDSSCGA00012.1 | 587738372204396691 | 7 | 44 | 43.3 | +16 | 55 | 21.3 | 15.36 | 0.92 | 0 | ||
| SDSSCGA00012.2 | 587738372204396692 | 7 | 44 | 42.4 | +16 | 55 | 38.5 | 15.95 | 0.85 | 0 | ||
| SDSSCGA00012.3 | 587738372204396694 | 7 | 44 | 41.9 | +16 | 55 | 20.6 | 17.23 | 0.91 | 0 | ||
| SDSSCGA00012.4 | 587738372204396693 | 7 | 44 | 43.0 | +16 | 55 | 5.8 | 17.73 | 0.86 | 0 | ||
| ID | ObjID (SDSS) | (J2000) | (J2000) | SpecObjID (SDSS) | ||||||||
|---|---|---|---|---|---|---|---|---|---|---|---|---|
| SDSSCGB00001.1 | 588017977829097722 | 14 | 12 | 15.9 | +35 | 50 | 55.3 | 16.01 | 1.18 | 0 | ||
| SDSSCGB00001.2 | 588017977829097728 | 14 | 12 | 15.8 | +35 | 51 | 3.3 | 16.56 | 0.49 | 462691635159891968 | 0.989 | 0.059 |
| SDSSCGB00001.3 | 588017977829097727 | 14 | 12 | 15.5 | +35 | 50 | 59.0 | 16.69 | 0.44 | 0 | ||
| SDSSCGB00001.4 | 588017977829097726 | 14 | 12 | 16.2 | +35 | 50 | 58.6 | 17.07 | 0.11 | 0 | ||
| SDSSCGB00002.1 | 587739849139683368 | 16 | 15 | 45.5 | +54 | 40 | 22.2 | 15.35 | 0.50 | 0 | ||
| SDSSCGB00002.2 | 587739849139683374 | 16 | 15 | 46.2 | +54 | 40 | 17.5 | 16.26 | 0.51 | 0 | ||
| SDSSCGB00002.3 | 587739849139683371 | 16 | 15 | 46.3 | +54 | 40 | 22.5 | 16.34 | 0.74 | 0 | ||
| SDSSCGB00002.4 | 587739849139683372 | 16 | 15 | 45.6 | +54 | 40 | 16.3 | 17.59 | 0.42 | 0 | ||
| SDSSCGB00003.1 | 587742903404986565 | 13 | 25 | 10.3 | +17 | 3 | 12.0 | 15.05 | 0.44 | 0 | ||
| SDSSCGB00003.2 | 587742903404986567 | 13 | 25 | 10.4 | +17 | 3 | 0.9 | 16.60 | 0.14 | 0 | ||
| SDSSCGB00003.3 | 587742903404986570 | 13 | 25 | 10.9 | +17 | 3 | 8.4 | 16.92 | 0.45 | 0 | ||
| SDSSCGB00003.4 | 587742903404986568 | 13 | 25 | 9.9 | +17 | 3 | 10.8 | 17.32 | 0.45 | 0 | ||
| SDSSCGB00004.1 | 587741601491714194 | 11 | 44 | 12.2 | +27 | 0 | 8.1 | 16.41 | 0.77 | 0 | ||
| SDSSCGB00004.2 | 587741708883329169 | 11 | 44 | 12.3 | +27 | 0 | 11.8 | 17.12 | 0.78 | 0 | ||
| SDSSCGB00004.3 | 587741708883329171 | 11 | 44 | 11.8 | +27 | 0 | 11.4 | 17.27 | 0.31 | 625386958805270528 | 0.978 | 0.093 |
| SDSSCGB00004.4 | 587741708883329170 | 11 | 44 | 12.3 | +27 | 0 | 16.6 | 18.02 | 0.14 | 0 | ||
| SDSSCGB00005.1 | 587741816231690635 | 7 | 55 | 29.9 | +10 | 25 | 51.9 | 15.11 | 0.92 | 0 | ||
| SDSSCGB00005.2 | 587741816231690639 | 7 | 55 | 30.2 | +10 | 25 | 46.5 | 15.81 | 0.35 | 0 | ||
| SDSSCGB00005.3 | 587741816231690637 | 7 | 55 | 30.7 | +10 | 25 | 51.4 | 16.57 | 1.11 | 0 | ||
| SDSSCGB00005.4 | 587741816231690644 | 7 | 55 | 30.9 | +10 | 25 | 57.4 | 17.96 | 0.32 | 0 | ||
| SDSSCGB00006.1 | 587744727686381596 | 9 | 4 | 34.8 | +14 | 35 | 36.3 | 15.14 | 0.59 | 0 | ||
| SDSSCGB00006.2 | 587744727686381602 | 9 | 4 | 34.4 | +14 | 35 | 39.4 | 15.38 | 0.13 | 685341276190539776 | 0.993 | 0.050 |
| SDSSCGB00006.3 | 587744727686381597 | 9 | 4 | 34.6 | +14 | 35 | 52.4 | 15.51 | 0.76 | 0 | ||
| SDSSCGB00006.4 | 587744727686381607 | 9 | 4 | 35.3 | +14 | 35 | 38.8 | 17.40 | 1.55 | 0 | ||
| SDSSCGB00006.5 | 587744727686381610 | 9 | 4 | 35.5 | +14 | 35 | 45.1 | 17.49 | 0.16 | 0 | ||
| SDSSCGB00007.1 | 588017726021369993 | 13 | 54 | 19.7 | +7 | 23 | 12.4 | 15.62 | 0.89 | 508293726485872640 | 0.999 | 0.075 |
| SDSSCGB00007.2 | 588017726021369994 | 13 | 54 | 19.1 | +7 | 23 | 3.7 | 16.59 | 0.87 | 0 | ||
| SDSSCGB00007.3 | 588017726021369995 | 13 | 54 | 19.4 | +7 | 23 | 15.3 | 17.81 | 0.59 | 0 | ||
| SDSSCGB00007.4 | 588017726021369996 | 13 | 54 | 19.7 | +7 | 23 | 2.1 | 18.51 | 0.67 | 0 | ||
| SDSSCGB00008.1 | 587732577238712466 | 11 | 4 | 36.9 | +6 | 23 | 42.1 | 15.43 | 0.39 | 0 | ||
| SDSSCGB00008.2 | 587732577238712469 | 11 | 4 | 36.6 | +6 | 23 | 51.9 | 17.53 | 0.20 | 282545493425258496 | 0.987 | 0.032 |
| SDSSCGB00008.3 | 587732577238712473 | 11 | 4 | 36.2 | +6 | 23 | 45.3 | 17.63 | -0.04 | 0 | ||
| SDSSCGB00008.4 | 587732577238712467 | 11 | 4 | 37.2 | +6 | 23 | 45.2 | 17.70 | 0.07 | 0 | ||
| SDSSCGB00009.1 | 587729652347961399 | 16 | 28 | 27.9 | +41 | 13 | 3.5 | 14.61 | 0.45 | 0 | ||
| SDSSCGB00009.2 | 587729652347961408 | 16 | 28 | 28.7 | +41 | 12 | 55.6 | 16.10 | -0.10 | 0 | ||
| SDSSCGB00009.3 | 587729652347961407 | 16 | 28 | 28.6 | +41 | 13 | 11.8 | 16.15 | -0.00 | 0 | ||
| SDSSCGB00009.4 | 587729652347961398 | 16 | 28 | 28.0 | +41 | 13 | 13.7 | 16.26 | 0.08 | 229908547784146944 | 0.988 | 0.028 |
| SDSSCGB00010.1 | 587742888898920722 | 16 | 13 | 18.9 | +50 | 2 | 15.1 | 18.78 | 1.42 | 0 | ||
| SDSSCGB00010.2 | 587729226885497049 | 16 | 13 | 18.9 | +50 | 2 | 15.2 | 18.80 | 1.60 | 0 | ||
| SDSSCGB00010.3 | 587742888898920723 | 16 | 13 | 18.9 | +50 | 2 | 10.3 | 19.42 | 1.28 | 0 | ||
| SDSSCGB00010.4 | 587729226885497050 | 16 | 13 | 19.0 | +50 | 2 | 10.3 | 19.58 | 1.17 | 0 | ||
| SDSSCGB00011.1 | 587729776371761364 | 14 | 29 | 17.6 | -3 | 9 | 6.5 | 16.03 | 0.83 | 0 | ||
| SDSSCGB00011.2 | 587729776371761362 | 14 | 29 | 17.7 | -3 | 9 | 21.3 | 16.04 | 0.92 | 0 | ||
| SDSSCGB00011.3 | 587729776371761366 | 14 | 29 | 17.3 | -3 | 9 | 7.5 | 16.42 | 1.01 | 0 | ||
| SDSSCGB00011.4 | 587729776371761363 | 14 | 29 | 16.8 | -3 | 9 | 17.9 | 16.68 | 1.51 | 258619102271111168 | 1.000 | 0.082 |
| SDSSCGB00012.1 | 588298663042941007 | 13 | 39 | 45.1 | +45 | 39 | 58.8 | 18.08 | 0.51 | 0 | ||
| SDSSCGB00012.2 | 588298663042941006 | 13 | 39 | 44.8 | +45 | 39 | 57.8 | 19.16 | 0.70 | 0 | ||
| SDSSCGB00012.3 | 588298663042941005 | 13 | 39 | 44.7 | +45 | 39 | 58.7 | 20.15 | 2.18 | 0 | ||
| SDSSCGB00012.4 | 588298663042941010 | 13 | 39 | 45.0 | +45 | 40 | 0.4 | 20.16 | 0.90 | 0 | ||

Tables 1 and 2 list the properties of compact groups found in Catalogues A and B, respectively. Tables 3 and 4 list the properties of the individual member galaxies for each group in Catalogues A and B, respectively. In each Table, only lines corresponding to the first 12 compact groups in each catalogue are listed. Full electronic versions of these Tables can be downloaded through the MNRAS website.
In Tables 1 and 2, compact groups are listed in order of descending surface brightness (results from Paper I suggest that groups with a higher surface brightness are less likely to contain interlopers). The columns of Tables 1 and 2 are as follows:
-
•
Column 1 - Group ID (11 characters) Ascending numerical order (5 digit numbers) prefixed by “SDSSCGA/B” depending on the catalogue;
-
•
Column 2, 3, 4 - Right Ascension (J2000). Refers to geometrical centre of group (hexadecimal format);
-
•
Column 5, 6, 7 - Declination (J2000). Refers to geometrical centre of group (hexadecimal format);
-
•
Column 8 - Number of members in the group, ;
-
•
Column 9 - Group surface brightness in the band, defined by the Hickson criteria (mags arcsec-2);
-
•
Column 10 - Group radius, defined by the Hickson criteria (arcmins);
-
•
Column 11 - Distance to the next nearest non-member galaxy in the galaxy catalogue, in the appropriate magnitude range, measured from the group centre in units of the group radius;
-
•
Column 12 - band apparent Petrosian magnitude of brightest group galaxy, corrected for foreground Galactic extinction;
-
•
Column 13 - Number of galaxies in the group with a spectroscopic redshift;
-
•
Column 14 - Redshift of group (if available). If only one galaxy has a spectroscopic redshift, then that is adopted as the group redshift. If multiple members of the group have redshifts, the mean redshift is listed. Only considers groups with km s-1 (see Section 3.1.2 for definition). Only considers galaxies with (see below for definition);
-
•
Column 15 (online Table 2 only). Flag indicating if the group contains members which were originally identified as belonging to groups in Catalogue A which were subsequently identified as containing contamination ( if true, if false).
The columns of Tables 3 and 4 are as follows:
-
•
Column 1 - Galaxy ID in the group catalogue. Format is “”, where “” corresponds to Group ID in Tables 1 and 2 (group order is the same as Tables 1 and 2) and “” is a number from . Galaxies in each group are listed in order of increasing band apparent magnitude;
-
•
Column 2 - SDSS ObjID. Unique identifier of object in the SDSS database which can be used to retrieve all information stored in the SDSS on the galaxy;
-
•
Column 3, 4, 5 - Right Ascension (J2000). Galaxy position (hexadecimal format);
-
•
Column 6, 7, 8 - Declination (J2000). Galaxy position (hexadecimal format);
-
•
Column 9 - band apparent Petrosian magnitude of galaxy, corrected for foreground Galactic extinction;
-
•
Column 10 - colour of galaxy, corrected for foreground Galactic extinction. No correction has been applied;
-
•
Column 11 - SDSS SpecObjID (if available). Unique identifier of the SDSS spectrum for this galaxy;
-
•
Column 12 - SDSS (if applicable). If a spectrum exists for the galaxy, this parameter indicates how reliable the derived redshift is. 0 (poor) 1 (excellent);
-
•
Column 13 - Redshift (if available).
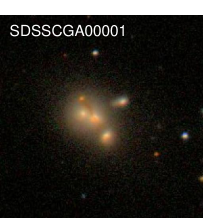
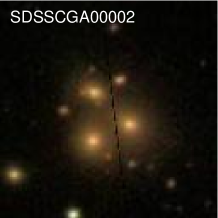
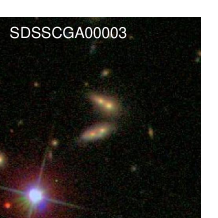
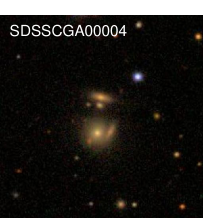
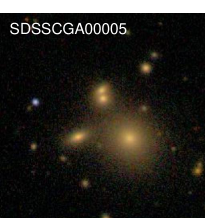
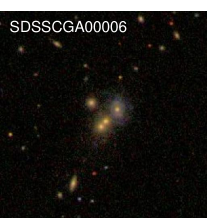
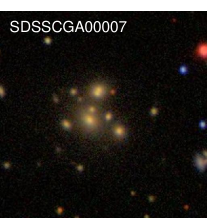
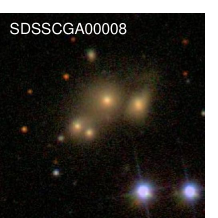
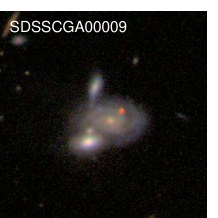
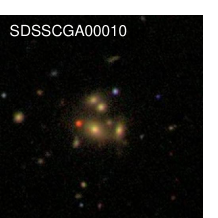
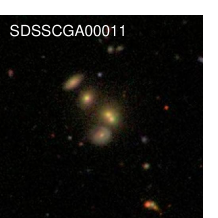
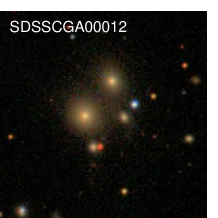
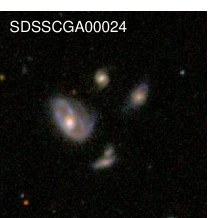
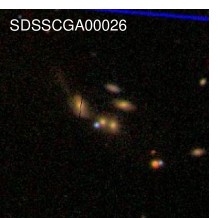
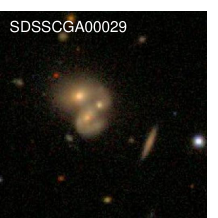
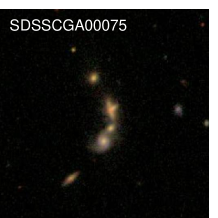
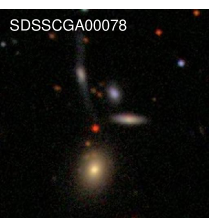
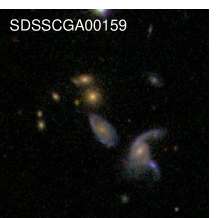
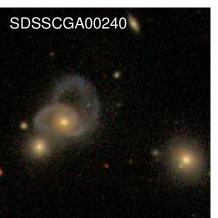
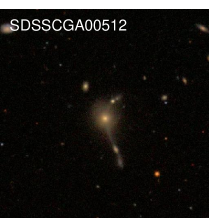
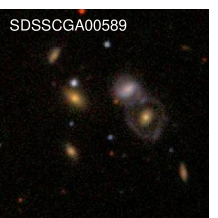
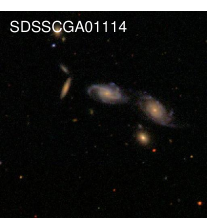
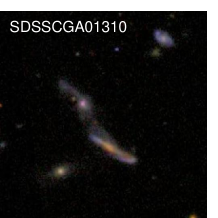
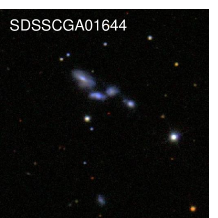
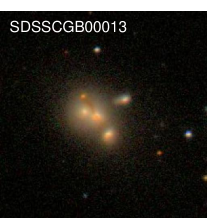
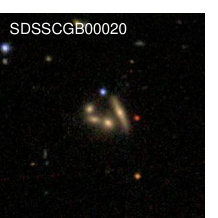
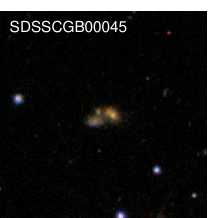
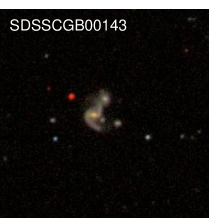
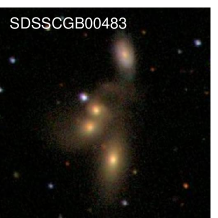
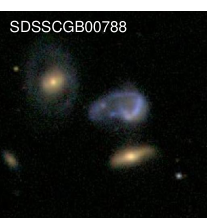
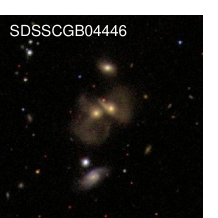
Figure 2 shows images of the twelve compact groups found in Catalogue A with the highest central surface brightnesses. It is striking that these twelve groups are generally dominated by red galaxies. In Paper II, we found that compact group galaxies identified in the mock catalogue were predominantly “red and dead” galaxies. While these brightest groups appear to be consistent with this prediction, it is important to emphasise that bluer, later-type galaxies are present in significant numbers in these catalogues. Figure 3 shows a selection of compact groups which were selected for their visual impact and to show the range and variety of galaxy types that are present in these catalogues.
2.6 Comparison with Lee et al. (2004)
Lee et al. (2004) searched for compact groups of galaxies in the Early Data Release (EDR) of the SDSS (Stoughton et al. 2002) using all galaxies with . They used the Hickson criteria, modified so that only groups with mags arcsec-2 were considered. As an independent check on the success of our search algorithm and the reproducibility of our results, we now determine if Catalogue B contains those groups identified by Lee et al. (2004). However, not all of the Lee et al. groups will be identified in the SDSS DR6 due to differences in the underlying catalogues. In particular,
-
•
the photometric calibration for the SDSS system has been updated between the SDSS EDR and SDSS DR6 (see Adelman-McCarthy et al. 2008 and references therein).
- •
To take the above considerations taken into account, we search the SDSS DR6 for those objects with the best positional coincidence to the individual member galaxies of the Lee et al. (2004) groups, as given in their Table 2. This allows us to derive the photometric properties of the Lee et al. (2004) groups using the SDSS DR6 catalogue. We find that
-
1.
Of the 175 groups (more than 3 members) identified in Lee et al. (2004), good positional matches to objects in the SDSS DR6 (better than 0.5 arcsecs) are found for all members of 164 groups. We therefore do not consider the 11 remaining groups further, since it is not possible for us to have found these groups using the SDSS DR6;
-
2.
Of the remaining 164 groups, 13 groups have at least one member which is best matched to an object flagged as stellar in DR6. Thus we do not examine these 13 groups further;
-
3.
Of the remaining 151 groups, 2 groups have members which are flagged as “DEBLENDED_AS_PSF”. Thus these 2 groups will not be identified in our catalogue (Section 2.2) and we do not consider them further;
-
4.
Of the remaining 149 groups, 1 group has a member with , brighter than our bright-end limit. Thus this group will not be identified in our catalogue and we do not consider it further;
-
5.
Of the remaining 148 groups, 11 have a magnitude range in the band () of greater than 3 magnitudes in the SDSS DR6. Thus these groups will not be identified in our catalogue using the Hickson criteria, and we do not consider them further;
-
6.
Of the remaining 137 groups, 58 do not match the isolation criteria for selection as a compact group using the SDSS DR6. Thus these groups will not be identified in our catalogue and we do not consider them further.
We conclude that, of the original 175 groups identified by Lee et al. (2004), 96 are not identified in SDSS DR6. This is due to a different photometric classification of member objects (and nearby neighbours), which results in a failure of the group to meet the Hickson criteria in our SDSS DR6 galaxy catalogue.
Finally, we cross-correlate the remaining 79 compact groups from Lee et al. (2004) with the groups identified in Catalogue B (Tables 2 and 4). We identify all 79 groups, demonstrating that our procedure for identifying compact groups in SDSS DR6 is consistent with the earlier study using the SDSS EDR.
3 Basic properties of the SDSS DR6 Compact Group Catalogue
| Catalogue A | Catalogue B | |||||||
|---|---|---|---|---|---|---|---|---|
| km s-1 | km s-1 | |||||||
| 500 | 2115 | 500 | 2115 | 60516 | 252805 | 60516 | 252805 | |
| 1797 | 4108 | 1008 | 1915 | 14275 | 16405 | 13414 | 14414 | |
| 1 | 373 | 373 | 373 | 373 | 12537 | 12537 | 12537 | 12537 |
| 2 | 776 | 1552 | 422 | 844 | 1419 | 2838 | 772 | 1544 |
| 3 | 439 | 1317 | 159 | 477 | 251 | 753 | 87 | 261 |
| 4 | 183 | 732 | 49 | 196 | 63 | 252 | 18 | 72 |
| 5 | 23 | 115 | 5 | 25 | 5 | 25 | 0 | 0 |
| 6 | 2 | 12 | 0 | 0 | 0 | 0 | 0 | 0 |
| 7 | 1 | 7 | 0 | 0 | 0 | 0 | 0 | 0 |
| 148 | 613 | 34 | 139 | 54 | 220 | 13 | 52 | |
3.1 Number of galaxies per group

Figure 4 shows the distribution of the number of galaxies per group for Catalogue A (left panel) and Catalogue B (right panel). Blank histograms show the complete samples, whereas the hatched histograms show the distribution for those groups where mags arcsec-2. The fraction of groups which contain galaxies at discordant redshifts (that is, chance line-of-sight alignments rather than physically dense groups) is expected to be greatly reduced for this latter sample. Clearly, the overwhelming majority of groups from both Catalogues A and B have 6 members or less; very few groups in the brighter subsamples have more than 5 members, strongly suggesting that groups more numerous than this contain interlopers, at least in part. If groups with more than 6 genuine members exist, they are intrinsically very rare.
3.2 Group surface brightness

The left panel of Figure 5 shows the band group surface brightness distribution for all groups identified in Catalogue A, and the right panel shows the same for all groups identified in Catalogue B. More groups are found at lower surface brightness; however, as shown in Paper I, brighter groups are more likely to be genuine and not contain any interlopers (see Section 3.3.2 for a more detailed investigation of this point).
3.3 Spectroscopic Information
3.3.1 Spectral Completeness
The compact groups and their member galaxies presented in Tables 1 – 4 were selected based on their photometric properties, in particular their projected positions and band apparent magnitudes. However, the SDSS DR6 has spectroscopic information available for 1.27 million objects, of which 679733 objects are galaxies which satisfy our criteria for inclusion in Catalogue B. Thus, many of the galaxies we identify as being a member of a compact group will have spectroscopic data available.
For the groups identified in Catalogue A, 4131 out of 9713 member galaxies (43 %) have spectroscopic information available, 4108 of which yield a reliable redshift (). For groups identified in Catalogue B, 16566 out of 313508 member galaxies (5 %) have spectroscopic information available, 16405 of which yield a reliable redshift. The fraction of galaxies with spectroscopic data available in Catalogue B is significantly less than in Catalogue A, since Catalogue A contains a higher fraction of brighter galaxies (which are preferentially selected as spectroscopic targets).
3.3.2 Estimate of interloper fractions


Table 5 lists the number of groups, , with redshifts per group, as well as the number of individual galaxies this represents in each case, . We only consider galaxies where . This information is listed for two different cuts in , where we define
| (1) |
, , , and so is a measure of the maximum line-of-sight velocity difference between group members for groups where . The cut km s-1selects only those groups where multiple redshifts (if available) are concordant. This removes groups which contain interloping galaxies which happen to lie along the same line-of-sight. As was demonstrated in Paper II (and assumed in most previous studies of compact groups; e.g. Hickson et al. 1992), few, if any, genuine compact groups are expected to possess members with line-of-sight velocity differences in excess of km s-1.
The blank histogram in the top panel of Figure 6 shows the distribution of for compact groups identified in Catalogue A. The hatched histogram shows the same distribution but with the additional constraint that km s-1. The bottom panel of Figure 6 shows the same distributions but only considers those groups with mags arcsec-2. Results from Paper I suggests that the fraction of identified groups which contain interlopers decreases from 71% for mags arcsec-2 to 44% for mags arcsec-2.
Table 5 and Figure 6 demonstrate that the majority of groups which have redshift measurements for multiple members have discordant redshifts ( in Catalogue A), implying that at least 55 % of identified groups in Catalogue A contain interlopers. For the brighter sub-sample of groups with mags arcsec-2, a smaller fraction of groups with multiple redshifts has discordant redshifts (). These results are qualitatively consistent with the expected contamination rates discussed in Paper I.
The solid lines in Figure 7 show the predicted fraction of interloper-free compact groups recovered as a function of the limiting surface brightness of the groups (calculated in Paper I and listed in Table 1 of that paper). For example, when considering all groups brighter than mags arcsec-2, we expect that 44% of those groups will contain interlopers. For groups from Catalogue A with , the points in Figure 7 shows the fraction with multiple concordant redshifts as a function of the limiting group surface brightness. Vertical error bars show the Poisson uncertainties. The three panels show results for different values of .
Despite the fact that full redshift information (ie., ) is not available for most groups, Figure 7 demonstrates that the predicted interloper fractions from Paper I appear in good agreement with the best estimates for interloper fractions for groups identified in Catalogue A. The observed interloper fraction and the predicted one are in best agreement for higher , since it is the more likely the interloper(s), if present, will have been targeted for spectroscopy. Figure 7 thus presents strong empirical evidence that the selection of groups by their surface brightness can greatly reduce the fraction of interloping galaxies/groups present.
3.3.3 Redshift distribution of groups identified in Catalogue A

Figure 8 shows the mean redshift distribution for all compact groups from Catalogue A with redshift measurements where . Only groups for which km s-1are shown. The top panel shows those groups for which there exists a redshift measurement for at least one galaxy. The lower panel shows those groups for which at least 3 galaxies per group have a redshift measurement. The lower distribution is less likely to contain redshifts of groups with interloping galaxies due to its higher spectroscopic completeness.
The peak (modal) redshift of the groups in each panel of Figure 8 is . The median redshift of all groups with at least one redshift is , while for those with at least 3 concordant redshifts it is (for comparison, the median redshift of the Lee et al. (2004) sample is ). We note that the classical sample of Hickson compact groups (Hickson 1982) have a considerably lower median redshift than these samples, with a median redshift of (Hickson et al. 1992).
A K-S test shows that the distributions in the two panels of Figure 8 are unlikely to have been drawn from the same underlying distribution at the level. In particular, the fraction of groups with in the sample is much less than in the sample. It is therefore probable that all genuine groups found in Catalogue A have , the maximum redshift of groups in the sample.
3.3.4 Velocity dispersions of groups identified in Catalogue A

Figure 9 shows the physical line-of-sight velocity dispersions () for all groups from Catalogue A with (blank and hatched histograms, respectively) with concordant redshift information. A K-S test shows that the two distributions are statistically similar. Although km s-1is required for a group to be included in these histograms, most groups have velocity dispersions significantly smaller than this; the maximum velocity dispersion of groups with is km s-1(395 km s-1). The median velocity dispersion of groups with is km s-1(227 km s-1). These numbers compare favourably to the classical Hickson compact groups, which have a median velocity dispersion of km s-1(Hickson et al. 1992).
3.4 Number Density of Compact Groups
We identify 2297 compact groups in the SDSS DR6 down to a limiting magnitude of , corresponding to groups degree-2. 0.9% of galaxies down to this limiting magnitude are identified as a member of a compact group. From the redshift analysis in the previous section, we can expect of these compact groups to contain interlopers, and so the density of interloper-free compact groups is probably nearer groups degree-2. However, most of the systems containing interlopers can still be expected to contain a close pair, triplet or higher-order multiple of galaxies (Paper I).
In Paper I, we identify 15122 compact groups in an all-sky mock catalogue with a limiting magnitude of mags, the same as Catalogue A. The predicted density of identified groups in this catalogue is therefore groups degree-2, approximately 50% higher than the observed density in the SDSS DR6. Given that both the observed and mock catalogues were examined using an identical procedure, we surmise that this disparity is a result of inaccuracies in the modeling on which the mock catalogue is based. For example, it may be that the limited resolution of the Millennium simulation causes the merger time of close systems to be incorrectly estimated (see a discussion of these issues in Paper I and Springel et al. 2005). It should be noted that our investigation of the effect of interlopers (Section 3.2.2) and the results from Paper II suggest that many of the properties of the galaxies and groups identified in the mock catalogue are close to the observed properties. Future contributions dealing with the observed properties of the identified groups in SDSS DR6 will include comparisons to the mock catalogue, and may reveal where the source of the discrepancy lies.
Considering all galaxies down to a limiting magnitude of , we identify 74791 compact groups. Accounting for contamination from incorrect photometric classification (Section 2.4.2), this corresponds to groups degree-2, with 0.9% of all galaxies down to this limiting magnitude identified as a member of a compact group. As the redshift study in the previous section makes clear, the majority of these groups will consist in part or in full of interloping galaxies along the same line-of-sight. While the fraction of groups with interlopers is predicted to be as high as 71% for a catalogue with a limiting magnitude of , we can expect that the interloper fraction will significantly increase for a catalogue with a fainter limiting magnitude (since the probability that a given line-of-sight will pass close to an unrelated galaxy will increase).
3.5 Density of the compact group environment

3.5.1 Angular size on sky
The left panel of Figure 10 shows the distribution of the projected radii () of groups from Catalogue A. The blank histogram shows the distribution for all groups, whereas the hatched histogram shows the distribution for those groups with mags arcsec-2. Virtually all of these compact groups have arcmins, and all groups with mags arcsec-2 have arcmin. This reflects the fact that , as expected, and emphasizes the high apparent density of these groups.
3.5.2 Physical group radii and intergalactic separation
For those groups with concordant redshift information, we can calculate the de-projected physical radius of each group, , where is the transverse comoving distance (following Hogg 1999). We assume km s-1 Mpc-1, and . The blank histogram in the right panel of Figure 10 shows the distribution of group radii for all groups with the necessary redshift information identified in Catalogue A, and the hatched histogram shows the corresponding distribution for those groups with mags arcsec-2.
Groups detected in Catalogue A typically have kpc, and the sub-set with mags arcsec-2 typically have kpc. The mean radii of all the compact groups is kpc ( kpc for the bright sub-set), where the uncertainty is the random error in the mean. We estimate the typical inter-galactic separation of individual galaxies within groups to be . For , this corresponds to kpc ( kpc) for the main (bright) sample of groups from Catalogue A. This is significantly less than the expected virial radii of typical type galaxies, and confirms the high spatial density of these environments.
4 Summary
In this paper we have presented a publically available catalogue of compact groups of galaxies identified in the SDSS DR6 (Adelman-McCarthy et al. 2008) using the original Hickson criteria (Hickson 1982). We identify 2297 (74791) compact groups down to a limiting magnitude of (). 0.9% of all galaxies at both magnitude limits are identified as members of compact groups, although once interlopers are accounted for this fraction will decrease. Figures 2 and 3 show a selection of compact groups from our catalogue and illustrates the diversity of the groups in this sample. Many galaxies in these groups appear to be early-type, in agreement with previous studies (e.g. Hickson et al. 1988; Palumbo et al. 1995, Paper II), although there are many examples of groups with late-type members (many of them visually spectacular). A later paper in this series will investigate the detailed morphology of galaxies in these compact groups.
Spectroscopic information is available for 43 % (5 %) of compact group galaxies to a limiting magnitude of (21); we find that the median redshift of the compact groups identified in Catalogue A is . The median line-of-sight velocity dispersions within groups from Catalogue A are km s-1. and the typical inter-galactic separations are of order kpc. The fraction of groups with interloping galaxies as members is significant, and is shown to be in good agreement with the predictions from the mock galaxy catalogue from Paper I, despite the latter over-predicting the number density of compact groups by . We empirically show that the selection of groups by group surface brightness can reduce the interloper fraction significantly; this will be a powerful tool for future studies of these catalogues.
The catalogue of compact groups derived in this paper is publically available: Tables 1 – 4 contain basic information for all the groups and member galaxies we identify, including the identifiers necessary to extract full information on each galaxy from the main SDSS DR6 database. Full versions of these tables are available for download from the MNRAS website.
Acknowledgments
AWM acknowledges support from a Research Fellowship from the Royal Commission for the Exhibition of 1851. He also thanks Sara Ellison and Julio Navarro for additional financial assistance. SLE and DRP acknowledge the receipt of NSERC Discovery Grants which funded some of this research. We thank the anonymous referee for thoughtful and useful suggestions which helped improve the clarity of this paper.
Funding for the SDSS and SDSS-II has been provided by the Alfred P. Sloan Foundation, the Participating Institutions, the National Science Foundation, the U.S. Department of Energy, the National Aeronautics and Space Administration, the Japanese Monbukagakusho, the Max Planck Society, and the Higher Education Funding Council for England. The SDSS Web Site is http://www.sdss.org/.
The SDSS is managed by the Astrophysical Research Consortium for the Participating Institutions. The Participating Institutions are the American Museum of Natural History, Astrophysical Institute Potsdam, University of Basel, University of Cambridge, Case Western Reserve University, University of Chicago, Drexel University, Fermilab, the Institute for Advanced Study, the Japan Participation Group, Johns Hopkins University, the Joint Institute for Nuclear Astrophysics, the Kavli Institute for Particle Astrophysics and Cosmology, the Korean Scientist Group, the Chinese Academy of Sciences (LAMOST), Los Alamos National Laboratory, the Max-Planck-Institute for Astronomy (MPIA), the Max-Planck-Institute for Astrophysics (MPA), New Mexico State University, Ohio State University, University of Pittsburgh, University of Portsmouth, Princeton University, the United States Naval Observatory, and the University of Washington.
References
- Abazajian et al. (2004) Abazajian, K., et al. 2004, AJ, 128, 502
- Adelman-McCarthy et al. (2008) Adelman-McCarthy, J. K., et al. 2008, ApJS, 175, 297
- Allam & Tucker (2000) Allam, S. S. & Tucker, D. L. 2000, Astronomische Nachrichten, 321, 101
- Barton et al. (1996) Barton, E., Geller, M., Ramella, M., Marzke, R. O., & da Costa, L. N. 1996, AJ, 112, 871
- Brasseur et al. (2008) Brasseur, C., McConnachie, A. W., Ellison, S., & Patton, D. 2008, MNRAS, submitted
- De Lucia & Blaizot (2007) De Lucia, G. & Blaizot, J. 2007, MNRAS, 375, 2
- Deng et al. (2007) Deng, X.-F., He, J.-Z., Jiang, P., Luo, C.-H., & Wu, P. 2007, A&A, 474, 783
- Deng et al. (2008) Deng, X.-F., He, J.-Z., Ma, X.-S., Jiang, P., & Tang, X.-X. 2008, Central European Journal of Physics, 6, 185
- Focardi & Kelm (2002) Focardi, P. & Kelm, B. 2002, A&A, 391, 35
- Hernquist et al. (1995) Hernquist, L., Katz, N., & Weinberg, D. H. 1995, ApJ, 442, 57
- Hickson (1982) Hickson, P. 1982, ApJ, 255, 382
- Hickson (1997) —. 1997, ARA&A, 35, 357
- Hickson et al. (1988) Hickson, P., Kindl, E., & Huchra, J. P. 1988, ApJ, 331, 64
- Hickson et al. (1992) Hickson, P., Mendes de Oliveira, C., Huchra, J. P., & Palumbo, G. G. 1992, ApJ, 399, 353
- Hickson & Rood (1988) Hickson, P. & Rood, H. J. 1988, ApJ, 331, L69
- Hogg (1999) Hogg, D. W. 1999, ArXiv Astrophysics e-prints
- Huchra & Geller (1982) Huchra, J. P. & Geller, M. J. 1982, ApJ, 257, 423
- Iovino (2002) Iovino, A. 2002, AJ, 124, 2471
- Iovino et al. (2003) Iovino, A., de Carvalho, R. R., Gal, R. R., Odewahn, S. C., Lopes, P. A. A., Mahabal, A., & Djorgovski, S. G. 2003, AJ, 125, 1660
- Lee et al. (2004) Lee, B. C., et al. 2004, AJ, 127, 1811
- Lupton et al. (2001) Lupton, R., Gunn, J. E., Ivezić, Z., Knapp, G. R., & Kent, S. 2001, in Astronomical Society of the Pacific Conference Series, Vol. 238, Astronomical Data Analysis Software and Systems X, ed. F. R. Harnden, Jr., F. A. Primini, & H. E. Payne, 269
- Mamon (1986) Mamon, G. A. 1986, ApJ, 307, 426
- McConnachie et al. (2008) McConnachie, A. W., Ellison, S. L., & Patton, D. R. 2008, MNRAS, 387, 1281
- Palumbo et al. (1995) Palumbo, G. G. C., Saracco, P., Hickson, P., & Mendes de Oliveira, C. 1995, AJ, 109, 1476
- Ponman et al. (1996) Ponman, T. J., Bourner, P. D. J., Ebeling, H., & Bohringer, H. 1996, MNRAS, 283, 690
- Prandoni et al. (1994) Prandoni, I., Iovino, A., & MacGillivray, H. T. 1994, AJ, 107, 1235
- Scranton et al. (2002) Scranton, R., et al. 2002, ApJ, 579, 48
- Springel et al. (2005) Springel, V., White, S. D. M., Jenkins, A., Frenk, C. S., Yoshida, N., Gao, L., Navarro, J., Thacker, R., Croton, D., Helly, J., Peacock, J. A., Cole, S., Thomas, P., Couchman, H., Evrard, A., Colberg, J., & Pearce, F. 2005, Nature, 435, 629
- Stoughton et al. (2002) Stoughton, C., et al. 2002, AJ, 123, 485
- Strauss et al. (2002) Strauss, M. A., et al. 2002, AJ, 124, 1810
- Walke & Mamon (1989) Walke, D. G. & Mamon, G. A. 1989, A&A, 225, 291