Investigating superconductor-insulator transition in thin
films using drag resistance:
Theoretical analysis of a proposed experiment
Abstract
The magnetically driven superconductor-insulator transition in amorphous thin films (e.g., InO, Ta) exhibits several mysterious phenomena, such as a putative metallic phase and a huge magnetoresistance peak. Unfortunately, several conflicting categories of theories, particularly quantum-vortex condensation, and normal region percolation, explain key observations equally well. We propose a new experimental setup, an amorphous thin-film bilayer, where a drag resistance measurement would clarify the role quantum vortices play in the transition, and hence decisively point to the correct picture. We provide a thorough analysis of the device, which shows that the vortex paradigm gives rise to a drag with an opposite sign and orders of magnitude larger than the drag measured if competing paradigms apply.
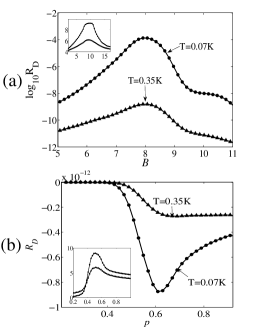
The superconducting state and the metallic Fermi-liquid form the very basis of our understanding of correlated electron systems. Nevertheless, the transition between these two phases in disordered films is shrouded in mystery. Experiments probing this transition in amorphous thin films such as Ta, MoGe, InO, TiN, etc., used a perpendicular magnetic field and disorder (tuned through film thickness) to destroy superconductivity. But instead of a superconductor-metal transition, they observed in many cases a superconductor-insulator-transition (SIT)Haviland et al. (1989). The ”dirty boson” modelFisher (1990) propounded the notion that the insulator is the mark of vortex condensation, and that the SIT occurs at a universal critical resistance, . More recent experiments, however, showed the critical resistance to be non-universal Steiner et al. (2008). Furthermore, in many field tuned experiments, a surprising metallic phase intervenes between the superconductor and insulator Ephron et al. (1996); Sambandamurthy et al. (2004); Steiner and Kapitunlnik (2005), with a temperature-independent resistance below , and (at least in Ta films) a distinct nonlinear characteristics Seo et al. (2006). Quite genericallySambandamurthy et al. (2004); Baturina et al. (2004); Steiner and Kapitunlnik (2005), these films exhibit a peak in the magnetoresistance(MR) curve (particularly strong in InO and TiN) as in FIG. 1a.

Two competing categories of theories may account for these phenomena. On one hand, within the quantum vortex pictures Fisher (1990); Feigelman et al. (1993); Galitski et al. (2005), the insulating phase implies vortex condensation, the intervening metallic phase is described as uncondensed vortex liquid (e.g., vortex Fermi liquid), and the high field nonmonotonic MR indicates the appearance of a finite electronic density of states at the Fermi level. On the other hand, the percolation paradigm Shimshoni et al. (1998); Dubi et al. (2006) describes the films as consisting of superconducting (SC) and normal puddles; at the MR peak SC puddles exhibit a Coulomb blockade, and the percolating normal regions consist of narrow conduction channels. Yet a third theory tries to account for the low field SC-metal transition using a phase glass model Dalidovich and Phillips (2002) (see, however, Ref. Ikeda et al., 2007 which argues against these results), but does not address the full MR curve. Qualitatively, both paradigms above are consistent with MR observations, and recent tilted field, AC conductance, Nernst effect, and Scanning Tunneling Spectroscopic measurementsJohansson et al. cannot distinguish between them.
Can we design an experiment that qualitatively distinguishes between the two paradigms? Here we propose a thin film ”Giaever transformer”Giaever (1965) as such an experiment (FIG. 1(b)). The original design of a Giaever transformer consists of two type-II superconductors separated by an insulating layer in perpendicular magnetic fields. A current in one layer moves the vortex lattice in the entire junction, yielding the same DC voltage in both layers. Determining the drag resistance in a similar bilayer structure of two amorphous superconducting thin films should qualitatively distinguish between the two paradigms (see also Refs. Michaeli and Finkel’stein (2006)): Within the vortex paradigm, vortices in one layer drag the vortices in the other, but within the percolation picture, the drag resistance is solely due to interlayer ”Coulomb drag”, as studied in semiconductor heterostructures Gramila et al. (1991). The sign and the magnitude of the drag within the two paradigms are different: vortex drag implies the same sign for the voltage drops in the two layers, , but the Coulomb drag yields an opposite sign for and . In addition, a vortex drag would be much stronger than a Coulomb drag, because the films’ charge carrier density is orders of magnitude larger than the vortex density; drag effects are typically inversely correlated with carrier density. Indeed, we find that two identical films as in FIG. 2b of Ref. Sambandamurthy et al., 2004 with nm center-to-center layer separation at K would produce a drag resistance 0.1m according to the vortex theory, but only for the percolation theory (FIG.2). Below we will support these claims by analyzing the drag in the thin film symmetric bilayer within a representative theoretical framework in the vortex Galitski et al. (2005) and percolation paradigms Dubi et al. (2006).
Drag resistance, , in the quantum vortex picture. Within the quantum vortex paradigm, the insulating phase has been explained as a superfluid of vortices by the ”dirty boson” model of Ref. Fisher, 1990, while the metallic phase is expected to be an uncondensed vortex liquid. This picture has been pursued by Ref. Galitski et al., 2005 which argues that vortices form a Fermi liquid for a range of magnetic field, thereby explaining the metallic phase. At fields larger than the insulating phase value, it is claimed that spinons (unpaired fermions with finite Fermi-energy DOS) become mobile, impede vortex motions, destroy the insulating phase, and suppress the resistance down to normal metallic values.
Without interlayer Josephson coupling, the vortex drag comes from the magnetic coupling between vortices in different layers which tends to align themselves vertically to minimize the magnetic energy. To calculate the vortex drag, we follow the vortex-boson duality formalism of Ref. Fisher, 1990 and include the effect of physical electromagnetic field to obtain the Lagrangian for vortices, which features the following form of the intralayer vortex interaction potential and the interlayer one :
| (1) | ||||
where is the inverse Pearl penetration depth, is film thickness, and is the center-to-center interlayer distance (we verified that accounting for the finite thickness gives roughly the same results as simply taking the interlayer distance to be a center-to-center one). can be determined from the Kosterlitz-Thouless temperature, , of the sample; typically cm. When , gives the familiar log interaction; for , is still logarithmic but with half of the magnitude De Col et al. (2005), in contrast to the behavior of the single layer case (which is Eq. (1) with ). The interaction between two vortices with the same vorticity in different layers is attractive as expected, although its strength is suppressed with increasing distance and decreasing . These forms of vortex interaction potentials, which can be also derived classically by solving London equations for two vortices, are simply due to the magnetic energy and the superfluid kinetic energy of a SC thin film, and thus is robust against model details.
Deep in the insulating phase, i.e., the vortex superfluid phase where the vortex dynamics is presumably nondissipative, we find the drag resistance using the bilayer supercurrent drag mechanism Duan and Yip (1993), applied to the vortex condensate. Here, a vortex ”supercurrent” in the first layer, produces a vortex ”supercurrent” in the second layer even without interlayer tunneling. To see this, we use the dual vortex theory of Ref. Fisher, 1990 applied to a bilayer, and neglect dual gauge field fluctuations, which are suppressed in the insulating phase. Without vortex current bias in either layer, we can write a Hamiltonian describing a vortex-superfluid in each layer, with density-density interaction given by Eqs. (1), and use the Bogoliubov approach to diagonalize the Hamiltonian. With a perturbation term , describing a vortex current bias with velocity in the first layer, we can perturbatively find the new ground state and therefore the drag vortex current in the second layer. From the ratio of the vortex currents in the two layers, which gives the ratio between the voltages in the two layers, we find the drag resistance in terms of the single layer resistance. A straightforward, but lengthy calculation yields:
| (2) |
where are the vortex density and mass. We expect that in this phase the dissipative response of vortices, if present, is irrelevant or insufficient to localize vortices, e.g., as in the Caldeira-Leggett model of a dissipative Josephson junctionschon et al. (1990).
In the vortex picture, the intervening metallic phase is interpreted as a liquid of uncondensed vortices, e.g., in Ref. Galitski et al., 2005, and the vortices have dissipative dynamics. As long as vortex superfluid is absent and the vortex response is dissipative, one can derive the following form of the the drag resistance using either the Boltzman equation or diagrammatic techniques, irrespective of the effective statistics of vorticesJauho and Smith (1993); Oppen et al. (2001):
| (3) |
where is the screened interlayer interaction, are the vortex density response function of each layer. Remarkably, the drag resistance is proportional to , which equals with and being respectively the vortices’ conductance and density. Thus peaks when the MR attains its biggest slope. appears since is related to the single layer rectification function, , defined as , with being the vortex potential field. is generally proportional to (see Ref. Oppen et al., 2001). The only model-dependent input is the density response functions . As one choice of , we follow the vortex Fermi liquid description for the metallic phaseGalitski et al. (2005) and use the Hubbard approximation form for considering the short-range repulsion between vortices and also the low density of this vortex Fermi liquidHwang et al. (2003). The maximum of we obtained is 0.1m (FIG. 2). Note that this result does not crucially depend on the effective statistics of vortices. We have also computed by modeling the metallic phase as a classical hard-disk liquid of vorticesLeutheusser (1982), and the resulting magnitude and the behavior of is extremely close to the results we obtained within the vortex Fermi liquid frameworknot .
At fields larger than the insulating phase or the MR peak, spinons (unpaired electrons) delocalize and impede vortex motion and suppress drag resistance. Following Ref. Galitski et al., 2005, we use a semiclassical Drude formalism with statistical interactions between vortices, spinons, and Cooper pairs built in (e.g., the Magnus force on vortices when Cooper pairs move, etc.), and we find that with a finite spinon conductance, ,
| (4) |
where is the vortex drag resistance with localized spinons, and is the vortex contribution to the resistance. Thus, when , the drag resistance is quickly suppressed to immeasurably small as spinon mobility increases.
Lastly, we must estimate the vortex mass . Since there is still controversy over its theoretical value, we chose to estimate it from the experimentally measured activation gap in the insulating phaseSambandamurthy et al. (2004); Steiner and Kapitunlnik (2005). When vortices condense, Cooper pair density fluctuations become gapped due to Higgs mechanism, and the gap which can be read off from the Lagrangian depends on . We conjecture that this gap is the activation gap. We find
| (5) |
with . For the InO film of Ref. Sambandamurthy et al. (2004), K, and K at T, which implies , being the electron mass in vacuum. Note that Ref. Sambandamurthy et al., 2004; Steiner and Kapitunlnik, 2005 have reported the suppression of the ratio by increasing disorder. This is natural from (5), since , and disorder suppresses both and . For comparison, this is close to some theoretical results for dirty superconductorsSonin (1998). All analysis above combines to yield the drag resistance behavior, which we plot in FIG.2(a) for the film as in FIG. 2b of Ref. Sambandamurthy et al., 2004.
Drag resistance within the percolation paradigm. Within the percolation picture, the non-monotonic MR arises from the film breaking down to SC and normal regions (described as localized electron glass) Dubi et al. (2006). As the magnetic field increases, the SC region shrinks, and a percolation transition occurs. Once the normal regions percolate, electrons must try to enter a SC island in pairs, and therefore encounter a large Coulomb blockade absent in normal puddles. The MR peak thus reflect the competition between electron transport though narrow normal regions, and the tunneling through SC islands. This picture is captured using a resistor network description. Each site of the network has a probability to be a normal ( to be SC); each link is assigned a resistance from the three values , that reflect whether the sites the link connects are normal (N), or superconducting (S). An increase of the magnetic field is assumed to only cause to increase. The important ingredient is that has an activated form with a large gap representing the charging energy of the SC puddle; reflects the resistance of a localized electron glass with hopping conductivity, and is mostly negligible.
To calculate , we first tune the parameters to make the single layer resistance resemble the experimental data in FIG. 2(b) of Ref. Sambandamurthy et al., 2004. Next, we place one such network (active layer) on top of another one (passive layer). Each link is treated as a subsystem, which might induce a drag voltage (an emf) in the link under it in the passive layer. When a link is between two normal (SC) sites, it is treated as a disorder localized electron glass (superconductor). The small resistance for the SC islands in this theory implies that vortices in the SC islands, if any, have very low mobility. We find that these vortices have negligible effect on not , and Coulomb interaction provide the major drag effect (more theoretical details will be published elsewhere). Thus, two vertically aligned normal-normal (NN) links dominate the drag effect. With the electron counterpart of (3) and the form of electron density response function from Refs. Shimshoni, 1997, we find between two localized electron glass separated by vacuum is:
| (6) |
Here, cm-3 is the typical carrier density of InOSteiner and Kapitunlnik (2005), nm is the film thickness, nm is the center-to-center layer separation, are the resistances of the two NN links, where is the density of states and nm is the localization length. In deriving Eq. (6) we used the averaged value of the inter-layer coulomb interaction along the z-direction of the layers. Solving the Kirchoff’s equations for the two layers, we obtain the voltage drop and thereby the drag resistance. The results are shown in FIG.2(b).
Drag resistance in the phase glass theory. The phase glass modelDalidovich and Phillips (2002) focuses on the low field SC-metal transition. It, therefore, does not allow yet a full calculation of the drag resistance. We leave a full analysis of drag within this theory for future work, but simply observe that in the glassy state the phases are ordered locally, and thus have no mobile vortices. The current-current coupling effects should therefore be absent, and the drag is mainly produced by Coulomb interaction. Thus we expect the sign of the drag voltage to be negative, and the drag resistance should be small due to the scarcity of excitations in a bosonic system.
Summary. We have calculated drag resistance in bilayer amorphous thin films separated by an insulator. Our calculation was carried out within the two competing paradigms, vortex and percolation pictures, that may account for the phenomena observed at the breakdown of the superconductivity in amorphous thin films. In the percolation pictures, the drag resistance is due to interlayer Coulomb drag and immeasurably small, . In the vortex picture, however, the drag is caused by vortex motion. Since the vortex density is much lower than the charge carrier density, the drag resistance is orders of magnitude larger; our calculation shows that it reaches 0.1m with the same sign as the single layer resistance. These estimates are made using parameter values that can easily be realized in experiments. Thus, the drag resistance measurement, albeit challenging due to the small scale of the maximum drag, can indeed provide a sharp distinction between competing theoretical paradigms. In our future work, we will incorporate an interlayer Josephson coupling and analyze its effect on the drag resistance within the different paradigms. We expect that the drag resistance in both picture will be enhanced, but the magnitude difference will remain. This would make the drag resistance easier to measure, and may not only improve its chances of determining the correct theoretical paradigm, but also serve as a complementary tool in the quantitative investigation of these fascinating systems. We note that yet another interesting possibility, which we leave for future research, is to enhance vortex drag by using high magnetic permeability insulators between the two layers.
It is a pleasure to thank Yonatan Dubi, Jim Eisenstein, Alexander Finkel’stein, Alex Kamenev, Yen-Hsiang Lin, Yigal Meir, Yuval Oreg, Philip Phillips, Ady Stern, Jiansheng Wu, and Ke Xu for stimulating discussions. This work was supported by the Research Corporation’s Cottrell award (G.R.), and by NSF through Grant No. DMR-0239450 (J.Y.).
References
- Haviland et al. (1989) D. B. Haviland, Y. Liu, and A. M. Goldman, Phys. Rev. Lett. 62, 2180 (1989); A. F. Hebard and M. A. Paalanen, Phys. Rev. Lett. 65, 927 (1990); J. M. Valles, R. C. Dynes, and J. P. Garno, Phys. Rev. Lett. 69, 3567 (1992); A. Yazdani and A. Kapitulnik, Phys. Rev. Lett. 74, 3037 (1995).
- Fisher (1990) M. P. A. Fisher, Phys. Rev. Lett. 65, 923 (1990).
- Steiner et al. (2008) M. A. Steiner, N. P. Breznay, and A. Kapitulnik, Phys. Rev. B 77, 212501 (2008).
- Ephron et al. (1996) D. Ephron,A. Yazdani, A. Kapitulnik, and M. R. Beasley, Phys. Rev. Lett. 76, 1529 (1996); N. Mason and A. Kapitulnik, Phys. Rev. Lett. 82, 5341 (1999); Y. Qin, C. L. Vicente, and J. Yoon, Phys. Rev. B 73, 100505(R) (2006).
- Sambandamurthy et al. (2004) G. Sambandamurthy, L. W. Engel, A. Johansson, and D. Shahar, Phys. Rev. Lett. 92, 107005 (2004).
- Steiner and Kapitunlnik (2005) M. A. Steiner and A. Kapitunlnik, Physica C 422, 16 (2005).
- Seo et al. (2006) Y. Seo, Y. Qin, C. L. Vincente, K. S. Choi, and J. Yoon, Phys. Rev. Lett. 97, 057005 (2006).
- Baturina et al. (2004) T. I. Baturina, D. R. Islamov, J. Bentner, C. Strunk, M. R. Baklanov, and A. Satta, JETP Lett. 79, 337 (2004).
- Feigelman et al. (1993) M. V. Feigelman, V. B. Geshkenbein, L. B. Ioffe, and A. I. Larkin, Phys. Rev. B 48, 16641 (1993).
- Galitski et al. (2005) V. M. Galitski, G. Refael, M. P. A. Fisher, and T. Senthil, Phys. Rev. Lett. 95, 077002 (2005).
- Shimshoni et al. (1998) E. Shimshoni, A. Auerbach, and A. Kapitulnik, Phys. Rev. Lett. 80, 3352 (1998); A. Ghosal, M. Randeria, and N. Trivedi, Phys. Rev. B 65, 014501 (2001); B. Spivak, P. Oreto, and S. A. Kivelson, Phys. Rev. B 77, 214523 (2008).
- Dubi et al. (2006) Y. Dubi, Y. Meir, and Y. Avishai, Phys. Rev. B 73, 054509 (2006).
- Dalidovich and Phillips (2002) D. Dalidovich and P. Phillips, Phys. Rev. Lett. 89, 027001 (2002; J. Wu and P. Phillips, Phys. Rev. B 73, 214507 (2006).
- Ikeda et al. (2007) R. Ikeda, J. Phys. Soc. Jpn. 76, 064709 (2007).
- (15) A. Johansson, N. Stander, E. Peled, G. Sambandamurthy, and D. Shahar, cond-mat/0602160; R. Crane, N. P. Armitage, A. Johansson, G. Sambandamurthy, D. Shahar, and G. Gruner, Phys. Rev. B 75, 184530 (2007); P. Spathis, H. Aubin, A. Pourret, and K. Behnia, Euro. Phys. Lett. 83, 57005 (2008); B. Sacepe, C. Chapelier, T. I. Baturina, V. M. Vinokur, M. R. Baklanov, and M. Sanquer, Phys. Rev. Lett. 101, 157006, (2008).
- Giaever (1965) I. Giaever, Phys. Rev. Lett. 15, 825 (1965).
- Michaeli and Finkel’stein (2006) K. Michaeli and A. M. Finkel’stein, Phys. Rev. Lett. 97, 117004 (2006); N. Mason and A. Kapitulnik, Phys. Rev. B 65, 220505 (2002).
- Gramila et al. (1991) T. J. Gramila, J. P. Eisenstein, A. H. MacDonald, L. N. Pfeiffer, and K. W. West, Phys. Rev. Lett. 66, 1216 (1991).
- De Col et al. (2005) A. De Col, V. B. Geshkenbein, and G. Blatter, Phys. Rev. Lett. 94, 097001 (2005).
- Duan and Yip (1993) J. M. Duan and S. Yip, Phys. Rev. Lett. 70, 3647 (1993); S. V. Terentjev and S. I. Shevchenko, Low Temp. Phys. 25, 493 (1999).
- schon et al. (1990) G. Schon and A. D. Zaikin, Phys. Rep. 198, 237 (1990).
- Jauho and Smith (1993) A. Jauho and H. Smith, Phys. Rev. B 47, 4420 (1993); A. Kamenev and Y. Oreg, Phys. Rev. B 52, 7516 (1995).
- Oppen et al. (2001) F. von Oppen, S. H. Simon, and A. Stern, Phys. Rev. Lett. 87, 106803 (2001).
- Hwang et al. (2003) E. H. Hwang, S. Das Sarma, V. Braude, and A. Stern, Phys. Rev. Lett. 90, 086801 (2003).
- Leutheusser (1982) E. Leutheusser, J. Phys. C 15, 2801(1982);E. Leutheusser, S. Yip,B. J. Alder, and W. E. Alley, J. Stat. Phys. 32, 503(1983).
- (26) The density response function of a classical hard-disk liquid Leutheusser (1982) in the hydrodynamic limit is given by , where is the static compressibility. All parameterss in this formula (including ) can be determined by two inputs: the diameter of the hard disk vortex, which we use the coherence length, and the vortex mass, which we use the value discussed in the text.
- Sonin (1998) E. B. Sonin, V. B. Geshkenbein, A. van Otterlo, and G. Blatter, Phys. Rev. B 57, 575 (1998) and references therein.
- (28) Particularly, vortex motion does not induce any DC emf in the other layer, and a current does not exert any force on a vortex in the other layer, as shown in Ref. Narayan, 2003.
- Shimshoni (1997) E. Shimshoni, Phys. Rev. B 56, 13301 (1997); Y. Imry, Y. Gefen, and D. J. Bergman, Phys. Rev. B 26, 3436 (1982).
- Narayan (2003) O. Narayan, J. Phys. A 36, L373 (2003).