Current address: ]Systems Planning and Analysis, Alexandria, Virginia 22311 ]Deceased ]Deceased Current address:]Université Blaise Pascal/ CNR-IN2P3 63177 Aubière, France Current address: ]Physikalisches Institut der Universitaet Giessen, 35392 Giessen, Germany The CLAS Collaboration
Beam Spin Asymmetries in DVCS with CLAS at GeV
Abstract
We report measurements of the beam spin asymmetry in Deeply Virtual Compton Scattering (DVCS) at an electron beam energy of GeV using the CLAS detector at the Thomas Jefferson National Accelerator Facility. The DVCS beam spin asymmetry has been measured in a wide range of kinematics, (GeV/c)2 (GeV/c)2, , and (GeV/c)2 (GeV/c)2, using the reaction . The number of H and H events are separated in each bin by a fit to the line shape of the H distribution. The validity of the method was studied in detail using experimental and simulated data. It was shown that with the achieved missing mass squared resolution and the available statistics, the separation of DVCS-BH and events can reliably be done with less than 5% uncertainty. The - and -dependences of the moments of the asymmetry are extracted and compared with theoretical calculations.
PACS numbers: 13.60.z, 14.20.Dh, 24.85.+p
I Introduction
Hard scattering processes play an important role in the understanding of the quark and gluon structure of hadrons. The important feature of hard reactions is the possibility of separating the perturbative (short distance) and non-perturbative (long distance) parts of the interaction. This so-called factorization property has been successfully used in inclusive measurements (e.g. in Deep Inelastic Scattering (DIS) of leptons) to study the internal structure of the nucleon. Until recently, very few exclusive processes could be treated in the framework of perturbative QCD (pQCD) and compared to experimental data (typical examples are the transition form factor j_gron and the elastic form factors of the pion piff and the nucleon belnff ). The recently developed formalism of a QCD description of Deeply Virtual Compton Scattering (DVCS) Ji97 ; Rady and Deeply Exclusive Meson Production CFS , provides a framework in which the amplitudes of these processes can be factorized into a hard-scattering part (exactly calculable in pQCD) and a non-perturbative nucleon structure part that can be parameterized at the amplitude level by means of Generalized Parton Distributions (GPDs). The GPDs contain information on quark/antiquark correlations, particularly the correlation of their transverse spatial and longitudinal momentum distributions, and on the quark angular momentum mburk1 . They provide a unifying picture for an entire set of fundamental quantities containing information on the hadronic structure, such as nucleon form factors (which are related to matrix elements of vector and axial vector currents), polarized and unpolarized parton distributions, and contributions to the spin of the nucleon due to orbital excitations of quarks and gluons.
There are four chiral-even GPDs, denoted , , , and , which depend on the kinematical variables , , and . They correspond to the amplitude for removing a quark with momentum fraction and restoring it with momentum fraction . The light-cone momentum fraction is defined by , where is the quark loop momentum and is the average nucleon momentum (, where and are the initial and final state nucleon four-momenta, respectively). is the generalized Bjorken variable, as , where and . and are the initial and final electron momenta.
The Mandelstam variable is the Lorentz-invariant four momentum transfer squared to the target. In the forward limit, , the GPDs and reduce to the quark density distributions and quark helicity distributions obtained from DIS:
| (3) | |||||
| (6) |
and are accessible through hard exclusive electro-production reactions only and are new leading-twist functions. Similarly, in DIS, which corresponds to the limit , the region is absent. In this region the GPDs behave like meson distribution amplitudes and contain completely new information about nucleon structure. At finite momentum transfer, the first moments of the GPDs are related to the elastic form factors of the nucleon through model-independent sum rules. By integrating over one can obtain for a particular quark flavor (for any ):
| (7) |
| (8) |
| (9) |
| (10) |
where and represent the elastic Dirac and Pauli form factors, respectively, for the quark flavor in the nucleon, is the axial-vector form factor of the nucleon, and is the pseudo-scalar form factor.
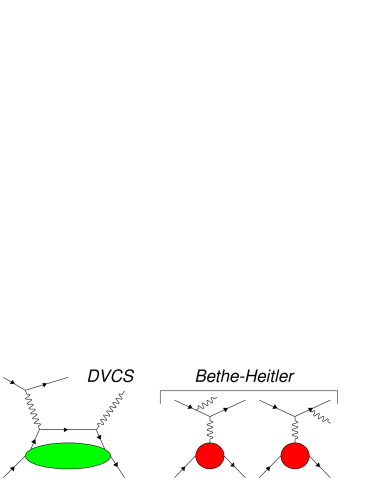
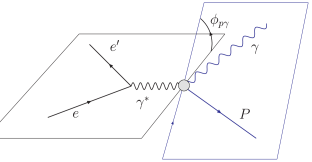
Deeply Virtual Compton Scattering (DVCS), , is the simplest reaction to access GPDs experimentally. DVCS has the same final state as the Bethe-Heitler (BH) process, where a photon is emitted by the incoming or outgoing electron (Fig. 1). The differential cross section for the process can be written as bel0112 :
| (11) |
Here the amplitude of the production of a real photon, , is the sum of the DVCS () and BH () amplitudes, given as:
| (12) |
where
| (13) |
is the interference term. is real to the lowest order in the QED fine structure constant. The lepton energy fraction and Bjorken variable are defined as:
| (14) |
In the notation of Ref. bel0112 , where is the nucleon mass. is the angle between the leptonic plane and the proton-photon production plane.
Contraction of the leptonic and hadronic tensors generates an azimuthal angular dependence of each of the three terms in Eq.(12) diehl . In a frame with the z-axis along the virtual photon, the dependence of the amplitudes on yields a finite sum of Fourier harmonics. The amplitude of deeply virtual production of a photon has been derived up to twist-3 accuracy bel0112 . In the notation of Ref. bel0112 , the helicity-dependent angular moments are presented in a series of , with . Only is a twist-2 quark matrix element. The terms are twist-3 and the terms are twist-2 double-helicity-flip gluon transversity terms, which are kinematically suppressed. If these terms are omitted, then at the twist-2 level, the BH, DVCS, and interference contributions to the total cross section in Eq.(12) read
| (15) | |||
| (16) | |||
| (17) |
where and are the BH propagators.
Experimentally, the simplest observable to measure GPDs is the beam spin asymmetry (). The largest contribution to this observable arises from the imaginary part of the interference of the DVCS and the BH amplitudes, . is the most interesting Fourier harmonic since it is linear in the Compton Form Factor (CFF) bel0112n
| (18) |
where is the power-suppressed kinematical factor and is the beam polarization. Thus, at the twist-2 level, the helicity-dependent cross-section difference will be:
| (19) |
Measuring the imaginary part of the CFF gives access to the GPDs at the specific kinematical point . From a phenomenological point of view, the extraction of the GPDs from data requires an extensive experimental program and detailed analysis with controlled theoretical corrections. This field is rapidly expanding (see e.g. Refs. gpv0106 ; deihl ; mburk2 ), and as a first step, the phenomenological parameterization of GPDs is used to fit the experimental data.
The azimuthal dependence of the beam spin asymmetry has been measured by the CLAS Clas01a and HERMES Her01a Collaborations with electron ( GeV) and positron ( GeV) beams, respectively. The longitudinal target-spin asymmetry has been reported by CLAS shifeng . The dependence of the helicity-dependent and helicity-independent cross sections was measured by the Hall A Collaboration at Jefferson Lab halla . The beam charge asymmetry FR_01 and transverse target spin asymmetry FR_02 have also been reported by HERMES Collaboration. Recently, CLAS Collaboration published measurements of the DVCS beam spin asymmetry over a wide kinematical range using high statistics data obtained with a 5.77 GeV longitudinally polarized electron beam dvcshallb . In this paper, new results on the beam spin asymmetry in DVCS at GeV using the CLAS detector are presented. Measuring the same observables at the same (, , t) but different energies, will yield different combinations of the terms of interest, and thus contribute to the determination of GPDs. In this analysis the number of single photon events has been extracted using the method developed in Ref. Clas01a . A fit to the line shape of the missing mass squared distributions in the reaction was employed in each kinematical bin. The and dependences of the moments have been extracted and are compared with theoretical predictions.
II EXPERIMENT
The measurement was carried out using the CLAS detector clas in Hall B at the Thomas Jefferson National Accelerator Facility. The CLAS detector system is based on a toroidal magnet that consists of six superconducting coils. The coils are positioned symmetrically around the beam line and provide a toroidal field in the azimuthal direction. Each of the gaps between the coils is instrumented with an identical detector package covering typically of in the azimuthal direction.
The CLAS detector package includes three regions of Drift Chambers (DC) and a set of Scintillator Counters (SC) for the tracking and identification of long-lived charged particles using the time-of-flight technique. The DC and SC cover the laboratory polar angular range from to . In the forward region, CLAS has gas threshold Čerenkov Counters (CC) and Electromagnetic Calorimeters (EC) for electron identification. The electromagnetic calorimeters are also used for detection and identification of photons and neutrons. The momentum resolution of the system is approximately . The efficiency of single charged particle detection is in the fiducial volume of the detector.
The data used in this analysis were taken during February-March of 2000. The GeV longitudinally polarized electron beam was incident on a -cm long liquid-hydrogen target. The average beam current was nA. The total integrated luminosity was fb-1. The CLAS Data Acquisition system (DAQ) was triggered by a coincidence of signals from the Čerenkov Counters and the Electromagnetic Calorimeters. The DAQ rate was kHz at live time. The beam polarization was measured several times during the run using the Hall B Moller polarimeter. The average polarization was with an uncertainty of .
A total of M triggers have been processed, of which about contained a properly identified electron. For the physics analysis, events with only one detected electron and one detected proton were used. For systematic checks, the final states () and () were analyzed.
III Particle Identification
At the initial stage of data processing, the three-momenta of all final state particles are defined and preliminary particle identification (PID) is performed. Later, in the physics analysis, these PIDs are refined using the knowledge of the event kinematics.
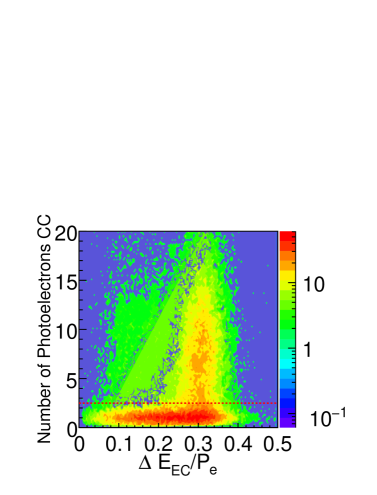
For the identification of electrons, the energy deposited in the EC and the number of photoelectrons detected in the CC are used. This method relies on the correct reconstruction of the shower energy and on the analysis of the electromagnetic shower profile. Fiducial cuts in the calorimeter plane are used to reject particles that pass close to the edges and lose part of their energy outside of the calorimeter detection volume. In Fig. 2 the distribution of the number of photoelectrons detected in the CC, , vs. the ratio is shown after the fiducial cuts have been applied. Here is the electromagnetic shower energy detected in the EC and is the momentum of the particle reconstructed in the DC. The lower horizontal band corresponds to negative pions. The vertical band, centered at (average electromagnetic shower energy sampling fraction of the EC), corresponds to electrons. A cut is used to reject most of the pions. Then, the distribution is fitted by a Gaussian function and a cut around the mean is imposed to further clean the electron sample.
Momentum and time-of-flight (TOF) analysis are performed to identify protons. The CLAS TOF system allows the separation of protons from kaons up to GeV/c and protons from pions up to GeV/c momentum. In the kinematics of this analysis, protons have momenta smaller than GeV/c. Protons are selected using a cut on the vertex time, , calculated by:
| (20) |
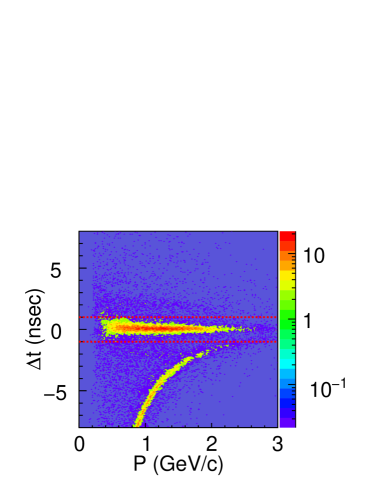
Here, is the time measured in the SC and is the track length from the production vertex to the scintillator plane, which is determined by the tracking routines. In Eq. (20), , where and are the proton momentum and rest mass. The event start time, , is defined by the electron in the event as , where is the time measured in the SC for the electron track and is the electron track length from the production vertex to the scintillator plane. In Fig. 3, the dependence of on the momentum is presented for positively charged particles assuming they are protons. The horizontal band centered at ns corresponds to protons. The lower band, emerging from negative ’s and closing to the proton band at high momentum, corresponds to positive pions. A ns cut, shown by the dashed lines, is used to select protons.
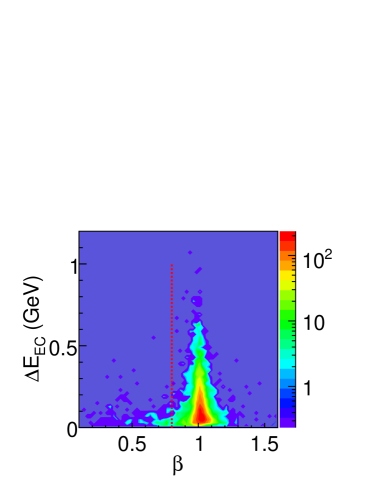
While final beam spin asymmetries for DVCS-BH events were obtained using fits to the missing mass distributions in the reaction , events with and are used to extract the fit parameters and to study systematic uncertainties. The neutral particles in CLAS are detected and identified in the electromagnetic calorimeter. Neutrons and photons in the EC are separated by analyzing the speed of the neutral hits (). For the selection of photons, a cut on is used, see Fig. 4. The energy of the photon is reconstructed using the energy deposited in the EC, corrected for the sampling fraction of the calorimeter of .
IV Kinematic Corrections
Two types of corrections have been applied to the measured momenta of electrons and protons. The first one is a correction to the proton momentum to account for energy loss in the material of the target and in CLAS. The second one is a correction to account for small uncertainties in the magnetic field map and in the drift chamber alignment.
The energy loss corrections for protons are derived using the GEANT simulation package for the CLAS detector. Protons are simulated in the kinematic region covered by the experimental data. The ratio of the generated over the reconstructed momenta is parameterized as a function of the reconstructed momentum using a polynomial function. This function is then used to correct the measured momentum in the analysis of the experimental data.
To correct for the effects of the DC misalignments and the uncertainties in the magnetic field distribution, two methods, applied to kinematically complete reactions, were studied. The first method corrects only the magnitude of the electron and proton momenta. In the second method, a complex fitting algorithm was used to derive corrections for momenta and angles of all charged particles in an exclusive event. These corrections depend on the momentum, angle, and charge of the final state particle and do not depend on the particle type.
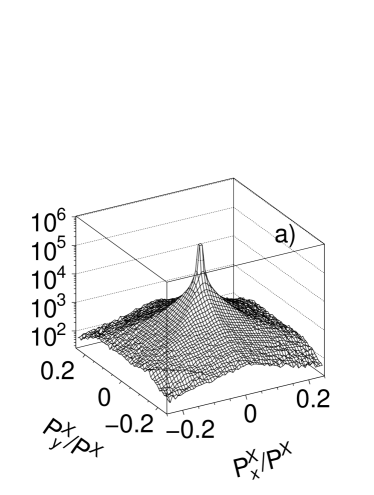
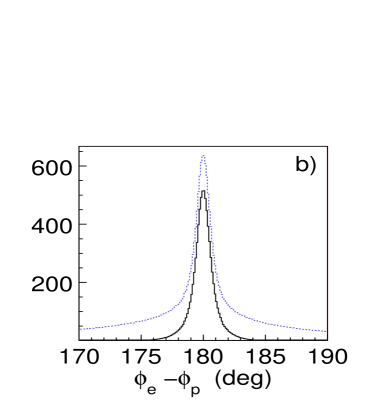
In the first method, the electron momentum corrections are derived using the Bethe-Heitler (BH) events associated with radiation of an energetic photon by the incoming electron. The kinematics of the secondary electrons in such events are similar to the kinematics in the deep inelastic scattering regime. For the selection of the BH events, cuts on the missing mass squared, on the transverse component of the missing momentum, and on the difference of azimuthal angles of the electron () and the proton () in the reaction are used. In Fig. 5 a) the missing transverse momentum distribution is shown for events with the missing mass squared within (GeV/c2)2. The corresponding distribution for the azimuthal angle difference, , is shown in Fig. 5 b) with a dashed line histogram. A cut has been applied to select events with missing momentum in the direction of the beam (the radiated photon is in the direction of the incoming electron). Here is the magnitude and and are the transverse components of the missing momentum. In Fig. 5 b), the solid line histogram corresponds to the azimuthal angle difference after the cut on the transverse component of the missing momentum. The distribution peaks at , as it should for the elastic scattering events. A cut was used to select the final event sample.
The scattered electron momentum, , was calculated using the measured polar angles:
| (21) |
where and are the polar angles of the electron and the proton, respectively, and is the proton mass. is the energy of the interacting electron after radiation. The ratio of over the measured momentum was parameterized as a function of the measured angles and momenta, and used as a correction factor to the measured electron momentum.
For the proton momentum, corrections derived for the from the reaction with a missing neutron are used. The events are selected using a cut around the neutron mass peak. The pion momentum was calculated after applying corrections to the electron momentum and from the assumption that the missing particle is a neutron. As above, the ratio of the calculated and measured momenta was parameterized as a function of the measured angles and momenta, and was used as a correction factor.
In the second method, we used the Bethe-Heitler and production events. The BH events are selected in the same way as above. In order to identify the pion events, two photons, in addition to an electron and a proton, have to be detected. A cut on the invariant mass of the two photons was used for the final selection of events. Using the missing mass squared of the photon and as a constraint in the fit, corrections for the momenta and polar angles of the electron and the proton are derived.
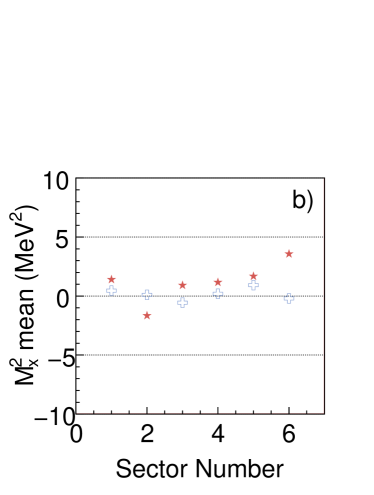
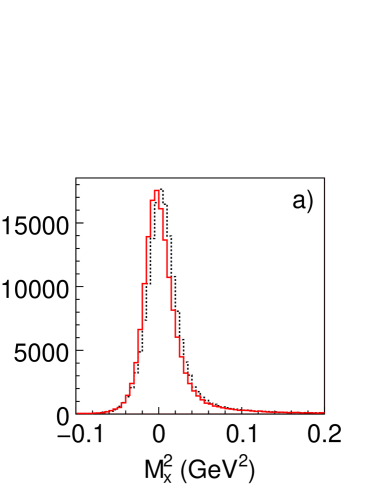
Both methods give comparable results. For the final analysis, corrections obtained by the second method are used. In Fig. 6 a) the missing mass squared distribution for BH events is shown before (dashed line histogram) and after (solid line histogram) corrections are applied. After corrections are applied the position of the missing mass peak has moved to the correct value and the width of the peak has improved. In Fig. 6 b) the improvement on the mean values of the missing mass () distributions of BH events as a function of CLAS sector are shown. The variation of the centroids is less than GeV2 after momentum corrections.
V DVCS Analysis
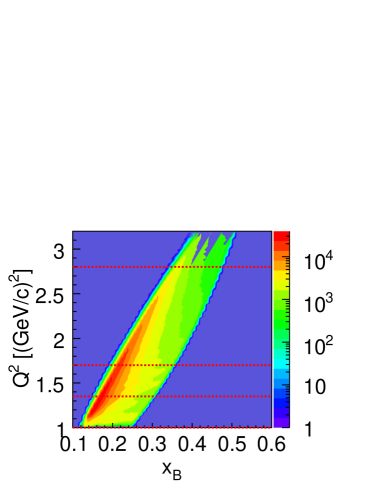
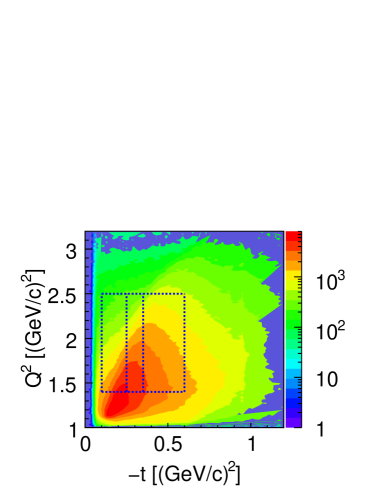
The beam spin asymmetry in DVCS is studied in the kinematical region of GeV and (GeV/c)2 (GeV/c)2 using the reaction where only one electron and one proton are detected in CLAS. The kinematical coverage is shown in Fig. 7.
The azimuthal angular modulations of the beam spin asymmetry () were extracted for three bins in , shown with horizontal lines in the left graph of Fig. 7, for the transferred momentum range from (GeV/c)2 to (GeV/c)2. The dependence of the angular modulations have been studied in three bins of , shown by the vertical lines in the right graph, for the range from (GeV/c)2 to (GeV/c)2.
For each and bin, the data were divided into 11 bins of , the azimuthal angle of the proton-photon production plane to the electron scattering plane (see Fig. 8). Note that in our notation is defined as . In each kinematical bin, the number of events for positive () and negative () helicity states of the beam electrons and for the helicity sum () have been extracted using a fit to the line shape of the missing mass squared distributions. The beam spin asymmetry was calculated as:
| (22) |
where is the average polarization of the beam. The helicity-related charge asymmetry has been measured using the inclusive electron yield. It was found to be and is included in the estimation of the systematic uncertainties.
After omitting terms suppressed by an order of or higher in Eqs.(15), (16), (17), and (19), can be written as:
| (23) |
where the coefficients and are:
| (24) | |||||
| (25) |
In our analysis, the moment of , which is a linear combination of GPDs (see Eq.19), has been extracted in each and bin using fits to the dependence of with the function:
| (26) |
In this representation all the higher-order terms in the azimuthal angle have been combined in the parameter . Note that power-suppressed contributions could modify Eqs. (18) and (19) DM_Private .
V.1 The Missing Mass Technique
The main challenge in the DVCS analysis using the reaction is the separation of the single photon events from the more than one photon events, mostly . In the kinematics of deep inelastic scattering, the CLAS resolution of the missing mass squared is not sufficient to separate these two final states cleanly. For the separation of and events, a fit to the line shape of the missing mass squared distribution is used. This technique for the extraction of the DVCS information in the reaction has already been used in the DVCS analysis of the CLAS data at GeV beam energy Clas01a . The high statistics of this data set and the comprehensive simulation, enable detailed studies of the systematic uncertainties associated with the missing mass technique.
The main contributions to the missing mass squared distribution in the range GeV/c2 GeV/c2 come from three processes: 1) single photon production; 2) production; and 3) the radiative processes associated with photon and production, such as the or final states. Here is the photon radiated by the incoming or outgoing electron. There are also background events associated with particle misidentification and multi-pion production. In the fit, it is assumed that the missing mass squared distributions corresponding to single photon and single production have a Gaussian shape defined by the detector resolution. The radiative tails associated with and production, and the background from particle misidentification and multi-pion production, is fitted by a polynomial function. A sum of two Gaussians and a polynomial function is used in the final fit,
| (27) |
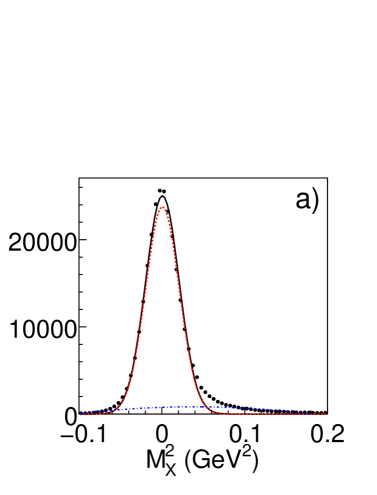
where the fit parameters and are the number of single photon and single pion events, respectively. The fit parameter is the relative magnitude of the background. The shape of the background, , has been determined by a fit to the tails of the missing mass squared distribution. The mean values and the standard deviations of the Gaussian functions and are determined by the fits to the missing mass squared distributions of the BH, , and the single pion, , events. The identification of the BH and events is conducted the same way as was described above. For the extraction of the Gaussian parameters, the function is used to fit the missing mass squared distributions of identified BH and final states individually. Here, the fit parameter is the amplitude of the Gaussian function. The parameters and are the mean value and the standard deviation of the Gaussian function. The function , as in Eq.(27), is used to describe the radiative tail and the background under the missing mass peak. An example of a fit to the missing mass squared distribution of for the BH events in the kinematical region (GeV/c)2 (GeV/c)2 and (GeV/c)2 (GeV/c)2 is shown in Fig.9a. A fit to the distribution of the single pion events for the same kinematical bin is shown in Fig. 9b. The parameters and have been determined for each and bin.
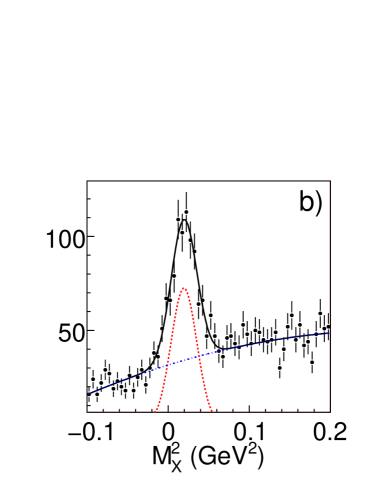
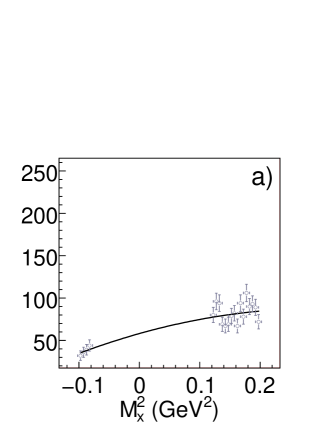
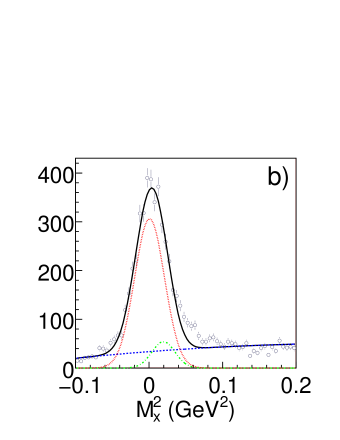
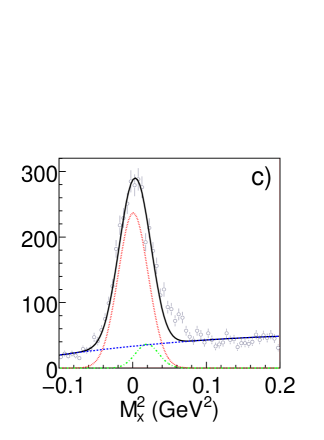
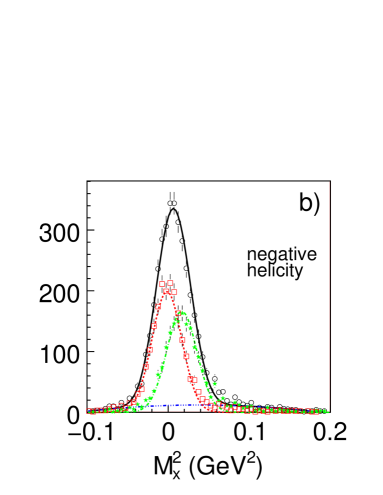
The missing mass squared distributions for each helicity state and for the helicity sum in each kinematical bin are fitted using the function in Eq.(27). An example of a fit for a typical bin, from to , (GeV/c)2 (GeV/c)2, and (GeV/c)2 (GeV/c)2 is shown in Fig. 10. First, a fit with a third order polynomial is performed to the points outside of the peak region, (GeV/c)2 (GeV/c)2 and (GeV/c)2 (GeV/c)2, to determine the shape of the polynomial , see Fig. 10a. Then, using the corresponding mean values and standard deviations of the Gaussian functions and , fits to the distributions for the positive (Fig. 10b) and negative (Fig. 10c) beam helicity states, and for the helicity sum (Fig. 10d) were performed. In Fig. 10b, Fig. 10c, and Fig. 10d the solid lines are the fit functions as defined in Eq.(27), the dashed lines are the Gaussian functions for the single photon events, the dashed-dotted lines correspond to the Gaussian functions for the single events, and the dashed-dot-dot-dot lines correspond to the polynomial background.
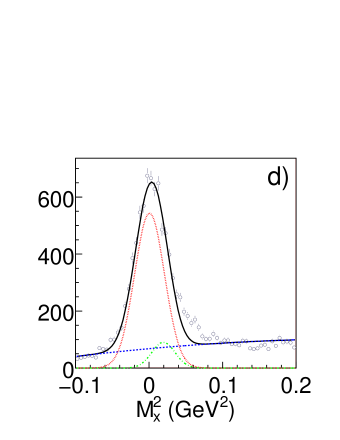
Fits to the distributions have been performed in 11 bins for each and bin. The extracted number of photon events are used to calculate for each kinematical point.
VI Studies of the Analysis Method
The mean values of the missing mass squared distributions for the single photon and final states are separated by approximately one- of the fitted Gaussian distributions. This implies that any small systematic uncertainties in the energy calibration will directly affect the fit results. The accuracy of the determination of has been studied using real and simulated data. In both cases, single photon and events are mixed together and the missing mass squared distributions of the mixed samples are fitted using the function in Eq.(27) to reconstruct the number of photon and pion events. The difference between the initial and the reconstructed number of photon events is taken as a measure of the uncertainty. Using the fit results to the distributions for the DVCS analysis as a guide, the mixed samples with different statistics and the relative ratios of the photon and pion events have been studied.
VI.1 Studies With Experimental Data
The main advantages of using measured data are the correct representation of the background shape and the missing mass squared resolutions. First, separate sets of identified and final states have been created. The method of identification of the photon and pion final states has been explained before. The initial number of events in each final state for the mixing in a given kinematical bin is determined by using a single Gaussian and a polynomial fit to the distributions. Then the two samples were mixed and the number of events in each final state in the mixed sample was then reconstructed by a fit to the line shape of the missing mass squared distribution by using the function in Eq.(27).
Two cases of event mixing are considered. In the first case, the mixing ratio of the and events is kept constant at , while the total number of events in the mixed distributions was changed. The red points in Fig. 11a show the ratio of the initial number of photon events to the number of reconstructed events (from a fit to the distribution of mixed events). The numbers under each point on the plot correspond to the initial number of events. Within statistical uncertainties, the reconstructed and the initial number of photon events are the same, although there is a general trend of the reconstructed numbers to be a few percent larger than the initial number.
In the second case, the number of events was kept constant at , while the number of events increased with each trial. In Fig. 11b the ratio of the initial to the reconstructed number of single photon events is shown with red points. The numbers under each point show the ratio of the to events in the mixed sample. Again, within statistical uncertainties, the ratios of the initial to reconstructed number of single photon events are consistent with .
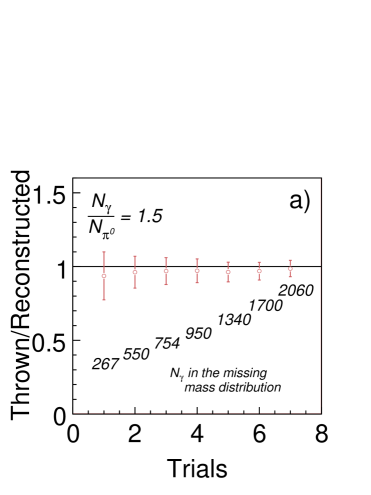
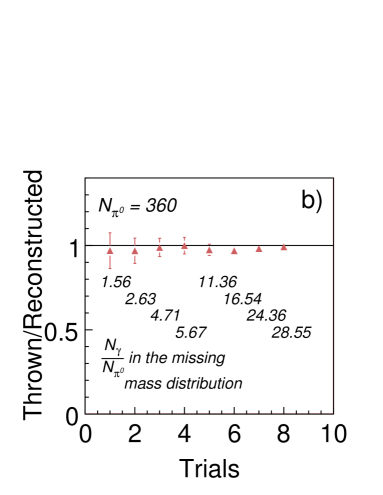
The studies with mixed samples of identified photon and pion final states using the experimental data show that the number of single photon events can be reconstructed using the fit to the distribution with better than % accuracy.
VI.2 Studies With Simulated Data
Another set of tests has been performed using a realistic event generator AVAK_DVCS for the and reactions. The response of the CLAS detector is simulated using a GEANT-based program. The simulated data have been processed with the same event reconstruction and physics analysis algorithms that have been used for the measured data. Events from both samples (that passed all analysis cuts) in a given kinematical bin are mixed together and fits to the line shape of the distributions of the mixed events have been performed to extract the number of single photon and single final states. The parameters for and are derived from the fits to the missing mass squared distributions of the and events before mixing, respectively.
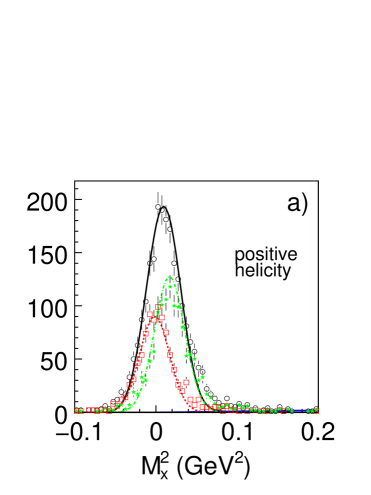
Examples of the fits to the distributions for the different helicity states of the simulated data are shown in Fig. 12. The open circles with error bars correspond to the mixed event distributions. The solid line is the fit using the function in Eq.(27) to these points. The open squares represent the distributions of the initial photon events. The dashed lines are the resulting from the fit to the mixed distributions. The asterisks and the dashed-dotted lines are the same for the single pion final state. The dashed-dot-dot-dotted line (shown only in Fig. 12b) corresponds to the fitted polynomial background.
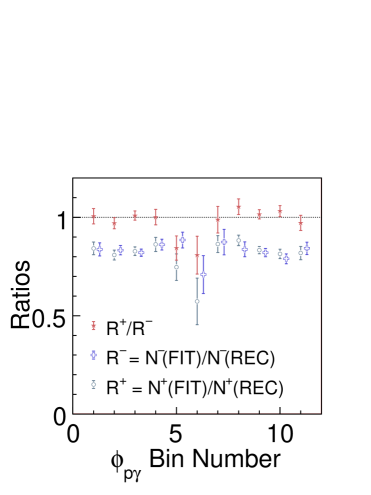
In Fig. 13 the ratio of the number of single photon events, obtained from fits to the missing mass squared distributions of the mixed event sample, to the number of reconstructed photon events that passed all analysis cuts are shown for all bins at (GeV/c)2 (GeV/c)2 and (GeV/c)2 (GeV/c)2. The crosses and the circles represent the ratios for different helicities. The asterisks show the ratio of these ratios. The extracted number of events by the fit is always lower than number of events in the mixed sample by about %. This is due to the fact that there is no background and radiative effects in the simulated data, while the fit procedure finds a non-zero contribution for the polynomial function at the expense of the photon and pion events. The important information is indicated by the asterisks, which show that for each bin, these ratios are the same for both helicities.
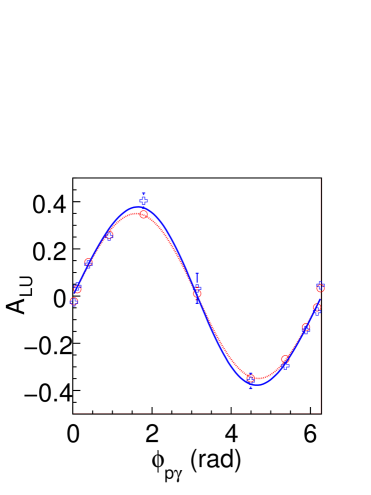
In Fig. 14, the beam spin asymmetry, as defined in Eq.(22), is presented as a function of . The simulated dependence of the asymmetry is shown with circles. The crosses represent the asymmetry obtained using the fit procedure. The solid line is a fit using the function in Eq.(26) to the extracted asymmetry. The dotted line is a fit to the simulated asymmetry. The moment for the extracted asymmetry is approximately higher than the simulated moment. This difference is used as the systematic uncertainty in the determination of the moments of the azimuthal asymmetry in DVCS.
VI.3 Dependences on the Parameters of and
Additional sources of systematic uncertainties are the dependences of the mean values and standard deviations of the functions and on the kinematics of an event. In Fig. 15, distributions of these parameters obtained in smaller sub-bins of and within the bin of (GeV/c)2 to (GeV/c)2 and bin of (GeV/c)2 to (GeV/c)2 are shown. Single photon Bethe-Heitler events, selected as shown in Fig. 5 events in this and bin were divided into sub-bins (Fig. 15.(a,b)), while single pion events were divided into sub-bins (Fig. 15(c,d)). Physics asymmetries in each and bin were extracted using the central values of these parameters in the given bin. To estimate the systematic uncertainties, the whole fitting procedure was repeated with additional four values of these parameters within a RMS range. Thus, a total of different sets of means and standard deviations were tested for each and bin.
.
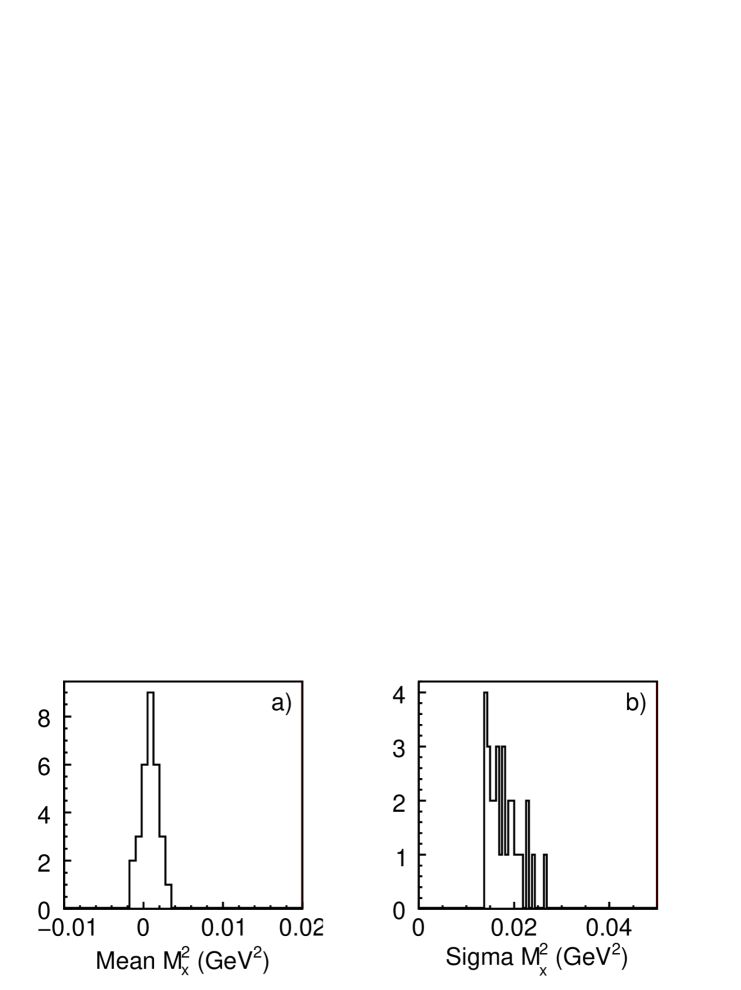
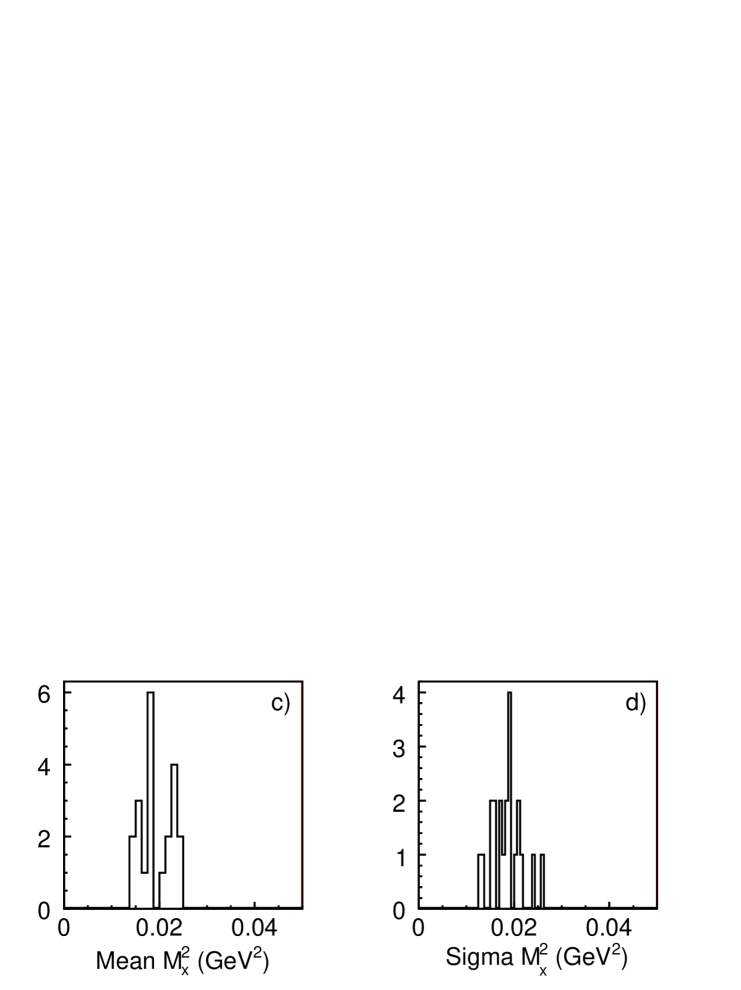
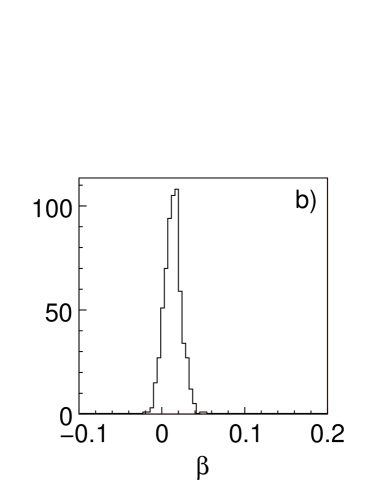
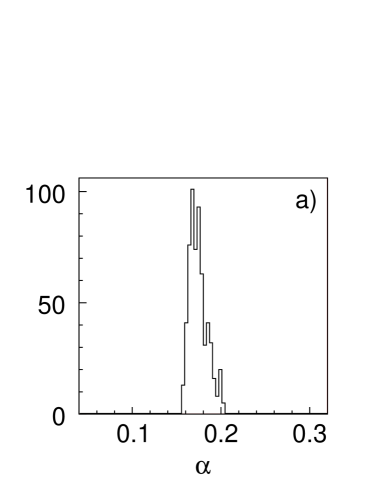
In Fig. 16a, the distribution of the moments obtained for different sets of Gaussian parameters is shown for the and bin of to (GeV/c)2 and to (GeV/c)2, respectively. The RMS of this distribution is . The same distribution for the moment has an RMS of , see Fig. 16b. These RMS values were taken as the systematic uncertainties of the moments due to the kinematical dependence of the parameters of and within the kinematic bin.
VII Results
Our results on the beam spin asymmetry, calculated using Eq.(22), are presented in Tables 1 and 2. In order to extract () moments as a function of and , the azimuthal angular dependence of was fitted with the function presented in Eq.(26). In Fig. 17 the dependences of for three bins of for (GeV/c) (GeV/c)2 are shown. The azimuthal angular dependence of for three bins of at (GeV/c) (GeV/c)2 is shown in Fig. 18. The solid line is a fit of the extracted asymmetry using the function presented in Eq.(26). In both figures only statistical uncertainties are shown.
| [(GeV/c)2] | [(GeV/c)2] | [(GeV/c)2] | ||||
|---|---|---|---|---|---|---|
| 1.5∘ | -0.0051 | 0.0056 | 0.0007 | 0.0055 | 0.0021 | 0.0060 |
| 6.5∘ | 0.0289 | 0.0139 | -0.0005 | 0.0134 | 0.0315 | 0.0154 |
| 22.5∘ | 0.0794 | 0.0221 | 0.0660 | 0.0196 | 0.1054 | 0.0217 |
| 52.5∘ | 0.1427 | 0.0381 | 0.1826 | 0.0322 | 0.1544 | 0.0454 |
| 102.5∘ | 0.2028 | 0.0589 | 0.2080 | 0.0475 | 0.2237 | 0.0750 |
| 180.0∘ | 0.0227 | 0.1062 | 0.0703 | 0.1146 | 0.0071 | 0.1307 |
| 257.5∘ | -0.1394 | 0.0582 | -0.2592 | 0.0539 | -0.1471 | 0.0906 |
| 307.5∘ | -0.1662 | 0.0431 | -0.2173 | 0.0337 | -0.1451 | 0.0463 |
| 337.5∘ | -0.0862 | 0.0203 | -0.0631 | 0.0185 | -0.0643 | 0.0220 |
| 353.5∘ | -0.0147 | 0.0135 | 0.0130 | 0.0129 | -0.0308 | 0.0158 |
| 358.5∘ | -0.0032 | 0.0063 | -0.0001 | 0.0058 | 0.0006 | 0.0063 |
| [(GeV/c)2] | [(GeV/c)2] | [(GeV/c)2] | ||||
|---|---|---|---|---|---|---|
| 1.5∘ | 0.0014 | 0.0102 | -0.0002 | 0.0071 | 0.0141 | 0.0049 |
| 6.5∘ | 0.0449 | 0.0219 | 0.0024 | 0.0185 | 0.0209 | 0.0131 |
| 22.5∘ | 0.0298 | 0.0260 | 0.1143 | 0.0266 | 0.0969 | 0.0204 |
| 52.5∘ | 0.1354 | 0.0402 | 0.1871 | 0.0503 | 0.1998 | 0.0450 |
| 102.5∘ | 0.2361 | 0.0503 | 0.1191 | 0.0906 | 0.2461 | 0.0984 |
| 180.0∘ | -0.0858 | 0.1092 | 0.1608 | 0.1994 | 0.0629 | 0.1908 |
| 257.5∘ | -0.2164 | 0.0533 | -0.0513 | 0.1210 | -0.3280 | 0.1797 |
| 307.5∘ | -0.2105 | 0.0389 | -0.1756 | 0.0548 | -0.1679 | 0.0515 |
| 337.5∘ | -0.0691 | 0.0253 | -0.0594 | 0.0260 | -0.0653 | 0.0194 |
| 353.5∘ | 0.0111 | 0.0218 | 0.0010 | 0.0179 | -0.0377 | 0.0129 |
| 358.5∘ | 0.0075 | 0.0110 | -0.0035 | 0.0076 | 0.0045 | 0.0053 |


The systematic uncertainties on have been evaluated using the studies presented in the previous section. Besides the systematic uncertainties due to the fits, , and the determination of the parameters of and , , there is an uncertainty in the calculation of the from the determination of the beam polarization, , and an uncertainty due to the charge asymmetry. The uncertainty on the beam polarization was estimated to be . The helicity-dependent charge asymmetry was about . The estimated total systematic uncertainties for the extracted moments are and .
| [(GeV/c)2] | [(GeV/c)2] | |||||
|---|---|---|---|---|---|---|
| 1.22 | 0.17 | 0.23 | ||||
| 1.51 | 0.20 | 0.26 | ||||
| 2.04 | 0.28 | 0.38 |
| [(GeV/c)2] | [(GeV/c)2] | |||||
|---|---|---|---|---|---|---|
The final results on the moments and are presented in Table 3 and Table 4. For consistency checks, the dependence of the were fitted with the function presented in Eq.(23). The obtained results on and are also presented in Table 3 and Table 4. In the tables only the statistical uncertainties are quoted.
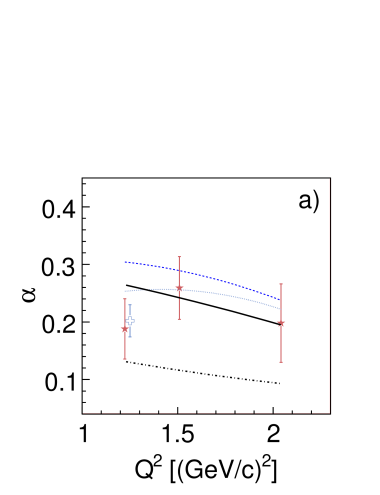
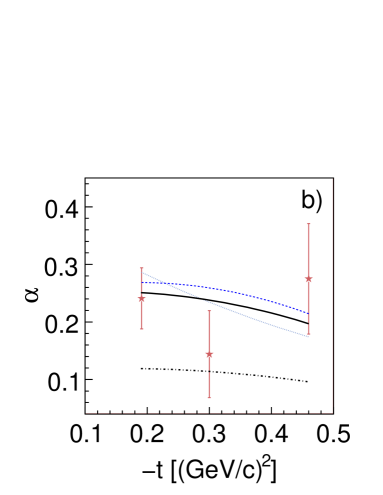
In Fig. 19, the and -dependences of the moment () are shown. In the graph for the dependence the previously published CLAS result on Clas01a is shown by an open cross. The solid and dashed-dotted lines are the and -dependences of the moments of the beam spin asymmetry calculated using a Regge trajectory exchange model for the interaction of the photon with the proton Laget03 ; Laget using two treatments of the unitarity cuts. The dashed-dotted curves retain the contribution of the poles Laget03 and the contribution of the - elastic cut Laget . They take into account the coupling between the - and the - channels and are well under control since they rely on known on-shell matrix elements. The solid curves also take into account all of the inelastic diffractive cuts, under the assumption that diffractive dissociation saturates the photo-absorption cross section. This treatment leads to an excellent agreement with the unpolarized cross sections, as well as the helicity difference of the DVCS cross sections, recently measured in Hall A halla .
The other two curves in the graphs represent calculations of the moments with a GPD-based model GVG1 , using a Regge ansatz for the -distribution of the GPD GPRV . The parameterization of GPDs includes the D-term (to ensure the polynomiality of Mellin moments of GPDs radd ). Helicity-dependent cross sections were calculated at the twist-three level and include target mass corrections GVG1 . Calculations are done for two different skewedness parameter values for sea quarks, - dashed line, and - dotted line. In the calculations the profile parameter for the valence quark was and the Regge slope parameter GPRV . The data favor the GPD model with the sea quark skewedness parameter . The calculations include the DVCS contributions to both the numerator (Eq.(17)) and denominator (Eq.(16)) of .
In the method used for separation of the single photon events, the radiative tails were folded into the “background”. The radiative effects are inseparable from the Born level process. Detailed radiative calculations by Vanderhaeghen et al. qedrad showed that the effect on the beam spin asymmetry is less than . This is much smaller than the uncertainties of our measurements.
The extracted moment or denominator term of is within uncertainties consistent with zero. The precision of our results is not good enough to determine small contributions from higher twists and the power suppressed terms.
VIII Summary
The beam spin asymmetry in the deeply virtual production of real photons has been measured using a GeV longitudinally polarized electron beam and the CLAS detector. The experimental for each kinematical bin was calculated using the number of single photon events extracted from the fits to the line shape of the missing mass squared () distributions. Studies using Bethe-Heitler and production events have been performed to test the validity of the fit method. It was found that the systematic uncertainties on the moments from the fit procedure are not more than . Overall systematic uncertainties have been estimated to be less than of the value of .
The , , and moments of the azimuthal angular dependence of the asymmetry have been extracted in three bins of and three bins of transferred momentum (see Tables 3 and 4). The and dependences of the moment are compared with theoretical calculations using the GPD-based model for DVCS GVG1 ; GPV and the photon-proton interaction based on a Regge model Laget . The sensitivity of our results is not good enough to estimate small contributions from higher twists and the power suppressed terms. However, the data put constraints on the model parameters used to calculate the beam spin asymmetry. Also, the data are reproduced by a model based on Regge poles and unitary cuts. Whether this is a consequence of the quark hadron duality remains to be investigated. Clearly, more data in a wide range of kinematics are needed to refine the parameters of the models. New experiments on DVCS and on Deeply Virtual Meson Production will provide further observables in the Deeply Exclusive Production regime that can be used in a global fit to extract the GPDs.
IX Acknowledgments
We would like to acknowledge the outstanding work of the staff of the Accelerator Division and the Physics Divisions, and the Hall B technical staff that made this experiment possible. We would also like to acknowledge useful discussions with M. Vanderhaeghen and for providing a computer code for model calculations.
This work was supported in part by the Istituto Nazionale di Fisica Nucleare, the French Centre National de la Recherche Scientifique, the French Agence Natioanale de la Recherche, the French Commissariat à l’Energie Atomique, the U.S. Department of Energy, the National Science Foundation and the Korea Research Foundation. Authored by The Southeastern Universities Research Association, Inc. under U.S. DOE Contract No. DE-AC05-84150. The U.S. Government retains a non-exclusive, paid-up, irrevocable, world-wide license to publish or reproduce this manuscript for U.S. Government purposes.
References
- (1) J. Gronberg et al. (CLEO Collaboration), Phys. Rev. D57, 33 (1998).
- (2) A.P. Bakulev, K. Passek-Kumericki, W. Schroers, and N.G. Stefanis, Phys. Rev. D70, 033014 (2004).
- (3) A. Belitsky, X.-d. Ji, and F. Yuan, Phys. Rev. Lett. 91, 092003 (2003).
- (4) X. Ji, Phys. Rev. Lett. 78, 610 (1997); Phys. Rev. D 55, 7114 (1997).
- (5) A.V. Radyushkin, Phys. Lett. B 380, 417 (1996); Phys. Rev. D 56, 5524 (1997).
- (6) J.C. Collins, L. Franfurt, and M. Strikman, Phys. Rev. D 56, 2982 (1997).
- (7) M. Burkardt, Phys. Rev. D62, 071503 (2000).
- (8) A. Belitsky, D. Muller, and A. Kirchner, Nucl. Phys. B629, 323 (2002).
- (9) D. Muller, Private Communications.
- (10) M. Diehl, T. Gousset, B. Pire, J.P. Ralston, Phys. Lett. B411, 193 (1997).
- (11) K. Goeke, M. Poliakov, and M. Vanderhaeghen, Prog. Part. Nucl. Phys., 47, 401 (2001).
- (12) M. Diehl, Phys. Rep. 41, 388 (2003).
- (13) Note that power-suppressed contributions not included in Ref. bel0112 could modify Eqs.(18) and (19). D. M ller, private communication.
- (14) M. Burkardt, Int. J. Mod. Phys. A18, 173 (2003).
- (15) S. Stepanyan et al., Phys. Rev. Lett. 87, 182002 (2001).
- (16) A. Airapetian et al., Phys. Rev. Lett. 87, 182001 (2001).
- (17) S. Chen et al., Phys. Rev. Lett. 97, 072002 (2006).
- (18) C. Munoz Camacho et al., Phys. Rev. Lett. 97, 262002 (2006).
- (19) A. Airapetian et al., Phys. Rev. D75 (2007) 011103.
- (20) A. Airapetian et al., JHEP 0806 (2008) 066.
- (21) F.X. Girod et al., Phys. Rev. Lett. 100, 162002 (2008)
- (22) B. A. Mecking et al., Nucl. Instr. Meth. A 503/3, 513 (2003).
- (23) H. Avakian , private communication.
- (24) F. Cano and J.-M. Laget, Phys. Lett. B551, 317 (2003), Erratum-ibid. B571, 260 (2003).
- (25) J.-M. Laget, Phys. Rev. C 76, 052201 (R) (2007).
- (26) M. Vanderhaeghen, P.A.M. Guichon, and M. Guidal, Phys. Rev. D 60, 094017 (1999).
- (27) M. Guidal at al., Phys. Rev. D72, 054013 (2005).
- (28) A.V. Radyushkin, Phys. Rev. D 59, 014030 (1999).
- (29) M. Vanderhaeghen et al., Phys.Rev. C 62, 025501 (2000).
- (30) K. Goeke, M.V. Polyakov, and M. Vanderhaeghen, Prog. Part. Nucl. Phys. 47, 401 (2001).