22email: oliver.kuehn@uni-rostock.de 33institutetext: N. Došlić 44institutetext: Department of Physical Chemistry, Rudjer Bošković Institute, 10000 Zagreb, Croatia 55institutetext: G. M. Krishnan 66institutetext: Institut für Chemie und Biochemie, Freie Universität Berlin, Takustr. 3, 14195 Berlin, Germany 77institutetext: H. Fidder, K. Heyne 88institutetext: Institut für Physik, Freie Universität Berlin, Arnimallee, 14195 Berlin, Germany
88email: heyne@physik.fu-berlin.de
Anharmonic Vibrational Dynamics of DNA Oligomers
Abstract
Combining two-color infared pump-probe spectroscopy and anharmonic force field calculations we characterize the anharmonic coupling patterns between fingerprint modes and the hydrogen-bonded symmetric stretching vibration in adenine-thymine dA20-dT20 DNA oligomers. Specifically, it is shown that the anharmonic coupling between the bending and the stretching vibration, both absorbing around 1665 cm, can be used to assign the fundamental transition at 3215 cmdespite the broad background absorption of water.
1 Introduction
Vibrational energy redistribution and relaxation in complex systems depends on the network of anharmonically coupled vibrational states subject to fluctuations due to the interaction with some environment may04 . Focussing on hydrogen-bonded systems there is considerable evidence that the time scales for relaxation can be in the subpicosecond range pointing to a rather strong interaction, e.g., of the excited stretching vibration with other hydrogen bond (HB) related modes such as the bending and the low-frequency HB distance vibration as well as with the solvent nibbering04:1887 ; heyne04:6083 ; nibbering07:619 ; giese06:211 ; marechal07 .
One of the most prominent hydrogen-bonded systems is DNA. Despite numerous experimental and theoretical investigations on vibrational spectra of nucleic acid bases tsuboi69:45 ; clark85 ; lettelier87:663 ; florian94:1457 ; florian95:421 ; ouali97:4816 ; shishkin99:15 , information on inter- and intramolecular interactions in base pairs and DNA oligomers is still limited howard65:801 ; spirko97:1472 ; sponer97:76 ; brandl99:103 ; sponer01:43 ; nir02:740 ; krummel03:9165 ; woutersen04:5381 ; lee06:114508 ; lee06:114509 ; lee06:114510 ; lee07:145102 . A recent example is the work on single adenine-uracil (AU) base pairs in the Watson-Crick geometry in solution, which showed an enhancement of vibrational energy relaxation of the NH stretching vibration by a factor of three as compared to the isolated uracil base woutersen04:5381 .
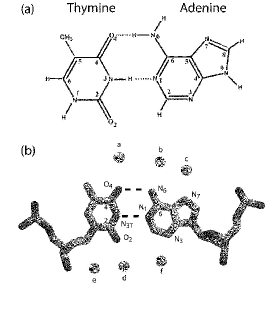
DNA oligomers adopt different types of conformations, both in gas and condensed phases, such as the A, B, B’, C, D, and Z form, depending on water and salt concentration, type of cations, pH, and base sequences clark85 ; ouali97:4816 ; lee07:145102 ; saenger84 ; parvathy02:1500 ; pattabiraman86:1603 ; pichler00:391 . In the condensed phase the conformations of DNA oligomers are stabilized by water molecules that form water networks, predominantly in the major and minor grooves, and near the phosphate groups of the backbone ouali97:4816 . Among the different types of base sequences, adenine-thymine (AT) oligomers are special because they do not undergo transitions from the B to the A form upon reducing the water content. Instead, AT oligomers adopt the B’ form at low water concentrations, with 4 to 6 water molecules per base pair that may be hydrogen-bonded to the oligomer ouali97:4816 ; taillandier87:3361 ; falk63:387 ; vargason01:7265 . In the B’ form of the AT DNA oligomer two HBs are formed in the Watson-Crick configuration, i.e., between oxygen (O4) of the thymine and the NH2 group of the adenine (N6), and between the NH group of the thymine (N3T) and the nitrogen atom of the adenine (N1), see Fig. 1.
Vibrational modes expected to be strongly influenced by the hydrogen-bonding in the DNA helix are the carbonyl stretches at 1716 cm-1 and at 1665 cm-1 and the amine bending at 1665 cm-1 tsuboi69:45 ; clark85 ; lettelier87:663 ; howard65:801 ; miles64:1104 ; adam86:3220 ; liquier91:177 ; sutherland57:446 ; ghomi90:691 . Note, that in contrast to H2O, in D2O the vibration of adenine and the carbonyl vibrations of thymine are decoupled, due to the frequency shift from to lee06:114508 ; lee06:114509 . The vibration of water molecules in DNA samples typically absorbs in the same spectral region, i.e., around 1650 cmtsuboi69:45 ; adam86:3220 ; benevides83:5747 . A direct experimental assignment of and in AT DNA oligomers in the condensed phase is very difficult. Typically, symmetric and antisymmetric stretching vibrations absorb around 3300 cm-1 tsuboi69:45 . However, the spectral range from 3050 to 3600 cm-1 is dominated by the strong absorption of the water OH stretching vibration. Reducing the water content of the DNA oligomers does not solve this problem, because at extremely low water contents the DNA oligomers do not adopt a well defined structure.
Ultrafast time-resolved infrared (IR) spectroscopy is ideally suited to address this issue as has been shown in studies of inter- and intramolecular couplings and energy relaxation dynamics in various hydrogen-bonded systems nibbering04:1887 ; heyne04:6083 ; nibbering07:619 ; cowan05:199 ; heyne04:902 . In this contribution we focus on shifts in oligomer vibrational modes induced by excitation of the or the / oligomer fingerprint vibration. These shifts originate from inter- and intramolecular couplings among different vibrational modes of the DNA oligomer and depend on the strength of the couplings as well as the energy mismatch between different transitions. Related effects are particularly pronounced if overtones or combination modes match a fundamental vibrational transition (resonance enhancement). This already affects the linear absorption band shape, but also the vibrational relaxation dynamics giese06:211 . A particular strength of the ultrafast IR pump-probe spectroscopy is the capability of uncovering vibrational spectral features not visible in linear spectroscopy due to excessive solvent absorption. This is demonstrated in the experiments presented here, where we excite oligomer vibrations between 1600 and 1760 cm-1 and probe for the oligomer vibration in the region of 3050 - 3250 cm-1, which is dominated by water absorption.
The experimental assignment of the adenine vibration and the coupling pattern across the HBs is supported by quantum chemical calculations of anharmonic couplings which are used for obtaining fundamental transitions frequencies for a set of relevant modes of a microsolvated gas phase AT model. In principle accurate theoretical modelling of the vibrational dynamics of DNA AT base pairs requires taking into account several effects: (i) The intermolecular double HB between adenine and thymine, (ii) The interaction between different base pairs along the DNA strand, (iii) The charges as well as the dynamics of the backbone, and (iv) The influence of water molecules which may, for instance, make a HB to the base pair. Here, we are aiming to obtain a semiquantitative understanding of the transient band shifts, whereby it is assumed that they are dominated by effect (i), that is, the anharmonic coupling pattern due to the intermolecular HB. The effect of (ii)-(iv) can be of static nature, e.g., changes in the anharmonic frequencies and coupling constants, and also of dynamic nature, e.g., fluctuation of the energy levels. However, here we will only focus on the static influence of a well-defined environment determined by microsolvation of the AT base pair by several water molecules.
Isolated and microsolvated base pairs have been extensively studied theoretically, focussing in particular on the stability of different isomers, see, e.g. the work by Hobza and coworkers jurecka06:1985 ; kabelac05:12206 ; kabelac07:903 as well as by Fonseca-Guerra et al. fonseca-guerra00:4117 . Although there is a number of reports on potential energy surfaces of base pairs in harmonic approximation, there appear to be only a few calculations addressing anharmonicity in the context of, e.g., proton transfer florian94:1457 ; villani05:1 ; gorb04:10119 , the coupling to the intermolecular HB vibration spirko97:1472 or the assignment of different gas phase isomers krishnan07:132 . Most notable in this respect is the recent study of the anharmonic spectrum of a guanine-cytosine pair brauer05:6974 as well as the development of a vibrational exciton model to describe nonlinear IR spectra involving DNA fingerprint modes krummel03:9165 ; lee06:114508 ; lee06:114509 ; lee06:114510 ; lee07:145102 ; krummel06:13991 .
This Chapter is organized as follows. In the next Section we will first discuss the effect of solvating water molecules on the anharmonic IR spectra of an isolated AT pair. In this context we will scrutinize the applicability of a dual level approach which combines different quantum chemistry methods within a correlation expansion of the potential energy surface (PES). For the case of two water molecules we will present an analysis of the anharmonic coupling patterns between the , and vibrations and the symmetric mode in Section 2.2. Section 3 gives details on the experimental setup and presents results of two-color pump-probe spectra. Finally, we give a comparison between theory and experiment in Section 4 which leads us to the assignment of the fundamental transition.
2 Microsolvated AT Base Pairs
2.1 Fundamental Transitions Using a Dual Level Approach
In the following we present results on fundamental vibrational transitions of isolated AT base pairs microsolvated with 1-4 water molecules. The aim of this study is twofold: First to find out about overall changes of IR transitions of base pair modes due to the interaction with water molecules. And, second, to test the performance of a dual level approach combining density functional (DFT) and semiempirical PM3 data to expand the PES. Throughout we will assume that the deviations from equilibrium structures are small enough such as to allow the use of normal mode coordinates for spanning the PES, i.e. .
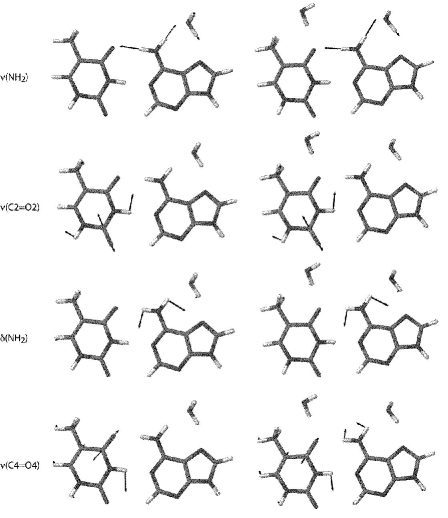
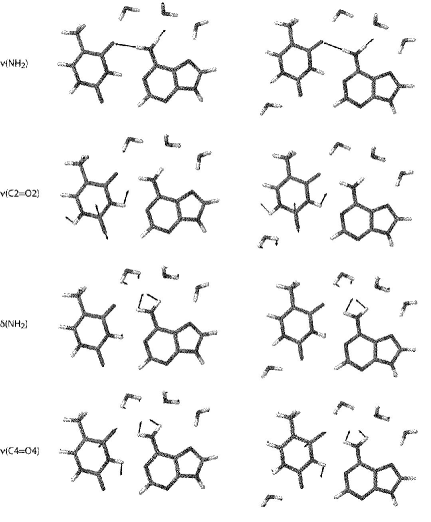
Under the conditions of the experiment there are 4 to 6 water molecules per AT pair which can form different HBs to the base pair (see also Fig. 1). Our interest will be in the IR transitions of the NH2 and C4=O4 groups such that water situated in the major groove shall be of importance. However, for comparison we also consider a structure where a water molecule is on the C2=O2 side. There are several microsolvation studies which focussed on the effect of water on base pair properties such as interaction energies or HB lengths kabelac05:12206 ; kabelac07:903 ; fonseca-guerra00:4117 ; kumar05:3971 . To our knowledge there is, however, no theoretical account on anharmonic IR spectra of HB related modes. The four structures which will be discussed in the following are shown in Figs. 2 and 3. They have been obtained by geometry optimization at the DFT/B3LYP with a 6-31++G(d,p) level of theory using Gaussian 03 gaussian03 . Notice that these are not necessarily the most stable structures at this level of theory (see also discussion in Ref. kabelac07:903 ). Our choice has been biased by the requirement that the water molecules should be close or even hydrogen-bonded to the considered target modes. The latter are shown in terms of their normal mode displacement vectors in Figs. 2 and 3 as well. The respective harmonic frequencies are compiled in Table 1.
In AT-H2O, Fig. 2 (left column), the water molecule is hydrogen-bonded between the adenine N6-H and the N7 sites. This causes the vibration to acquire some water stretching character lowering its harmonic frequency. The vibration is only slightly mixed with some water motion and essentially constrained so that its frequency is blue-shifted. The next water molecule in AT-(H2O)2, Fig. 2 (right column), makes a HB to the oxygen of C4=O4 lowering the frequency slightly, but at the same time mixing this vibration with type motions. For the case of three water molecules, Fig. 3 (left column), there is the possibility to form a hydrogen bonded water chain connecting the O4, N6-H, and N7 sites. This reduces the mixing of the and water motions, but the vibration contains a water bending now as does the mode. Adding another water at the C2=O2 site leads as expected to a shift of the transition only, Fig. 3 (right column). Overall we notice that the presence of solvating water molecules has the strongest impact on the and vibrations, with the latter acquiring substantial character.
| modes | AT | AT-H2O | AT-(H2O)2 | AT-(H2O)3 | AT-(H2O)4 |
|---|---|---|---|---|---|
| 3410 | 3393 | 3401 | 3415 | 3410 | |
| 1797 | 1794 | 1799 | 1799 | 1776 | |
| 1689 | 1718 | 1720 | 1727 | 1727 | |
| 1728 | 1731 | 1714 | 1720 | 1720 |
So far we have only discussed harmonic frequencies. The effect of anharmonicity can be treated using either a Taylor expansion of the PES in terms of normal mode coordinates or by explicitly spanning the PES on a numerical grid. The discussion of anharmonic force constants is postponed to the following section. Here, we will focus on an explicit PES generated by means of the following correlation expansion, here written up to three-mode correlations, carter97:10458
| (1) |
Neglecting rotation watson68:479 , i.e. assuming that the kinetic energy operator is diagonal, the eigenstates of the respective Hamiltonian can be obtained by straightforward diagonalization using, e.g., the Lanczos method. For systems of the size of solvated base pairs the calculation of higher order correlation terms becomes rather expensive. Here, an interesting alternative are so-called dual level schemes where low-order correlation PES are calculated at a higher level of quantum chemistry than multi-mode correlation PES. For instance, Scheurer and coworker have combined MP2 and PM3 calculations to find a rather good description of IR spectra of a model peptide bounouar06:87 .
In Table 2 we present results of dual level calculations on 4D models including the target modes of Figs. 2 and 3. Here the one-mode potentials, , have been calculated using the DFT method, while two- and three mode PES were generated using the semiempirical PM3 approach.
| mode | AT-H2O | AT-(H2O)2 | AT-(H2O)3 | AT-(H2O)4 |
|---|---|---|---|---|
| 3326 | 3332 | 3307 | 3310 | |
| 1803 | 1813 | 1797 | 1785 | |
| 1732 | 1760 | 1777 | 1753 | |
| 1701 | 1664 | 1635 | 1643 |
| 2D model | mode | DFT | PM3 | DUAL |
|---|---|---|---|---|
| , | 3311 | 3154 | 3321 | |
| 1727 | 1950 | 1730 | ||
| , | 1796 | 1901 | 1796 | |
| 1742 | 1703 | 1742 | ||
| , | 1715 | 1807 | 1680 | |
| 1744 | 1671 | 1777 |
Comparing these anharmonic results with the harmonic values in Table 1 we notice the following: The vibration is strongly affected and red-shifts by about 70-100 cmdepending on the cluster size. The vibration is only slightly affected. Essentially, these two modes behave as expected. Except for the AT-H2O case the vibration is blue-shifted by about 40 cm. The fundamental transition of the mode, on the other hand, is considerably red-shifted by about 30-80 cm. In terms of the experimental assignment given in Table 6 below the agrees fairly well with experiment which puts this transition at 1665 cmtsuboi69:45 ; clark85 ; howard65:801 . However, the vibration is believed to absorb around 1665 cmas well, which is at variance with the prediction of the dual level scheme. Moreover, in the harmonic case but also in the fourth order anharmonic force field calculations reported below the frequencies of and are almost identical. It would be surprising if the higher order anharmonic terms implicitly included in the PES expansion changes this situation to such an extent.
Since multimode calculations are rather expensive we have chosen to scrutinize the effect of the PM3 approximation by comparing different 2D models of AT-(H2O)2 at the full DFT, PM3, and dual level. The results are compiled in Table 3. The correlation between the and modes is rather well-desribed by the dual level scheme, the error being just a few cm. The same holds true for the correlation between the and modes. However, the hybrid scheme is performing poorly for the correlation between the and modes and gives the frequency shifts of opposite sign also observed for the full 4D calculation in Table 2. The failure of the dual level scheme to describe the coupling of the and bending motion can be understood in terms of their considerable mixing as quantified by a normal mode internal coordinate decomposition. In general, an internal coordinate may contribute to the displacement along several normal modes. Analyzing the present situation using the scheme of Boatz and Gordon boatz89:1819 the internal coordinate describing the NH2 angle contributes to the decomposition of the bending normal mode by only 29 %, while its contribution to the stretching normal mode (see also Fig. 2 ) and several purine ring deformations normal modes ranges between 15 and 17% . On the other hand, the internal NH2 angle does not contribute to the decomposition of the and normal modes which are 92% stretching of the C2=O2 bond and 82% and 17% stretchings of the N-H bonds, respectively.
2.2 Anharmonic Coupling Patterns
In this section we explore the second possibility to generate multidimensional PES, i.e. a Taylor expansion in terms of normal mode coordinate with respect to the geometry of the stable structure. Including terms of to fourth order we have (using dimensionless coordinates)
| (2) |
Third and fourth order anharmonic coupling constants are then calculated using a combination of analytical second derivatives and finite differences schneider89:367 . Specifically, we have used the symmetric expressions csaszar98:13
| (3) |
| (4) |
Here, is the Hessian calculated at displaced geometries where for the displacement we used for the cubic and for the quartic force field. Note that for the construction of the Hamiltonian we have neglected contributions which are off-resonant by more than 1000 cm.
| 3401 | 1799 | 1713 | 1720 | |
| -261 | 61 | -19 | -31 | |
| 24 | 5 | 4 | 2 |
In the following we will focus on the case of two water molecules only, i.e. AT-(H2O)2, since this already contains the essential effect of hydrogen-bonding waters as discussed in the previous section. The diagonal force constants for the four target modes of Fig. 2 (right panel) are given in Table 4. Important third order anharmonic coupling constants involving the mode are compiled in Table 5. As expected the diagonal anharmonic force constants are largest for the mode. More interesting, however, is the coupling pattern between this mode and the fingerprint modes. Here, we observe two dominating Fermi-type resonance couplings: (i) to the bending overtone 2 which is by far the strongest coupling, (ii) to the combination tone between the and the modes. In Table 5 we also give the couplings for the isolated AT case. Notice that here only the 2 overtone is strongly coupled. In other words, the presence of water establishes as new coupling channel. And, going back to Fig. 2 it requires a water molecule at the C4=O4 site which mixes the and the modes.
| -1 (-2) | 5 (8) | 0 (-2) | |
| 96 (87) | -66 (-17) | ||
| 11 (2) |
| mode | 4D (AT) | 4D | 6D | exp. |
|---|---|---|---|---|
| 3330 | 3297 | 3280 | 3215 | |
| 1758 | 1796 | 1792 | 1716 | |
| 1719 | 1718 | 1708 | 1665 | |
| 1645 | 1709 | 1702 | 1665 |
The fundamental transition frequencies obtained from this 4D anharmonic force field are given in Table 6 which besides the experimental values contains frequencies calculated for a 6D model which additionally includes most strongly coupled water stretching and bending modes at the N6-H site heyne08:7909 . Inspecting 4D and 6D cases we notice that the effect of explicit inclusion of water modes is only modest especially in comparison to the isolated case (4D(AT), see also Table 1). Given the simplicity of the model, the agreement between theory and experiment is rather reasonable with deviations being about 2% except for the mode whose frequency is about 4% below the experimental value. Perhaps this is not very surprising as the C2=O2 mode is close to the thymine N1 site where in DNA the base is linked to the backbone.
3 Experimental Section
3.1 Methods
A-T DNA double strand oligomers with sodium counterions and a length of 20 base pairs were obtained from Biotherm, and were dissolved in water and dried on a CaF2 window at 293 K in an atmosphere of 52% relative humidity (saturated solution of NaHSO4.H2O at 20∘ Celsius obrien48:73 ). This results in DNA samples with approximately 4 to 6 water molecules per base pair sutherland57:446 (sample thickness 6.5 m). It has been reported that under these conditions AT DNA oligomers adopt the B’-form adam86:3220 . Femtosecond time-resolved IR pump-probe experiments were performed with two independently tunable femtosecond pulses generated by parametric conversion processes pumped by a regenerative Ti:sapphire laser system (800 nm, repetition rate 1 kHz, pulse duration 100 fs) kaindl00:2086 . The central frequency of the pump pulse was varied from 1630 to 1760 cmand the probe was centred around 1650 cmor 3200 cm. The cross correlation between pump and probe pulses had a temporal width of 130 fs (FWHM). With the used pump pulse energy of 1 J approximately 2% of the AT base pairs in the sample volume were excited. After interaction with the sample, the probe pulses were spectrally dispersed and detected with a HgCdTe detector array (resolution 5 cm).
3.2 Experimental Results
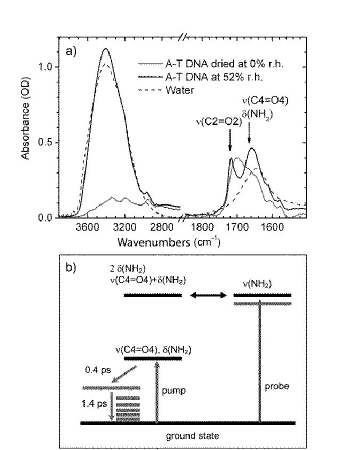
The absorption between 3050 and 3600 cm(see Fig. 4a and 5, solid line) is dominated for more than 85% by the broad OH stretching absorption of water molecules. Therefore, it is not possible to directly determine the stretch absorption frequency of the DNA oligomer from this absorption spectrum. In the fingerprint region, the absorption of is located at 1716 cmand the combined absorption of and peaks at 1665 cm(see Fig. 4a, solid line) tsuboi69:45 ; clark85 ; howard65:801 ; falk63:387 ; ghomi90:691 ; krishnan07:132 . Both the and the vibration absorb at 1665 cmand therefore
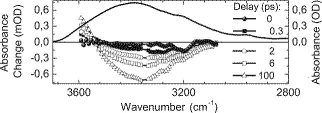
cannot be excited separately in our experiment. Figure 5 shows results of femtosecond pump-probe experiments with excitation in the fingerprint region and probing between 3050 and 3600 cm. Excitation with a broad pump pulse at 1740 cm(FWHM 170 cm) leads to an instantaneous spectrally narrow response around 3200 cm. Furthermore, a spectrally broad response over the entire range of 3050 cmto 3600 cmis seen to increase on a picosecond time scale (see Fig. 5). At 1740 cmthe pump pulse mainly excites the stretching vibration. Given the photon energy and pulse intensity, two-photon excitation of vibrations around 3300 cmis unlikely by the pump pulse. As a consequence, both the instantaneous and the increasing broad negative signal must result from exciting vibrations in the fingerprint region. The broad negative signal, which becomes positive above 3530 cm, is known to correspond to the OH stretching vibration of hot bulk water. Excess energy in low frequency vibrations of water (e.g. librations) weakens the HB strength, resulting in an increase of the OH stretching force constant, and therefore a higher OH stretching frequency nibbering04:1887 ; nienhuys99:1494 ; huse05:389 . The instantaneous narrow response around 3200 cm, after excitation at 1740 cm, decreases in time and should therefore correspond to a different process.
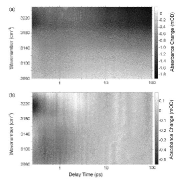
Figure 6 shows absorbance changes in the range between 3050 and 3250 cm, upon excitation at 1630 cm(FWHM 160 cm), before and after subtraction of the spectrally broad 13 ps component of the hot water formation, obtained from a global fit. At 1630 cmthe pump pulse mainly excites the and vibrations. An instantaneous bleach signal is observed with a maximum at 3215 cmand a width of 50 cm, which decays on a subpicosecond time scale. The perturbed free induction decay of this band gives a total dephasing time T2 of 0.5 0.1 ps, which corresponds to a homogeneous line width of 21 5 cm. This indicates that the origin of the observed 50 cmwidth of the bleaching band is not caused by a single homogenously broadened absorption line. The maximum of the instantaneous response at 3215 cmdecays with a 0.6 0.2 ps time constant. Around 3130 cma positive signature seems to be present for early delay times evolving into a negative band with a rise time of about 0.4 ps, that decays with a time constant of 1.4 0.4 ps. The time constants characterizing the kinetics for various pump-probe wavelength combinations are summarized in Table 7.
| mode | pump (cm) (FWHM) | probe (cm) | time constants (ps) |
|---|---|---|---|
| 1630 (160) | 3215 | (d) 0.6 0.2 // (d) 3.0 1.5 // (r) 13 2 | |
| a | 1630 (160) | 3130 | (r) 0.4 0.2 // (d) 1.4 0.4 // (r) 13 2 |
| 1730 (90) | 3215 | (d) 0.9 0.4 // (r) 4.0 1.5 // (r) 13 | |
| 1760 (100) | 1725 | (d) 0.9 0.1 | |
| 1760 (100) | 1685 | (d) 0.7 0.1 | |
| 1630 (130) | 1720 | (d) 2.4 0.2 | |
| / | 1630 (130) | 1665 | (d) 0.4 0.1 // (d) 1.4 0.4 |
| 1630 (130) | 1650 | (d) 0.2 0.1 // (d) 1.0 0.2 | |
| 1630 (130) | 1640 | (r) 0.6 0.1 | |
| / | 1630 (130) | 1625 | (d) 0.5 0.1 |
a Suggested assignment (see text)
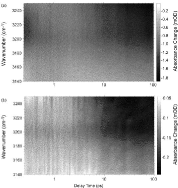
In order to identify the origin of the instantaneous bleaching signal at 3215 cmwe compared transients at 3215 cmafter excitation at 1630 cmand 1730 cm, respectively, in Fig. 7. Excitation at 1730 cmresults in a 7 times weaker and barely visible instantaneous negative signal around 3215 cm. In contrast, excitation around 1630 cmresult in a pronounced instantaneous signal around 3215 cm. Comparing the two transients at 3215 cm, we observe that, excitation at 1630 cmleads to a three-exponential decay of the bleach with 0.6 ps, 3 ps, and 13 ps. A transient with similar time constants (0.9 ps, 4 ps, and 13 ps), but very different amplitudes is observed after pumping at 1730 cm, where mainly the stretching vibration is excited. Thus, excitation in the spectral range of the / vibrations results in significant instantaneous signals around 3215 cm.
Experiments where both the pumping and probing takes place in the fingerprint region are presented in Fig. 8. In Fig. 8a the AT DNA oligomer sample was excited at 1760 cmand probed between 1605 and 1740 cm.
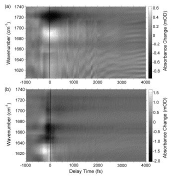
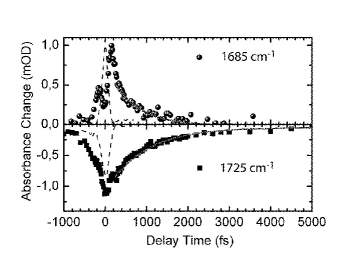
The pump-probe spectrum shows a negative band at 1725 cmand a positive band at 1685 cm. The band at 1725 cmdecays mono-exponentially with 0.9 0.1 ps, while the band at 1685 cmdecays with 0.7 0.1 ps. Transients at these frequency positions are presented together with their simulations in Fig. 9. The positive signal can be assigned to the = 1 2 transition. A similar lifetime was obtained by Zanni et al. for measurements on G-C DNA oligomers with excitation in the same frequency region krummel03:9165 . The difference between the 0.7 ps excited state lifetime and the 0.9 ps ground state recovery time signals is that the energy is first converted into excitation of lower frequency modes. As a consequence of this, the ground state absorption frequency is shifted due to anharmonic coupling to these lower frequency modes, and will not recover before these modes loose their excitation energy.
Results for excitation of the AT DNA oligomer at 1630 cm, presented in Fig. 8b, show bleaching signals at the ground state absorption positions of the vibration (1716 cm), the and vibrations (both 1665 cm), and the water vibration (1650 cm) tsuboi69:45 ; falk63:387 ; lee06:114508 ; huse05:389 . The bleach recovers exponentially with 2.4 0.2 ps on a significantly longer time scale than after direct excitation. This shows that there are at least two different energy relaxation pathways in DNA involving the vibration. For the / vibrations biexponential recoveries were observed with 0.4 0.1 ps and 1.4 0.4 ps, and for the water with 0.2 0.1 ps and 1.0 0.2 ps. For the bending vibration of water molecules in bulk water a lifetime of 170 30 fs huse05:389 has been reported, which agrees with the fast component observed here for . Instantaneous increased absorption signals below 1640 cm, decay with a time constant of 0.5 0.1 ps, matching the fast component of the / bleach recovery. In addition, a positive band appears around 1640 cm, rising in 0.6 0.1 ps. Signals at this spectral position have been assigned to the bending vibration of hot water molecules huse05:389 .
The dynamics of experiments with different pump frequencies in the fingerprint region, are compared to confirm that the bleach band at 3215 cmoriginates from the stretching vibration of adenine and not from water. First, we point out, that even the fastest recovery time of the bleach signal at 3215 cmafter excitation in the fingerprint region (where the water also absorbs), is three times slower than the reported lifetime of the water vibration huse05:389 . Second, the width of the bleaching band at 3215 cmof 50 cmis considerably narrower than the 200 cmestimate for the overtone band of bulk water wang04:9054 . Having assigned the 3215 cmbleaching signal to the AT DNA oligomer vibration, we now compare the dynamics at this frequency for excitation at 1630 cmvibration and 1730 cm, which correspond to the absorption bands of both the and vibrations, and the vibration, respectively.
For both excitation frequencies the picosecond dynamics, shown in Fig. 7, can be modelled by the same 13 ps time constant, corresponding to the rise of hot water signal due to energy transfer from the DNA oligomer to the water molecules. However, the initial sub-picosecond dynamics are markedly different for these two excitation frequencies, further confirming that both signals can not be due to the overtone excitation of the water . Although the absorption at both frequencies is comparable, the signal strength after excitation at 1630 cmis in fact seven times stronger than after excitation at 1730 cm, which indicates that the vibration couples substantially weaker to the vibration than both the and the vibration.
4 Discussion
A model summarizing the theoretical and experimental results is given in Fig. 4b. The calculated couplings of the , , and to the vibration indicate that excitation of either of these modes should result in a bleaching signal due to the shifting of the = 0 1 transition. The bleach signals in Fig. 7 around 3215 cmagree with this theoretical result. Furthermore, the force constants in Table 5 predict that excitation of the and vibrations should result in a larger shift of the vibration than of the vibration. This is confirmed by the data in Fig. 7. Experimentally, one cannot distinguish between the contributions of the and modes. From the force constants in Table 5, however, we conclude that excitation of the vibration is expected to have the most substantial effect on the shift of the vibration. The agreement between theoretical predictions and IR pump-probe measurements allows us to assign the bleaching signal at 3215 cmat least partially to the symmetric vibration of adenine. This absorption band lies about 100 cmlower in energy than the same mode in modified adenine-uracil Watson-Crick base pairs in solution woutersen04:5381 . The lower frequency of the hydrogen-bonded vibration in DNA films compared to single AU base pairs in CDCl3 solution can be rationalized by significant interactions with neighbouring base pairs and water molecules, that weaken the force constant. The theoretical results further show, that inclusion of water molecules leads to a HB between a water molecule and the NH2 group of adenine, and therefore a coupling of the adenine vibration and of the water bending vibration. Due to this coupling, this water molecule could act as a primary energy sink in energy disposal by DNA. Since the amount of water molecules and the coupling of water molecules to the nucleic acids is different for the major groove and the minor groove, one would expect different energy relaxation pathways with deviating time constants for energy flow from water to DNA and DNA to water, for both sides. Energy redistribution processes in DNA itself provide complex relaxation patterns as presented for the vibration.
In summary, the presented results demonstrate the capacity of combining IR-pump-probe methods with calculations on microsolvated base pairs to reveal information on and identify hidden vibrational absorption bands. The simulation of real condensed phase dynamics of HBs, however, requires to take into account all intra- and intermolecular interactions mentioned in the Introduction. As far as DNA is concerned, Cho and coworkers have given an impressive account on the dynamics of the CO fingerprint modes lee06:114508 ; lee06:114509 ; lee06:114510 ; lee07:145102 . Promising results for a single AU pair in deuterochloroform woutersen04:5381 have been reported recently using a Car-Parrinello based QM/MM scheme yanxx .
Acknowledgements.
We gratefully acknowledge financial support by the Deutsche Forschungsgemeinschaft (Sfb450) and the project MZOS 098-0352851-2921. We thank G. Kovacevic for his help concerning the normal mode decomposition.References
- (1) V. May, O. Kühn, Charge and Energy Transfer Dynamics in Molecular Systems, 2nd Revised and Enlarged Edition (Wiley–VCH, Weinheim, 2004)
- (2) E.T.J. Nibbering, T. Elsaesser, Chem. Rev. 104, 1887 (2004)
- (3) K. Heyne, E.T.J. Nibbering, T. Elsaesser, M. Petković, O. Kühn, J. Phys. Chem. A 108, 6083 (2004)
- (4) E.T.J. Nibbering, J. Dreyer, O. Kühn, J. Bredenbeck, P. Hamm, T. Elsaesser, in Analysis and control of ultrafast photoinduced reactions, Springer Series in Chemical Physics, vol. 87, ed. by O. Kühn, L. Wöste (Springer Verlag, Heidelberg, 2007), p. 619
- (5) K. Giese, M. Petković, H. Naundorf, O. Kühn, Phys. Rep. 430, 211 (2006)
- (6) Y. Maréchal, The Hydrogen Bond and the Water Molecule (Elsevier, Amsterdam, 2007)
- (7) M. Tsuboi, Applied Spectroscopy Reviews 3, 45 (1969)
- (8) R. Clark, R. Hester, Advances in Infrared and Raman Spectroscopy, vol. 12 (Wiley Heyden Ltd., New York, 1985)
- (9) R. Letellier, M. Ghomi, E. Taillandier, J. Biomol. Struct. Dyn. 4, 663 (1987)
- (10) J. Florián, V. Hrouda, P. Hobza, J. Am. Chem. Soc. 116, 1457 (1994)
- (11) J. Florián, J. Leszczynski, B. Johnson, J. Mol. Struct. 349, 421 (1995)
- (12) M. Ouali, H. Gousset, F. Geinguenaud, J. Liquier, J. GabarroArpa, M. LeBret, E. Taillandier, Nucleic Acids Res. 25, 4816 (1997)
- (13) O. Shishkin, J. Sponer, P. Hobza, J. Mol. Struct. 477, 15 (1999)
- (14) F. Howard, H. Miles, J. Biol. Chem. 240, 801 (1965)
- (15) V. Spirko, J. Sponer, P. Hobza, J. Chem. Phys. 106, 1472 (1997)
- (16) J. Sponer, H. Gabb, J. Leszczynski, P. Hobza, Biophys. J. 73, 76 (1997)
- (17) M. Brandl, K. Lindauer, M. Meyer, J. Suhnel, Theor. Chem. Acc. 101, 103 (1999)
- (18) J. Sponer, J. Leszczynski, P. Hobza, J. Mol. Struct.-Theochem 573, 43 (2001)
- (19) E. Nir, C. Janzen, P. Imhof, K. Kleinermanns, M. de Vries, Phys. Chem. Chem. Phys. 4, 740 (2002)
- (20) A. Krummel, P. Mukherjee, M. Zanni, J. Phys. Chem. B 107, 9165 (2003)
- (21) S. Woutersen, G. Cristalli, J. Chem. Phys. 121, 5381 (2004)
- (22) C. Lee, K. Park, M. Cho, J. Chem. Phys. 125, 114508 (2006)
- (23) C. Lee, M. Cho, J. Chem. Phys. 125, 114509 (2006)
- (24) C. Lee, K.H. Park, J.A. Kim, S. Hahn, M. Cho, J. Chem. Phys. 125, 114510 (2006)
- (25) C. Lee, M. Cho, J. Chem. Phys. 126, 145102 (2007)
- (26) W. Saenger, Principles of Nucleic Acid Structure (Springer-Verlag, New York, 1984)
- (27) V. Parvathy, S. Bhaumik, K. Chary, G. Govil, K. Liu, F. Howard, H. Miles, Nucleic Acids Res. 30, 1500 (2002)
- (28) N. Pattabiraman, Biopolymers 25, 1603 (1986)
- (29) A. Pichler, S. Rudisser, R. Winger, K. Liedl, A. Hallbrucker, E. Mayer, Chem. Phys. 258, 391 (2000)
- (30) E. Taillandier, J. Ridoux, J. Liquier, W. Leupin, W. Denny, Y. Wang, G. Thomas, W. Peticolas, Biochemistry 26, 3361 (1987)
- (31) M. Falk, K. Hartman, R. Lord, J. Am. Chem. Soc. 85, 387 (1963)
- (32) J. Vargason, K. Henderson, P. Ho, Proc. Natl. Acad. Sci. 98, 7265 (2001)
- (33) X. Shui, C.C. Sines, L. McFail-Isorn, D. VanDerveer, L.D. Williams, Biochemistry 37, 16877 (1998)
- (34) H. Miles, Proc. Natl. Acad. Sci. 51, 1104 (1964)
- (35) S. Adam, J. Liquier, J. Taboury, E. Taillandier, Biochemistry 25, 3220 (1986)
- (36) J. Liquier, A. Akhebat, E. Taillandier, F. Ceolin, T. Dinh, J. Igolen, Spectrochim. Acta Part A 47, 177 (1991)
- (37) G. Sutherland, M. Tsuboi, Proc. Royal Soc. London Series A 239, 446 (1957)
- (38) M. Ghomi, R. Letellier, J. Liquier, E. Taillandier, Int. J. Biochem. 22, 691 (1990)
- (39) J. Benevides, G. Thomas, Nucleic Acids Res. 11, 5747 (1983)
- (40) M. Cowan, B. Bruner, N. Huse, J. Dwyer, B. Chugh, E. Nibbering, T. Elsaesser, R. Miller, Nature 434, 199 (2005)
- (41) K. Heyne, N. Huse, J. Dreyer, E. Nibbering, T. Elsaesser, S. Mukamel, J. Chem. Phys. 121, 902 (2004)
- (42) P. Jurecka, J. Sponer, J. Cerny, P. Hobza, Phys. Chem. Chem. Phys. 8, 1985 (2006)
- (43) M. Kabelac, L. Zendlova, D. Reha, P. Hobza, J. Phys. Chem. B 109, 12206 (2005)
- (44) M. Kabelac, P. Hobza, Phys. Chem. Chem. Phys. 9, 903 (2007)
- (45) C. Fonseca-Guerra, F. Bickelhaupt, J. Snijders, E. Baerends, J. Am. Chem. Soc. 122, 4117 (2000)
- (46) G. Villani, Chem. Phys. 316, 1 (2005)
- (47) L. Gorb, Y. Podolyan, P. Dziekonski, W. Sokalski, J. Leszczynski, J. Am. Chem. Soc. 126, 10119 (2004)
- (48) G.M. Krishnan, O. Kühn, Chem. Phys. Lett. 435, 132 (2007)
- (49) B. Brauer, R. Gerber, M. Kabelac, P. Hobza, J. Bakker, A. Riziq, M. de Vries, J. Phys. Chem. A 109, 6974 (2005)
- (50) A. Krummel, M. Zanni, J. Phys. Chem. B 110, 13991 (2006)
- (51) A. Kumar, P.C. Mishra, S. Suhai, J. Phys. Chem. A 109, 3971 (2005)
- (52) M.J. Frisch, G.W. Trucks, H.B. Schlegel, G.E. Scuseria, M.A. Robb, J.R. Cheeseman, J.A. Montgomery, Jr., T. Vreven, K.N. Kudin, J.C. Burant, J.M. Millam, S.S. Iyengar, J. Tomasi, V. Barone, B. Mennucci, M. Cossi, G. Scalmani, N. Rega, G.A. Petersson, H. Nakatsuji, M. Hada, M. Ehara, K. Toyota, R. Fukuda, J. Hasegawa, M. Ishida, T. Nakajima, Y. Honda, O. Kitao, H. Nakai, M. Klene, X. Li, J.E. Knox, H.P. Hratchian, J.B. Cross, V. Bakken, C. Adamo, J. Jaramillo, R. Gomperts, R.E. Stratmann, O. Yazyev, A.J. Austin, R. Cammi, C. Pomelli, J.W. Ochterski, P.Y. Ayala, K. Morokuma, G.A. Voth, P. Salvador, J.J. Dannenberg, V.G. Zakrzewski, S. Dapprich, A.D. Daniels, M.C. Strain, O. Farkas, D.K. Malick, A.D. Rabuck, K. Raghavachari, J.B. Foresman, J.V. Ortiz, Q. Cui, A.G. Baboul, S. Clifford, J. Cioslowski, B.B. Stefanov, G. Liu, A. Liashenko, P. Piskorz, I. Komaromi, R.L. Martin, D.J. Fox, T. Keith, M.A. Al-Laham, C.Y. Peng, A. Nanayakkara, M. Challacombe, P.M.W. Gill, B. Johnson, W. Chen, M.W. Wong, C. Gonzalez, J.A. Pople, Gaussian 03, Revision B.04. Gaussian Inc., Wallingford, CT (2004)
- (53) S. Carter, S.J. Culik, J.M. Bowman, J. Chem. Phys. 107, 10458 (1997)
- (54) J.K.G. Watson, Mol. Phys. 15, 479 (1968)
- (55) M. Bounouar, C. Scheurer, Chem. Phys. 323, 87 (2006)
- (56) J.A. Boatz, M. S.Gordon, J. Phys. Chem. 93, 1819 (1989)
- (57) W. Schneider, W. Thiel, Chem. Phys. Lett. 157, 367 (1989)
- (58) A.G. Csaszar, in Encyclopedia of Computational Chemistry, ed. by P. v. Rague-Schleyer (John Wiley & Sons, Hoboken, 1998), p. 13
- (59) K. Heyne, G.M. Krishnan, O. Kühn, J. Phys. Chem. B 112, 7909 (2008)
- (60) F. Obrien, J. Sci. Instr. Phys. Ind. 25, 73 (1948)
- (61) R. Kaindl, M. Wurm, K. Reimann, P. Hamm, A. Weiner, M. Woerner, J. Opt. Soc. Am. B 17, 2086 (2000)
- (62) H. Nienhuys, S. Woutersen, R. van Santen, H. Bakker, J. Chem. Phys. 111, 1494 (1999)
- (63) N. Huse, S. Ashihara, E. Nibbering, T. Elsaesser, Chem. Phys. Lett. 404, 389 (2005)
- (64) Z. Wang, A. Pakoulev, Y. Pang, D. Dlott, J. Phys. Chem. A 108, 9054 (2004)
- (65) Y. Yan, G.M. Krishnan, O. Kühn, arXiv:0807.2765 [physics.chem-ph]