What did we learn from the extremely bright gamma ray bursts 990123 and 080319B?
Abstract
The two brightest and so far the best studied gamma ray bursts (GRBs), 990123 and 080319B, were ordinary, highly collimated GRBs produced in a core collapse supernova explosion within a high-density wind environment and observed from a very near-axis viewing angle. Inverse Compton scattering (ICS) and synchrotron radiation (SR), the two dominant radiation mechanisms in the cannonball (CB) model of GRBs, together with the burst environment, provide a very simple and sufficiently accurate description of the multiwavelength lightcurves of their prompt and afterglow emissions.
1 Introduction
Two models have been used extensively to analyze Gamma ray bursts (GRBs) and their afterglows (AGs), the fireball (FB) model (for recent reviews see, e.g., Mészáros 2002, 2006; Zhang 2007) and the cannonball (CB) model (Dar & De Rújula 2004, hereafter DD2004; Dado & Dar 2008a,b, hereafter DD2008a,b, and references therein). Despite their similar names, the two models are (or were) entirely different (e.g., Piran 1999), hence only one of them, if either, may provide a faithful physical description of GRBs. Until recently, the FB model has been widely accepted as that model. However, the rich data on GRBs accumulated from space based observations, in particular from the Swift satellite, complemented by early time data from ground based robotic telescopes and late-time follow-up observations with larger telescopes, have challenged this prevailing view. Kumar et al. (2007) concluded that the prompt -ray emission cannot be produced in shocks, internal or external. Zhang, Liang and Zhang (2007) found that the fast decay and rapid spectral softening ending the prompt gamma-ray and X-ray emission cannot be explained simultaneously by high latitude emission. The X-ray and optical afterglows (AGs) of the Swift GRBs were found to be chromatic at early time (Covino et al. 2006) and to have chromatic breaks (Panaitescu et al. 2006) which differ significantly from the jet breaks expected in the collimated fireball model of AGs. Burrows and Racusin (2007) examined the XRT light curves of the first Swift GRBs and reported that the expected jet breaks are extremely rare. In particular, Liang et al. (2008) have analyzed the Swift X-ray data for the 179 GRBs detected between January 2005 and January 2007 and the optical AGs of 57 pre- and post-Swift GRBs. They found that not a single burst satisfies all the criteria of a jet break.
In spite of the above, not all authors are so critical and they believe that the GRB data require only some modifications of the standard FB model in order to accommodate the results (e.g., Panaitescu 2006; Dai et al. 2007; Sato et al. 2007; Kumar and Panaitescu 2008). Other authors seem to ignore the failures of the FB model and continue to interpret the observations with the FB model hypotheses (‘internal and external shocks’, ‘colliding conical shells’, ‘forward and reverse shocks’, ‘continuous energy injection’) and parametrize the data with freely adopted formulae (e.g., ‘segmented power laws’) which were never derived explicitly from underlying physical assumptions (for recent examples, see, e.g., Bloom et al. (21 authors) 2008; Racusin et al. (93 authors) 2008).
The situation concerning the CB model is different. The predictions of the model were derived in fair approximations from its underlying assumptions. They were shown to describe correctly the main observed properties of GRBs and reproduce successfully the diverse broad band light curves of large representative sets of both long GRBs and XRFs (e.g., DD2004; DD2008a and references therein) and short hard bursts (DD2008b). In this paper, we demonstrate these for the GRBs 990123 and 080319B, the brightest GRBs observed so far that have the best sampled and the most accurately measured multiwavelegth light curves of the prompt and afterglow emission. We show that the two underlying radiation mechanisms of the CB model, inverse Compton scattering (ICS) and synchrotron radiation (SR), and the burst environment suffice within the CB model provide a very simple and successful description of the observed light curves of their prompt and afterglow emissions.
2 GRBs 990123 and 080319B
GRB 990123, at redshift (Kulkarni et al. 1999a; Andersen et al. 1999), with the highest known gamma ray energy under the assumption of isotropic emission, erg, was detected and localized by the Burst And Transient Source Experiment (BATSE) on board the Compton Gamma Ray Observatory (CGRO), which measured its light curves in the 20-50 keV, 50-100 keV, 100-300 keV and 300 keV BATSE channels (see e.g., Fig. 3), and at higher energies by the COMPTEL, OSSE and EGRET instruments (Briggs et al. 1999). It was also detected and localized by the Gamma Ray Burst Monitor (GRBM) aboard the BeppoSAX satellite (Maiorano et al. 2005), which measured its lightcurve and spectrum in the range 2-700 keV for the first 80 s before the burst entered Earth occulation. The BeppoSAX measurements were resumed after it came out of the Earth occulation and ended 2.49 days after burst because of diminishing statistics. GRB 990123 was also the first GRB in which an optical emission was detected during the prompt /X-ray emission. The emission, which was detected by the Robotic Optical Transient Search Experiment (ROTSE) at Los Alamos National Laboratories, was triggered by BATSE 22 s after the onset of the burst, brightened and peaked at magnitude , about 50 s after the GRB onset, and decayed rapidly with time (Akerlof et al. 1999) which was followed in the bands with large ground based telescopes (Castro-Tirado et al. 1999; Galama et al. 1999; Kulkarni et al. 1999a; Fruchter et al. 1999; Holland et al. 2000 and references therein) and with the Hubble Space Telescope until it faded to a magnitude , two months after burst (Fruchter et al. 2000). The broad band -ray, X-ray, and lightcurves of GRB 990123 were reanalyzed recently within the synchrotron fireball (FB) model by Corsi et al. (2005). Essentially they found that the spectral and temporal properties of the prompt optical emission are uncorrelated to the and X-ray emission, implying different physical origins, that the optical and X-ray afterglow lightcurves are chromatic contrary to expectations and that their spectral and temporal power-law decays do not satisfy the correlations expected in the FB model.
GRB 080319B at redshift was simultaneously detected by the Swift-Burst Alert Telescope (BAT) and the Konus gamma-ray detector aboard the Wind satellite (Racusin et al. 2008; Golenetskii et al. 2008). The location of GRB 080319B was fortuitously only 10o away from GRB 080319A, which was detected by Swift less than 30 minutes earlier, and allowed several wide field telescopes to detect the optical emission of GRB 080319B instantly. It peaked 26 s after the Swift trigger at magnitude (Racusin et al. 2008; Wozniak et al. 2008) visible to the naked eye. The extreme brightness of the burst and its gamma-ray, X-ray and afterglows led to a flurry of follow-up observations with a variety of space- and ground-based telescopes, which were summarized in Bloom et al. 2008, Racusin et al. 2008 and Wozniak et al. 2008. GRB 080319B was quite similar to GRB 990123 in many respects. Its isotropic equivalent gamma-ray energy release was erg, similar to that of GRB 990123. Like in GRB 990123, the fast spectral variation of its hard X-ray and gamma ray emission was well parametrized with an exponentially cut-off power-law with a cut-off energy that was strongly correlated with the peak structure of the lightcurve and a low-energy photon spectral index, , which changed abruptly into after the fast decay phase of the prompt emission (e.g., Fig. 10). The optical and gamma-ray light curves during the explosion were not correlated (see, e.g., Fig. 1 in Racusin et al. 2008): The onset of the optical emission lagged behind the gamma ray emission by several seconds and decayed more slowly at the end of the prompt emission. The typical time scales of their temporal variability were entirely different. The extremely bright optical emission could not be reconciled with a single emission mechanism - extrapolating the gamma-ray spectrum to the optical band underestimates the optical flux by more than 4 orders of magnitude. Their spectra were also quite different. Contrary to expectations, the X-ray and afterglow light curves were also chromatic, with no ‘jet breaks’ and with spectral and temporal power-law decays which did not satisfy the correlations expected in the FB model (see, however, Bloom et al. 2008 (21 authors); Racusin et al. 2008 (93 authors!); Wozniak et al 2008; Kumar and Panaitescu 2008 for attempts to reconcile the observations with the FB model).
3 The CB model
In the CB model (e.g., DD2004 and references therein) long-duration GRBs and their AGs are produced by bipolar jets of highly relativistic plasmoids of ordinary matter (Shaviv & Dar 1995, Dar 1998) ejected in core-collapse supernova (SN) explosions (Dar & Plaga 1999). An accretion disk or a torus is hypothesized to be produced around the newly formed compact object, either by stellar material originally close to the surface of the imploding core and left behind by the explosion-generating outgoing shock, or by more distant stellar matter falling back after its passage (De Rújula 1987). As observed in microquasars (e.g., Mirabel & Rodriguez 1999, Rodriguez & Mirabel 1999 and references therein), each time part of the accretion disk falls abruptly onto the compact object, two jets of cannonballs (CBs) made of ordinary-matter plasma are emitted with large bulk-motion Lorentz factors in opposite directions along the rotation axis, wherefrom matter has already fallen back onto the compact object due to lack of rotational support. The prompt -ray and X-ray emission is dominated by inverse Compton scattering (ICS) of photons of the SN glory - light scattered/emitted by the pre-supernova wind blown from the progenitor star. The CBs’ electrons Compton up-scatter the glory photons to -ray energies and collimate them into a narrow beam along the CBs’ directions of motion.
A second mechanism besides ICS that generates radiation by a CB is synchrotron radiation (SR). The CBs which initially expand in their rest frame with the speed of sound in a relativistic plasma, collide and merge in a short time into a few leading CBs. The jet of CBs encounters matter in its voyage through the wind/ejecta blown by the progenitor star and then through the interstellar medium (ISM), which is ionized by the beamed radiation of the very same CBs. The ISM ions continuously impinging on a CB generate within it a turbulent magnetic field, which is assumed to be in approximate energy equipartition with their energy. In this field the Fermi accelerated CB and ISM intercepted electrons emit synchrotron radiation. The initial expansion of a CB produces a rapidly rising lightcurve which stops rising when the expansion slows down. When the CB expansion stops, its emission turns into a decline which traces the circumburst density of the pre-supernova wind/ejecta blown by the progenitor star into the roughly constant ISM density. Only when the CB has swept a mass comparable to its rest mass, does the continuous collision with the medium begins to decelerate it effectively, which results in a gradual steepening (break) of its SR afterglow lightcurve into an asymptotic power-law decay.
4 Correlations between the prompt emission observables
Straightforward consequences of the CB model are simple correlations among various properties of the prompt emission pulses (Dar & De Rújula 2000, hereafter DD2000). For instance, the relativistic boosting and beaming of the glory photons by a CB yield the relations (DD2000; DD2004),
| (1) |
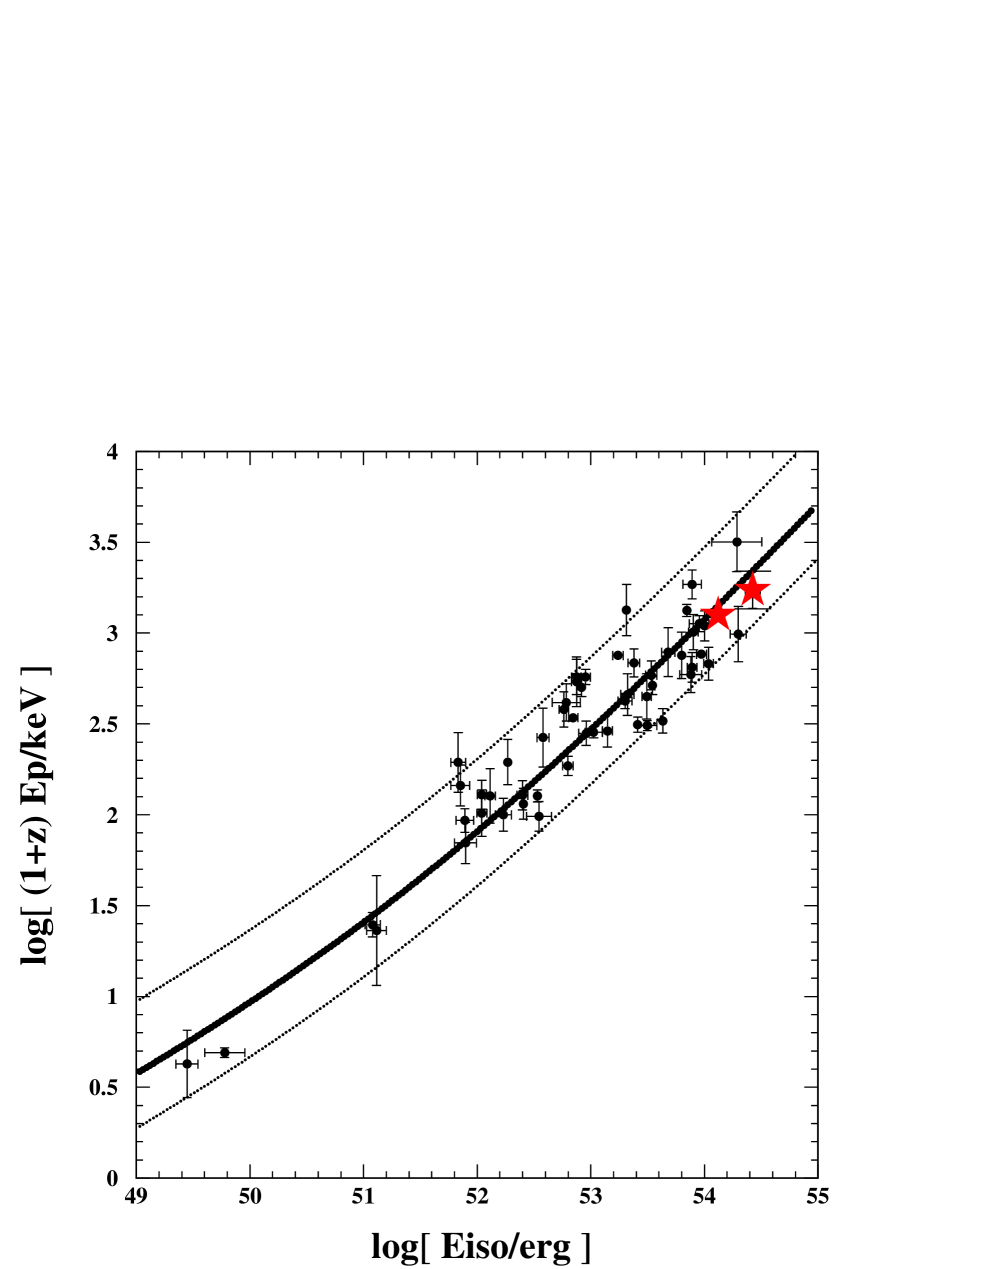
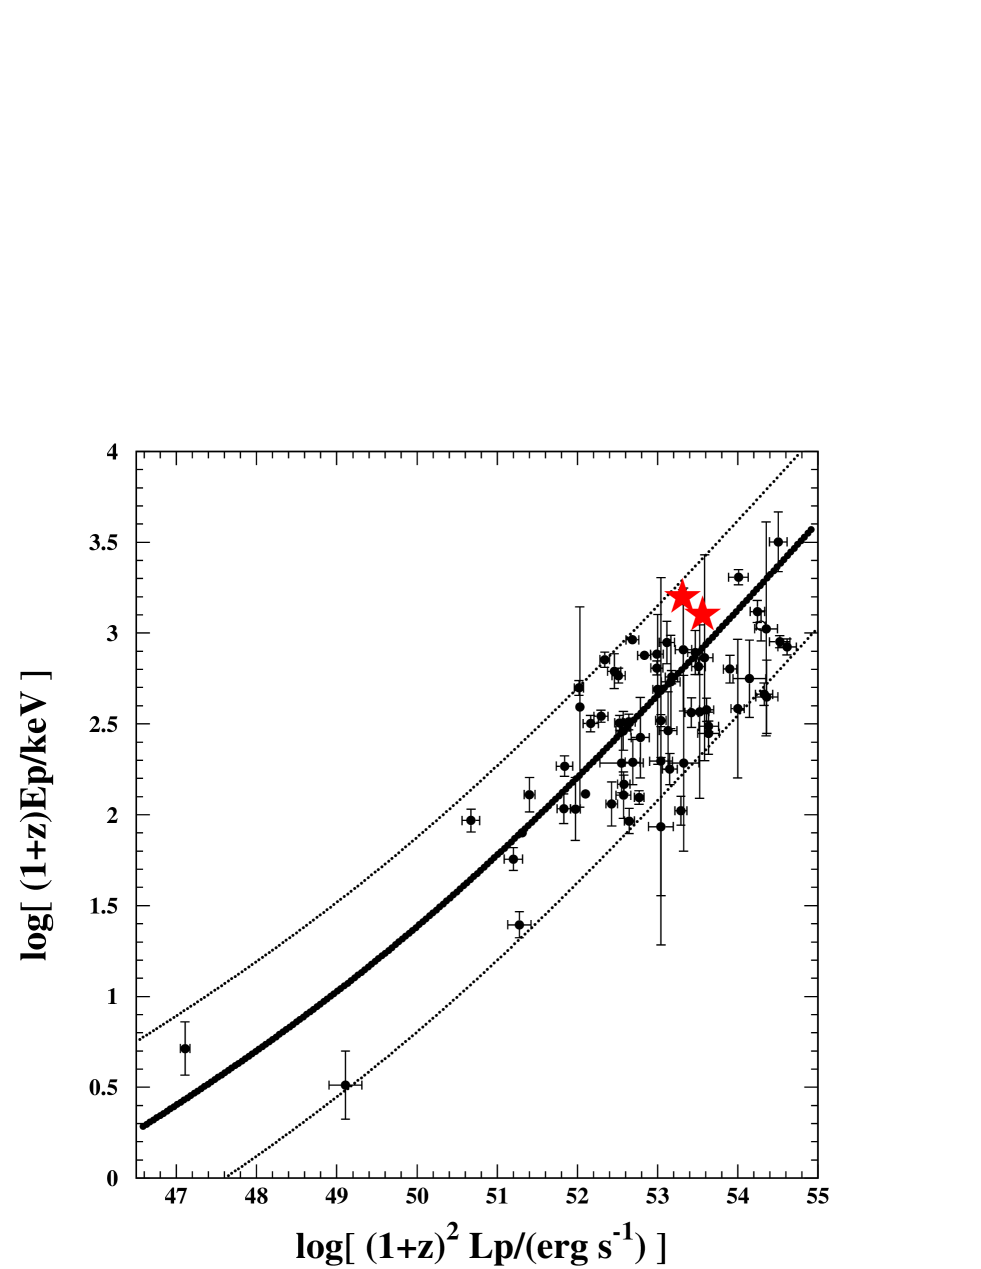
where is the isotropic equivalent gamma ray energy, is the peak isotropic equivalent luminosity, is the photon energy at peak energy flux density of an ICS pulse, is the bulk motion Lorentz factor of a CB, and is its Doppler factor with being the angle between the line of sight to the CB and its direction of motion. For and , to an excellent approximation. The strong dependence of observables such as and on and and the narrow distribution of around result in correlations among them. The observed correlations between and and between and in GRBs with known redshift are shown in Figs. 1a,1b. The correlations predicted by the CB model (e.g. DD2000; DD2004; Dado, Dar & De Rújula 2007, hereafter DDD2007), which are indicated by the thick lines in these figures, well represent the observed correlations (e.g., Amati 2002,2006) and are also well satisfed by GRBs 990123 and 080319B. The locations of GRBs 990123 and 080319B in these correlation plots and in the other well established correlations in GRBs (see, e.g., DDD2007) suggest that GRBs 990123 and 080319B were probably ordinary GRBs viewed very near axis, The most probable viewing angle of GRBs, , yields , while for small viewing angles, and then , yielding a rest frame , and , which are 2 times larger, 8 times more energetic and 16 times brighter, respectively, than their mean values observed in long GRBs with the most probable . The inferred large Lorentz and Doppler factors of GRBs 990123 and 080319B, coupled with a high-density wind/ejecta blown by their progenitor stars before the supernova explosion, explains their initially extreme optical brightness and the lack of ‘jet breaks’ in their afterglows (Dado, Dar & De Rújula 2008b, hereafter DDD2008b).
5 The spectrum of ICS pulses
The predicted time-dependent spectrum of a GRB pulse is given by (DD2004):
| (2) |
The first term in Eq. 2 with , is the result of inverse Compton scattering of glory photons with a thin bremsstrahlung spectrum,
| (3) |
by the bulk of the CB’s electrons, which are comoving with it. The second term in Eq. (2) is induced by a very small fraction of ‘knocked on’ and Fermi accelerated electrons, whose initial spectrum (before Compton and synchrotron cooling) is , with . The effective temperature of the glory that decreases with distance yields (DD2008b)
| (4) |
where typically, eV, and is the time when the ICS contribution to reaches its peak value.
For , the peak energy of the time integrated spectrum of the ICS contribution, satisfies (see Appendix I).
For , the energy spectrum predicted by the CB model, Eq. (2), bears a striking resemblance to the Band function (Band et al. 1993) traditionally used to model the energy spectra of GRBs, but GRBs where the spectral measurements extended over a much wider energy range than that of BATSE and Swift/BAT, are better fit by Eq. 2 (e.g., Wigger et al. 2008). Moreover, the spectral evolution during the prompt emission pulses is well described by Eqs. (2) and (4) (Dado, Dar and De Ruj́ula 2008a, hereafter DDD2008a; DD2008a).
6 The lightcurve of an ICS pulses
An ICS pulse has an approximate lightcurve (DD2008a),
| (5) |
where is given by Eq. (2). At the relatively low X-ray energies covered by Swift and, more so, at smaller ones, the first term on the RHS of Eq. (2) usually dominates . Consequently, the lightcurve generated by a sum of ICS pulses at a luminosity distance is generally well approximated by:
| (6) |
where the index ‘i’ denotes the i-th pulse produced by a CB launched at an observer time , is given by Eq. (4) with replaced by and is a constant that depends on the radius of the CB, its Lorentz and Doppler factors, the density of the glory light and the redshift and distance of the GRB (DD2008a). Thus, in the CB model, each ICS pulse in the GRB light curve is effectively described by four parameters, and , which are a-priori unknown and thus are best fit to reproduce its observed light curve.
Setting , has the approximate form Such an evolution has been observed in the time-resolved spectrum of well isolated pulses (see, for instance, the insert in Fig. 8 of Mangano et al. 2007), until the ICS emission is overtaken by the broad band synchrotron emission from the swept-in ISM electrons. Hence, the temporal behaviour of the separate ICS peaks at is given by:
| (7) |
to which we shall refer as the ‘ law’. A simple consequence of this law is that unabsorbed ICS peaks for have approximately identical shape at different energies when plotted as a function of .
A few other trivial but important consequences of Eq. (7) for unabsorbed GRB peaks at are the following:
-
•
The peak time of a pulse is at,
(8) -
•
The full width at half maximum (FWHM) of a pulse is,
(9) and it extends from to .
-
•
The rise time (RT) from half peak value to peak value satisfies,
(10) independent of energy. It agrees with the empirical relation that was inferred by Kocevski et al. (2003) from BATSE bright GRBs, .
-
•
The FWHM increases with decreasing energy approximately like a power-law,
(11) This relation is consistent with the empirical relation, , satisfied by BATSE GRBs (Fenimore et al. 2003).
-
•
The onset-time, , of a pulse is simultaneous at all energies. But the peak times at different energies differ and the lower-energy ones ‘lag’ behind the higher-energy ones:
(12) -
•
The time averaged value of for GRB peaks, which follows from Eq. (4), satisfies:
(13)
7 The emission of synchrotron radiation
The ISM ions continuously impinging on a CB generate within it turbulent magnetic fields, which are assumed to be in approximate energy equipartition with their energy, . In this field, the intercepted electrons emit synchrotron radiation. The SR, isotropic in the CB’s rest frame, has a characteristic frequency, , the typical frequency radiated by the electrons that enter a CB at time with a relative Lorentz factor . In the observer’s frame:
| (14) |
where eV. The spectral energy density of the SR from a single CB at a luminosity distance is given by (DDD2003a):
| (15) |
where is the typical spectral index of the Fermi accelerated electrons, is the fraction of the impinging ISM electron energy that is synchrotron re-radiated by the CB, and is the attenuation of photons of observed frequency along the line of sight through the CB, the host galaxy (HG), the intergalactic medium (IGM) and the Milky Way (MW):
| (16) |
The opacity at very early times, during the fast-expansion phase of the CB, may strongly depend on time and frequency. The opacity of the circumburst medium [ at early times] is affected by the GRB and could also be - and -dependent. The opacities and should be functions of and , for the line of sight to the CBs varies during the AG observations, due to the hyperluminal motion of CBs.
7.1 Early-time SR
The initial rapid expansion of a CB slows down as it propagates through the wind and scatters its particles (DDD2002, DD2004). This expansion is roughly described by , where is the asymptotic radius of the CB. The effective deceleration of a CB begins only when it has swept a mass comparable to its rest mass (see next subsection). Until that time both and stay put at their initial values and and Eq. (15) yields an early-time SR light curve, where for and for . Since , a CB ejected into a windy density profile, , created by the mass ejection from the progenitor star prior to its SN explosion, emits SR with an early-time light curve,
| (17) |
For a jet of CBs ejected at times , the early SR lightcurve becomes the sum of such contributions from the individual CBs with the time replaced by, , the times after their ejection.
7.2 SR during the CB’s coasting phase
As it plows through the ionized ISM, a CB gathers and scatters its constituent ions, mainly protons.(DD2004). The scattered and re-emitted protons exert an inward pressure on the CB, countering its expansion. In the approximation of isotropic re-emission in the CB’s rest frame and a constant ISM density , one finds that, within minutes of observer’s time , a typical CB of baryon number reaches an approximately constant ‘coasting’ asymptotic radius cm, before it finally stops and blows up, after a journey of months of observer’s time. During the coasting phase, and in a constant density ISM, obeys (Dado et al. 2006):
| (18) |
the solution of which is,
| (19) |
with
| (20) |
The deceleration law is for the case in which the ISM particles re-emitted fast by the CB are a small fraction of the flux of the intercepted ones. As can be seen from Eq. (18), and change little as long as In terms of typical CB-model values of , , and ,
| (21) |
For , and decrease like The transition induces a bend (the so called ‘jet break’) in the synchrotron AG from a plateau to an asymptotic power-law decay,
| (22) |
with a power-law in time steeper by half a unit than that in frequency. In terms of the frequently used notation, the asymptotic behaviour satisfies, with
| (23) |
which is valid for a constant density.
For a fast falling density beyond a distance seen by CBs that encounter density bumps formed by stellar winds, or seen by CBs that escape the galactic bulge or disk into the galactic halo, and tend to a constant and becomes proportional to where . As a result, for a density profile beyond , the unabsorbed synchrotron afterglow as given by Eq. (15) tends to,
| (24) |
and satisfies the asymptotic relation,
| (25) |
Thus, unattenuated optical and X-ray AGs of GRBs may steepen at late times to an asymptotic decay, Such an achromatic steepening, which was seen in several late time optical and X-ray AGs of Swift GRBs (see Figs. 6,7 in DD2008b), may have been misinterpreted as very late ‘jet breaks’ (e.g., Dai et al. 2008; Racusin et al. 2008a). All the late time afterglows of Swift GRBs which are well sampled at late time seem to satisfy either the asymptotic relation (23) or (25). (see DDD2008b; DD2008b).
8 Comparison between theory and observations
8.1 GRB 990123
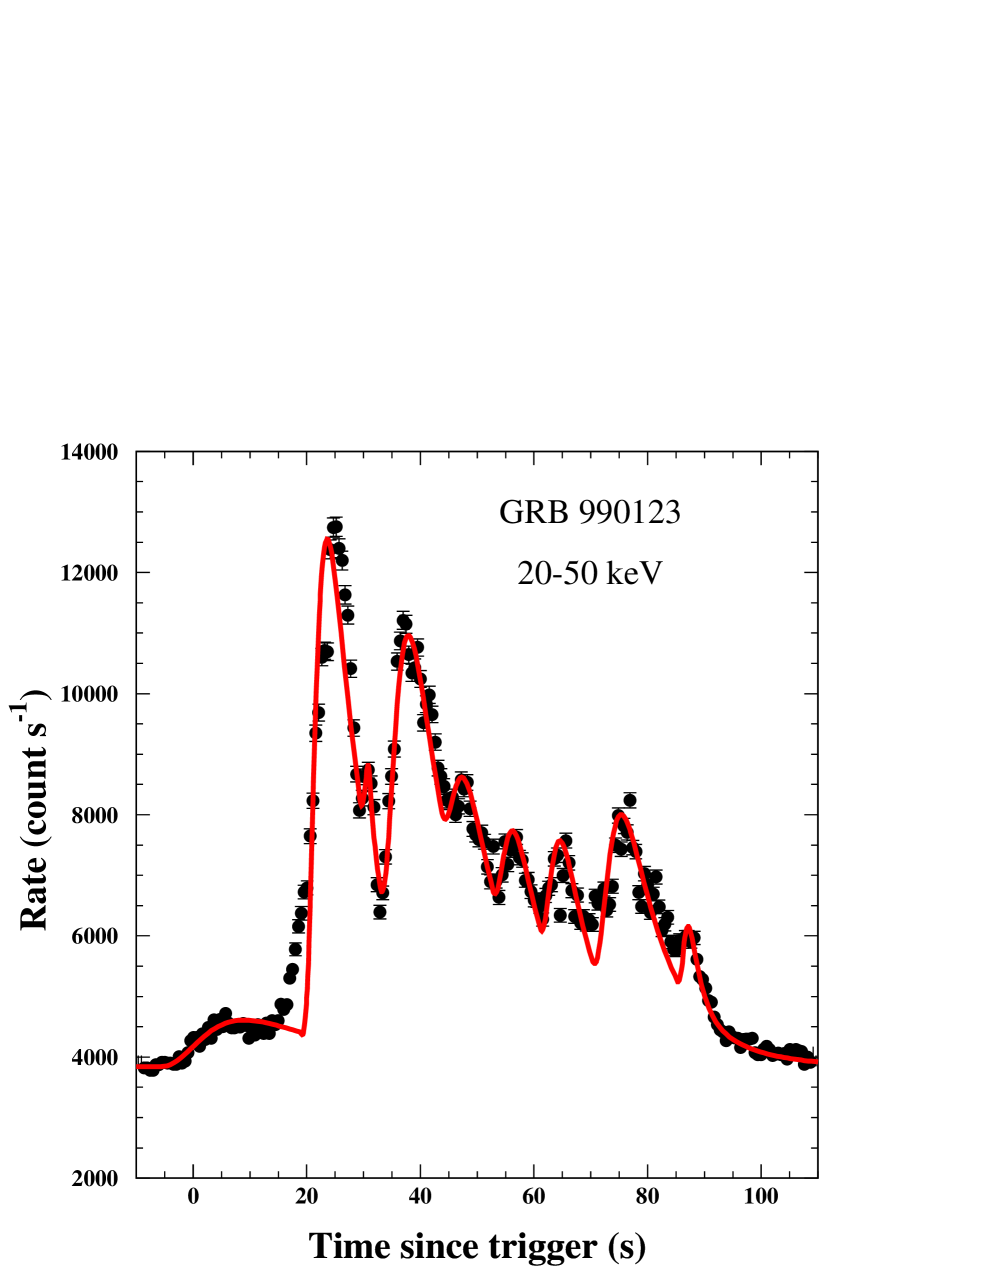
In Fig. 3 we compare the BATSE multipeak lightcurve of GRB 990123 in the 20-50 keV channel (Briggs et al. 1999) and its CB model description. The count-rate in the 20-50 keV energy band was calculated from the integral, using Eq. (6) with the best fit parameters which are listed in Table I for the 9 peaks suggested by the multichannel BATSE data and by the BeppoSAX data (Maiorano et al. 2005). As shown in Fig. 3 the shape of the peaks and the entire lightcurve are well reproduced by Eq. (6).
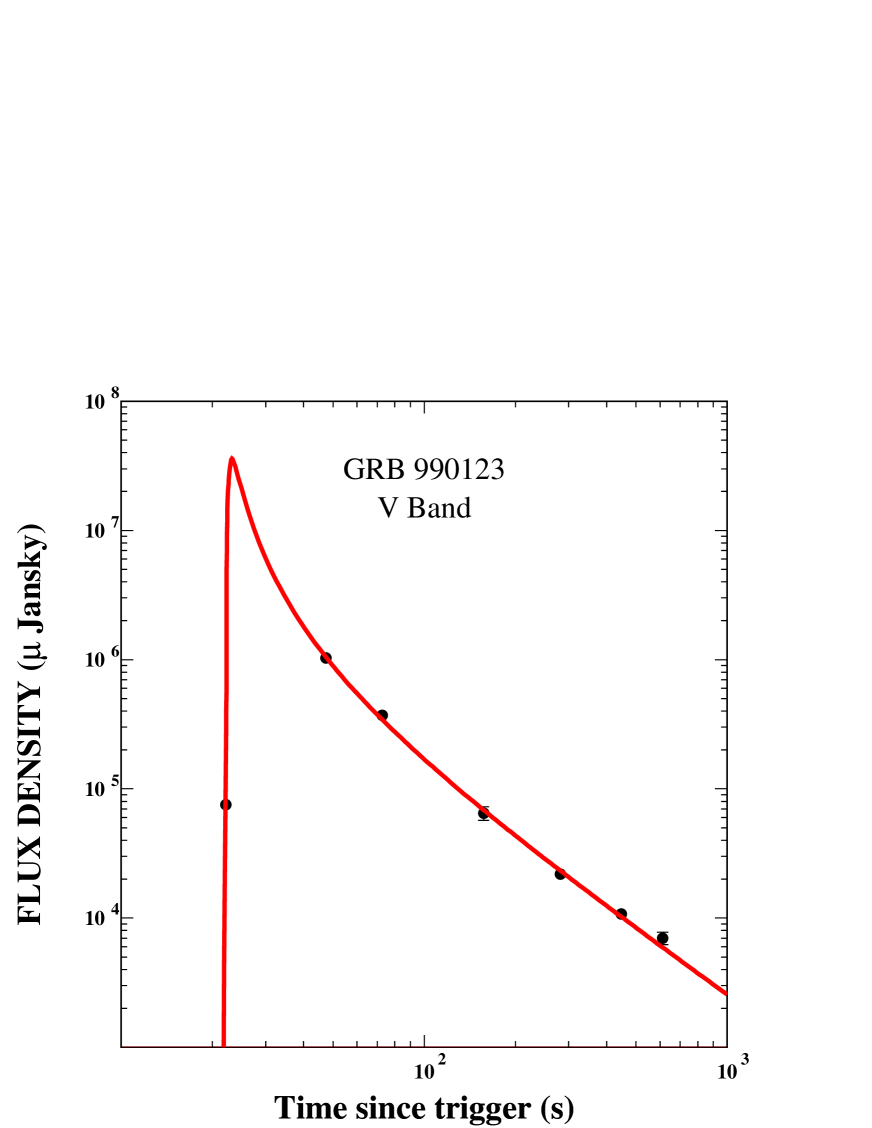
In Fig. 4 we compare the early time band lightcurve of GRB 990123 as measured by ROTSE (Akerlof et al. 1999) and the CB model expectation as given by Eq. (17) assuming a single CB and the best fit parameters, s, s, and Jy. The single CB approximation was used because of the lack of information on the short time behaviour of the optical lightcurve during the prompt emission phase. Fig. 4, however, demonstrates that the rapid decay of the lightcurve at the end of the prompt emission is well reproduced.
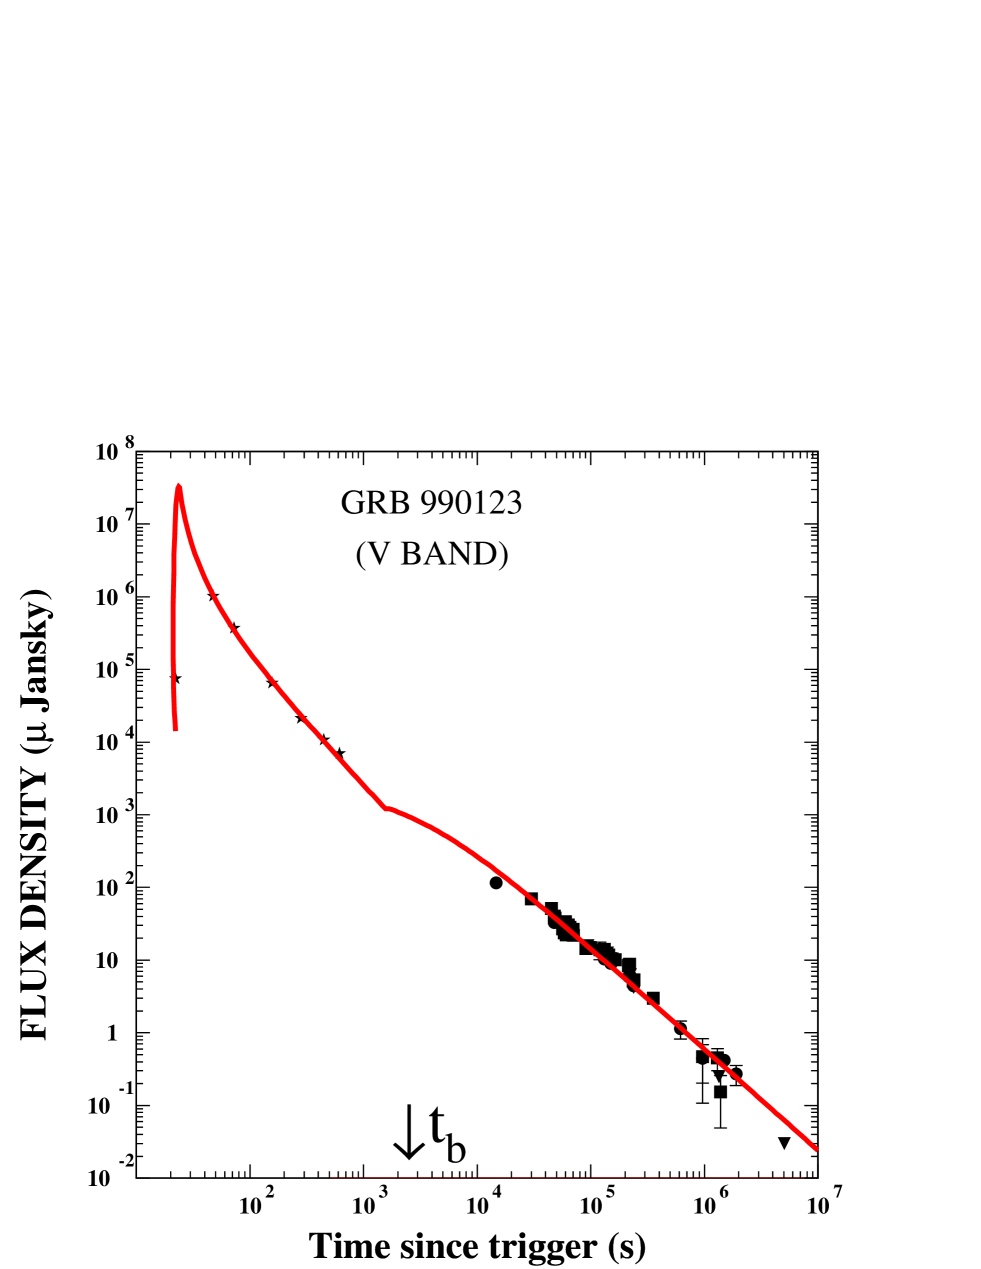
In Fig. 5 we compare the observations of the optical lightcurve of GRB 990123 from onset (Akerlof et al. 1999) until late time ( Castro-Tirado et al. 1999; Galama et al. 1999; Kulkarni et al. 1999a; Fruchter et al. 1999, 2000; Holland et al. 2000 and references therein), normalized to the -band, and its CB model description as given by Eq. (15) with the afterglow parameters , s and Due to a gap in the data between 500 s and 15,000 s, the expected transition from a circumstellar density profile to a constant ISM density was not well determined, However, the gradual bending (‘jet break’) of the optical AG to an asymptotic power-law decay, is well reproduced with the expected late-time spectral index
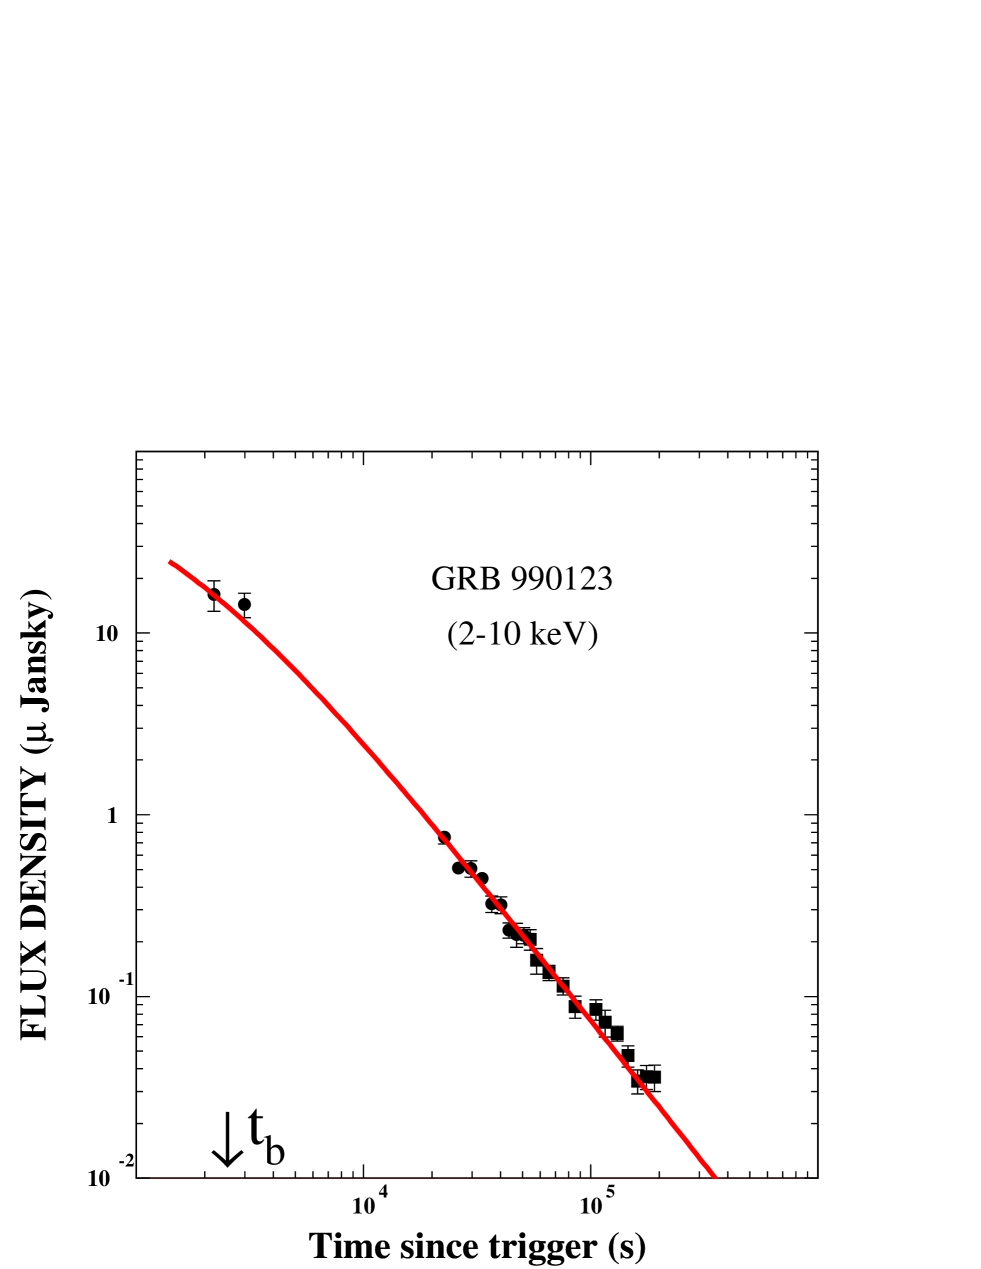
In Fig. 6 we compare the the lightcurve of the X-ray afterglow of GRB 990123 in the 2-10 keV band, which was measured with BeppoSAX (Maiorano et al. 2005) for days, and its CB model description. The best fit SR lightcurve required , implying , consistent with that was inferred by Maiorano et al. 2005 from their data. The observed temporal power-law decay index of the late-time X-ray afterglow, (Maiorano et al. 2005), obeys the CB model relation (Eq. (23)),
8.2 GRB 080319B
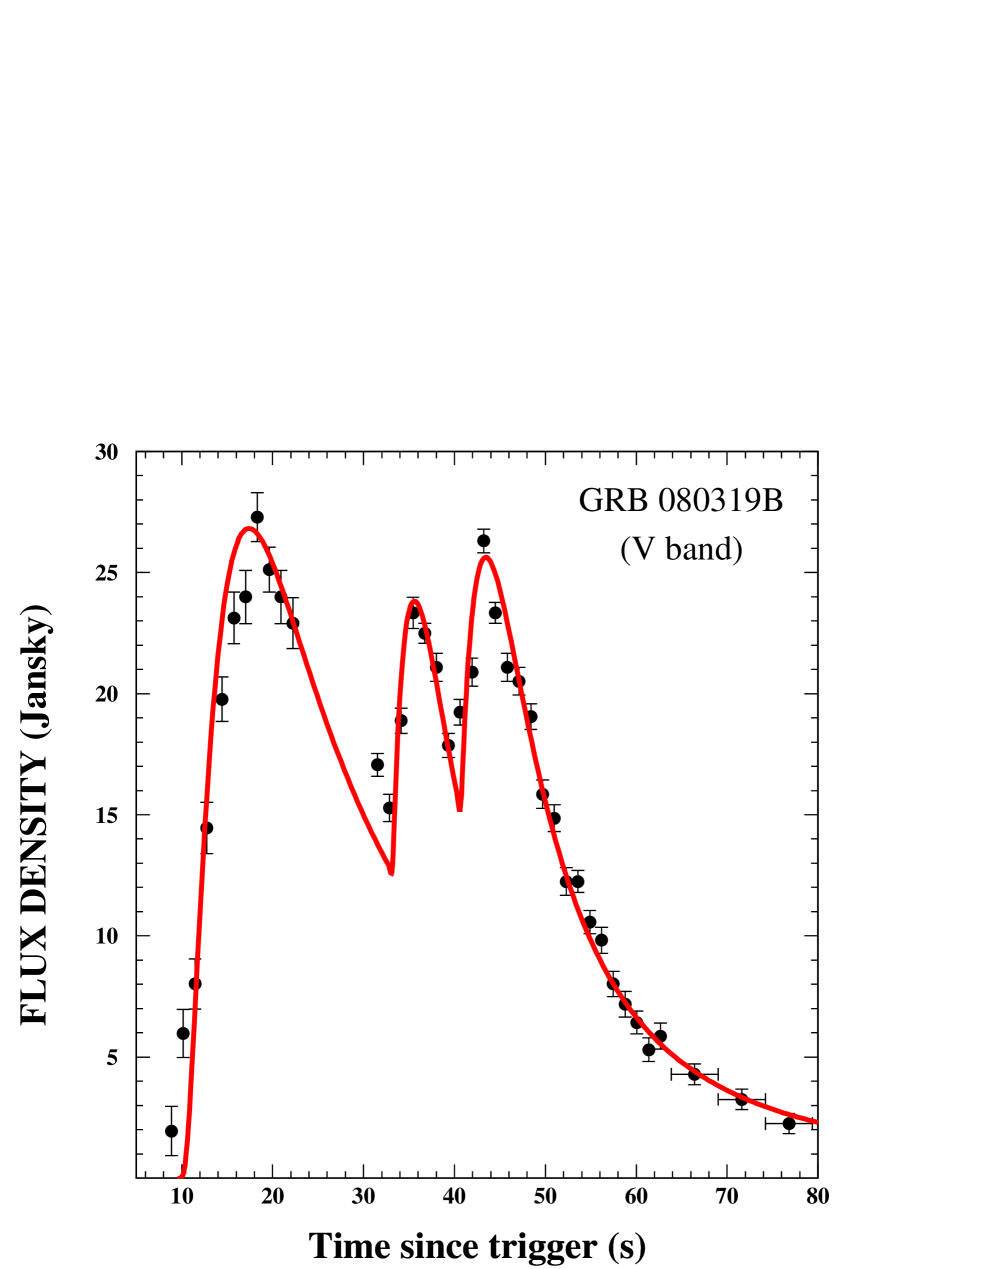
The prompt -ray and hard X-ray emission in GRB 080319B is composed of many narrow peaks (see Fig. 1 in Racusin et al. 2008), most of which are not well resolved, which makes the comparison between theory and observations for GRB 080319B less conclusive. The early-time optical lightcurve, was however much better sampled (Racusin et al. 2008; Wozniak et al. 2008) than that in GRB 990123, as shown in Fig. 7 where it is compared to its CB model description in terms of 3 SR peaks, each one described by Eq. (17) with the parameters listed in Table II. The decay of the prompt emission favours a single CB crossing 3 shells which were ejected by the progenitor star before the supernova explosion, rather than 3 CBs crossing a continuous pre-supernova blowing wind.
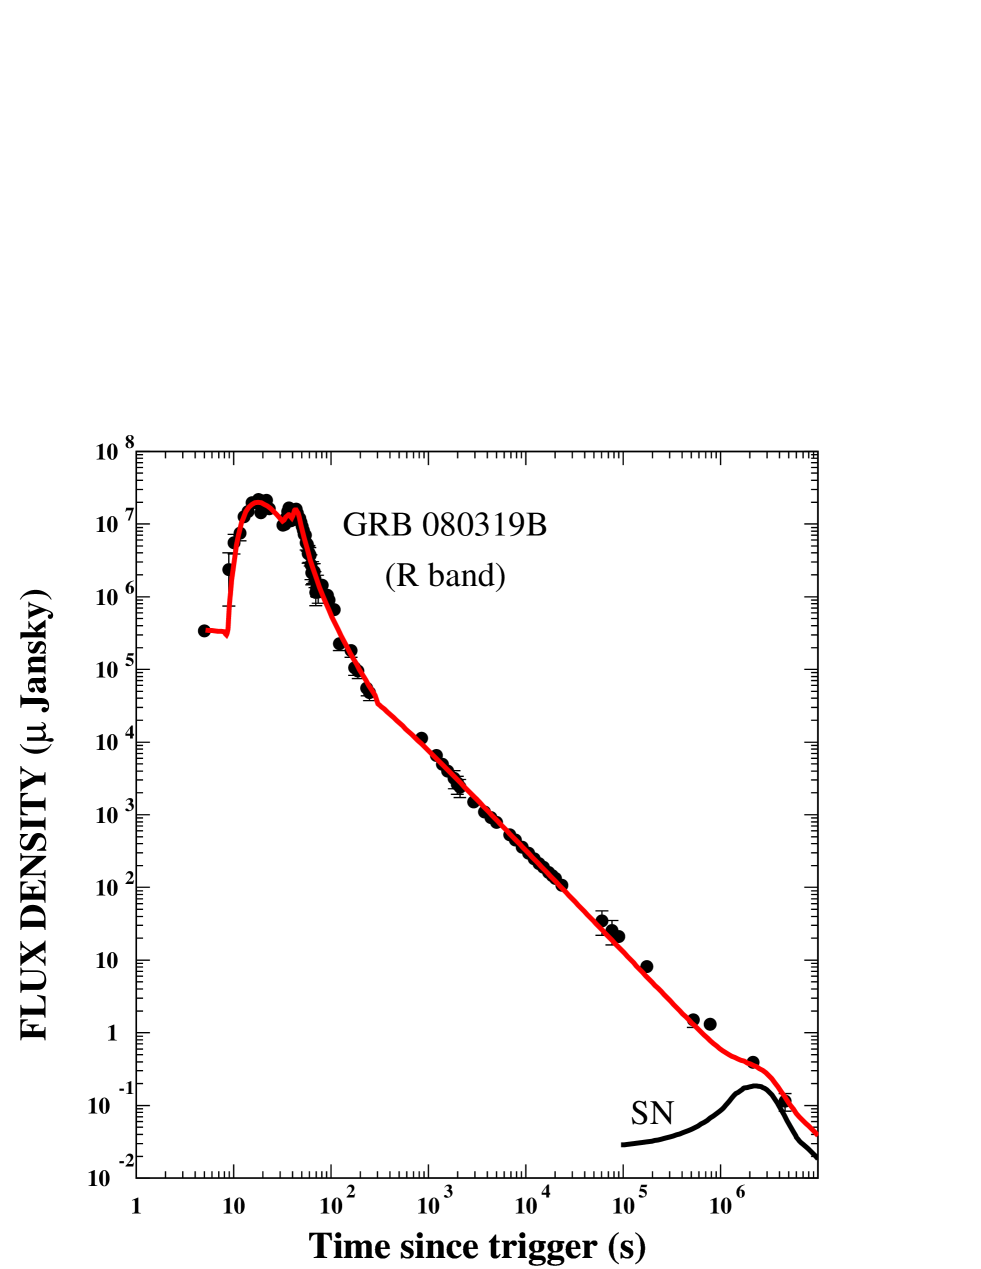
In Fig. 8 we compare the entire -band (and band renormalized to the band) lightcurve of GRB080319 (Racusin et al. 2008) and its CB model description assuming that the initially expanding 3 CBs merged into a single CB by the end of the prompt ICS emission of gamma-rays and hard X-rays around 300 s (observer time) which decelerates in roughly a constant density ISM. The afterglow parameters are listed in Table III. The ‘missing jet break’ is hidden under the prompt emission. Shown also is the contribution to the -band afterglow from an SN akin to SN1998bw (Galama et al. 1998) displaced to the GRB site.
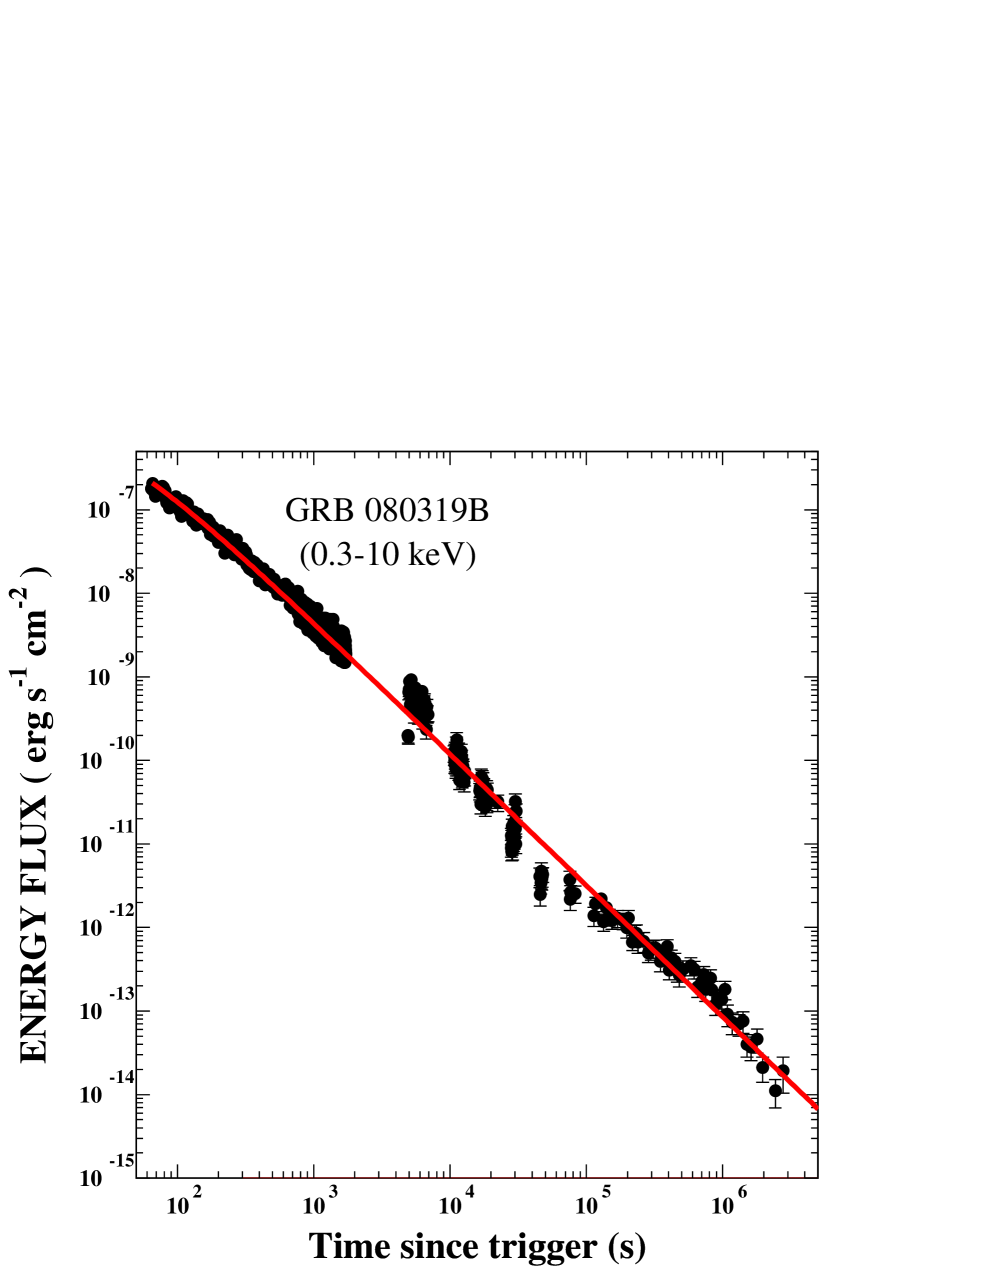
In Fig. 9 we compare the lightcurve of the 0.3-10 keV X-ray afterglow of GRB 080319B measured with the Swift XRT (Racusin et al. 2008) and its CB model description, assuming a constant ISM density. The best fit parameters are and s. The late time temporal decay of the X-ray AG is well described by a power-law with , except around 40,000 s, where the lightcurve is poorly sampled. As expected for GRBs with large measured , and (DDD2008b), no AG break was observed in the XRT lightcurve. The wiggling of the measured lightcurve around a power-law decay, is probably due to variations in the ISM density along the CB trajectory, which we have not tried to parametrize.
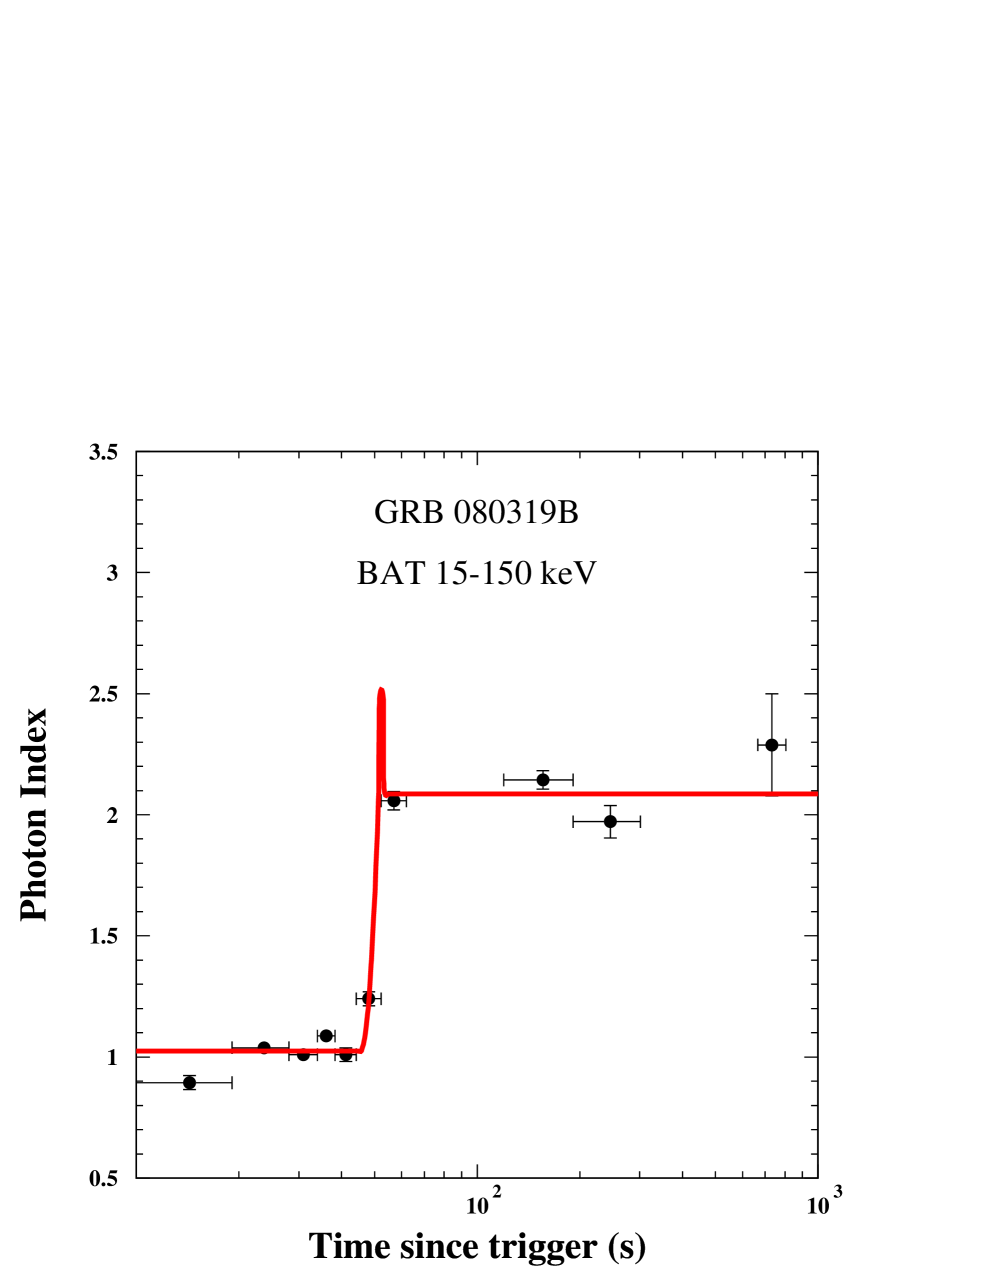
In Fig. 10 we compare the photon spectral index of the 15-150 keV light curve of GRB 080319B, which was inferred from observations with the Swift broad alert telescope (BAT) and reported in Fig. 2 of the supplementary material in Racusin et al. 2008, and that expected in the CB model (DDD2008a). As long as the prompt hard X-ray emission is dominated by overlapping ICS peaks, . It increases rapidly during the fast decay phase of the prompt emission (DDD2008a) until the synchrotron radiation dominates the emission and then (e.g. DDD2002). These predictions agree well with the observations as shown in Fig. 10.
9 Discussion
Accurate data that have been accumulated in recent years from space based and ground based observations have challenged the prevailing views on GRBs. This is true in particular for the brightest and best studied GRBs, 990123 (e.g., Maiorano et al. 2005; Corsi et al. 2005) and 080319B (Bloom et al. 2008; Racusin et al. 2008): Their prompt multiwavelength emission cannot be explained by a single radiation mechanism. Their hard X-ray and -ray emission cannot be explained as SR from internal shocks generated by collisions between conical shells. Their prompt optical emission is not correlated with their hard X-ray and -ray emission. Their afterglows are chromatic, and roughly decay like a single power-law without a jet break. Their spectral and temporal power-law indices do not satisfy the closure relations for conical blast waves.
To rescue the FB model, SR as the source of the hard X-ray and -ray emission was replaced by inverse Compton scattering of the self produced SR. In this so called ‘synchrotron self Compton’ (SSC) mechanism, the prompt SR is produced either by internal shocks (e.g., Kumar & Panaitescu 2008) or by relativistic magnetic turbulences without internal shocks (e.g. Kumar & Narayan 2008). The SSC mechanism implies that the SR emission begins before the X-ray and -ray emission, and both are correlated. But, contrary to these expectations, the observed prompt optical emission lags consideraby behind the hard X-ray and -ray emission and no temporal correlation is observed between the hard X-ray and -ray peaks and the prompt optical peaks. Moreover, the SSC model predicts a vanishing polarization of the prompt hard X-ray and -ray emission. The measured polarization, so far in 4 ordinary GRBs, suggests a large polarization (Cobb et al. 2004; Willis et al. 2005; Kalemci et al. 2007; McGlynn et al. 2007).
The situation concerning the FB model interpretation of the observed afterglow of GRBs 990123 and 080319B is similar. Although some aspects of the data have been explained by invoking structured jets, multiple blast waves propagating into the ISM, backward shocks and evolving microphysical parameters, no unique falsifiable predictions to test these suggestions were made and it is not clear whether the agreement between theory and some aspects of the data which was claimed is significant or results only from a flexible parametrization and sufficient adjustable parameters.
The situation concerning the CB model is entirely different. The predictions of the model were derived in fair approximations from its original underlying assumptions long ago. They were shown to predict correctly the main observed properties of GRBs and reproduce successfully the diverse broad band light curves of large representative sets of both long GRBs and XRFs (e.g., DD2004; DD2008a and references therein) and short hard bursts (DD2008b). In this paper, we have demonstrated these for GRBs 990123 and 080319B, the two brightest and so far the best studied gamma ray bursts, without invoking any new physics. They imply that GRBs 990123 and 080319B were ordinary, highly collimated GRBs produced in a core collapse supernova explosion within a high-density wind environment and observed from a very near-axis viewing angle. Massive wind/ejecta blown from the progenitor star before the supernova explosion probably created a matter-free bubble around the progenitor star which was filled with radiation. Inverse Compton scattering of this light by the jet of CBs produced the hard X-rays and -rays which preceded the broadband SR emission when the jet crossed the wind. As in all other GRBS, inverse Compton scattering and synchrotron radiation, the two dominant radiation mechanisms in the cannonball model of GRBs, together with the burst environment -wind blown into a constant density ISM- provide a very simple and sufficiently accurate description of the multiwavelength lightcurves of their prompt and afterglow emissions. The dependence of the bend/break frequency on density variations along the jet trajectory can explain the observed spectral variations but obviously cannot predict it. The predicted general trend at late time is well satisfiesd.
Two predictions which can be tested in future observations of extremely bright GRBs are as follows: Because of their small viewing angles, the polarization of the prompt X-rays and -rays in very bright GRBs, such as 990123 and 080319B, is predicted to be small (Shaviv & Dar 1995; DD2004), unlike that of ordinary GRBs with where it is predicted to be very large.
Collisions of the CBs with the dense wind and glory, which are needed to produce very luminous GRBs, are expected to produce also detectable fluxes of high energy photons (Dado & Dar 2005: Dado & Dar, in preparation): Electrons from the wind and/or ISM which are swept into, or scattered by, the CBs should produce sub-GeV photons by ICS of glory light. Hadronic collisions of the thermal nuclei in the CBs’ plasma with wind nuclei are expected to produce detectable fluxes of sub-TeV photons and marginal fluxes of neutrinos through production, while wind/ISM nuclei swept into or scattered by the CBs are expected to produce fluxes of sub-PeV photons which are detectable only from very nearby bursts because of the opacity of the infrared background to high energy photons. (Dar & De Rújula 2006).
Acknowledgment: We thank Elisabetta Maiorano for making available to us tabulated data of the BeppoSAX measurements of the X-ray light curves of GRB 990123.
10 Appendix I
With , the ICS spectral energy density satisfies,
| (26) |
and then,
| (27) |
has a maximum at .
References
- (1) Akerlof, C., et al. 1999, Nature, 398, 400
- Amati (2002) Amati, L., Frontera, F., Tavani, M., et al. 2002, A&A, 390, 81
- (3) Amati, L., 2006, MNRAS, 372, 233
- (4) Andersen, M. I., et al. 1999, Science, 283, 2075
- (5) Band, D., et al. 1993, ApJ, 413, 281
- (6) Bloom, J. S., et al. 2008, arXiv0803.3215
- (7) Briggs, M. S., et al. 1999, ApJ, 524, 82
- (8) Burrows, D. N. & Racusin, J. 2007, Nuov. Cim. 121B, 1273
- (9) Castro-Tirado, A. J., et al. 1999, Science, 283, 2069
- (10) Coburn, W. & Boggs, S. E. 2003, Nature, 423, 415
- (11) Corsi, A., et al. 2005, A&A, 438, 829
- (12) Covino, S., et al. 2006, Nuovo Cimento, 121B, 1171
- (13) Dado, S. & Dar, A. 2005, ApJ, 627, L109
- (14) Dado, S. & Dar, A. 2008a, arXiv:0809.4776 (DDD2008a)
- (15) Dado, S. & Dar, A. 2008b, ApJ, in press (arXiv:0807.1962)(DD2008b)
- (16) Dado, S., Dar, A. & De Rújula, A. 2002, A&A, 388, 1079 (DDD2002)
- (17) Dado, S., Dar, A. & De Rújula, A. 2003a, A&A, 401, 243 (DDD2003)
- (18) Dado, S., Dar, A. & De Rújula, A. 2006, ApJ, 646, L21 (DDD2006)
- (19) Dado, S., Dar, A. & De Rújula, A. 2007, ApJ, 663, 400 (DDD2007)
- (20) Dado, S., Dar, A. & De Rújula, A. 2008a, ApJ, 681, 1408 (DDD2008a)
- (21) Dado, S., Dar, A. & De Rújula, A. 2008b, ApJ, 680, 517 (DDD2008b)
- (22) Dai, X., et al. 2007, ApJ, 658, 509
- (23) Dai, X., et al. 2008, ApJ, 682, L77
- (24) Dar, A. 1998, ApJ, 500, L93
- (25) Dar, A. & Plaga, R. 1999, A&A, 349, 259
- (26) Dar, A. & De Rújula, A. 2000, arXiv:astro-ph/0012227
- (27) Dar, A. & De Rújula, A. 2004, Physics Reports, 405, 203 (DD2004)
- (28) Dar, A. & De Rújula, A. 2008, Physics Rep0rts 466, 179, 2008
- (29) De Rújula, A. 1987, Phys. Lett. 193, 514
- (30) Fruchter, A. S., et al. 1999, ApJ, 519, L13
- (31) Fruchter, A. S., et al. 2000, GCN Circ. 712
- (32) Galama, T. J., et al. 1999 Nature, 398, 394
- (33) Golenetskii, S., et al. 2008, GCN Circ. 7482
- (34) Holland, S., et al. 2000, A&A, 364, 467
- (35) Kalemci, E., et al., 2007, ApJS, 169, 75
- (36) Kulkarni, S. R., et al. 1999, Nature, 398, 389
- (37) Kumar, P., et al. 2007, MNRAS, 376, L57
- (38) Kumar, P. & Panaitescu, A. 2008, MNRAS, 391, L19
- (39) Liang, E. W., et al. 2008, ApJ, 675, L528
- (40) Maiorano, E., et al. 2005, A&A 438, 821
- (41) Mangano, V., et al. 2007, A&A, 470, 105
- (42) McGlynn, S., et al. 2007, A&A, 466, 895
- (43) Mészáros, P. 2002, ARA&A, 40, 137
- (44) Mészáros, P. 2006, Rept. Prog. Phys. 69, 2259
- (45) Mirabel, I.F. & Rodriguez, L.F. 1999, ARA&A, 37, 409.
- (46) Panaitescu, A. 2006, Nuov. Cim. 121B, 1099
- (47) Panaitescu, A., et al. 2006, MNRAS, 369, 2059
- (48) Piran, T. 1999, Physics Reports, 314, 575
- (49) Racusin, J. L., et al. 2008, Nature, 455, 183
- (50) Rodriguez, L.F. & Mirabel, I.F. 1998, New Astron. Rev. 42, 649.
- (51) Sato, G., et al. 2007, ApJ 657, 359
- (52) Schlegel, D. J., Finkbeiner, D. P., & Davis, M. 1998, ApJ, 500, 525
- (53) Shaviv, N. J. & Dar, A. 1995, ApJ, 447, 863
- (54) Wigger, C., et al. 2008, ApJ, 675, 553
- (55) Willis, D. R., et al. 2005, A&A, 439, 245
- (56) Wu, B. & Fenimore, E. 2000, ApJ, 535, L29
- (57) Wozniak, P. R., et al. 2008, arXiv0810.2481
- (58) Zhang, B. 2007, ChjAA, 7, 1
- (59) Zhang, B-B., Liang, E-W. & Zhang, B. 2007, ApJ, 666, 1002
| Peak | ||||
|---|---|---|---|---|
| 1 | -5.57 | 15.4 | 300 | |
| 2 | 19.42 | 4.28 | 1450 | |
| 3 | 29.88 | 0.87 | 500 | |
| 4 | 32.95 | 5.43 | 800 | |
| 5 | 43.67 | 4.99 | 500 | |
| 6 | 52.77 | 4.30 | 450 | |
| 7 | 61.09 | 4.10 | 450 | |
| 8 | 70.35 | 5.63 | 600 | |
| 9 | 85.50 | 1.86 | 200 |
| Peak | |||||
|---|---|---|---|---|---|
| 1 | 9.50 | 10.24 | 3755 | 3.52 | 0.70 |
| 2 | 32.37 | 5.83 | 878 | 3.52 | 0.70 |
| 3 | 39.54 | 6.96 | 1291 | 3.52 | 0.70 |
| GRB | ||||
|---|---|---|---|---|
| 990123 | 0.24 | 2250 | 1.79 | 0.67 |
| 080319B | 0.14 | 86 | 2.15 | 0.6 |