DESY 08-201
December 2008
Measurement of and production in deep inelastic scattering using a lifetime tag at HERA
Abstract
The production of and mesons has been measured with the ZEUS detector at HERA using an integrated luminosity of 133.6 pb-1. The measurements cover the kinematic range GeV2, , GeV and . Combinatorial background to the meson signals is reduced by using the ZEUS microvertex detector to reconstruct displaced secondary vertices. Production cross sections are compared with the predictions of next-to-leading-order QCD which is found to describe the data well. Measurements are extrapolated to the full kinematic phase space in order to obtain the open-charm contribution, , to the proton structure function, .
6.1
The ZEUS Collaboration
S. Chekanov,
M. Derrick,
S. Magill,
B. Musgrave,
D. Nicholass1,
J. Repond,
R. Yoshida
Argonne National Laboratory, Argonne, Illinois 60439-4815, USA n
M.C.K. Mattingly
Andrews University, Berrien Springs, Michigan 49104-0380, USA
P. Antonioli,
G. Bari,
L. Bellagamba,
D. Boscherini,
A. Bruni,
G. Bruni,
F. Cindolo,
M. Corradi,
G. Iacobucci,
A. Margotti,
R. Nania,
A. Polini
INFN Bologna, Bologna, Italy e
S. Antonelli,
M. Basile,
M. Bindi,
L. Cifarelli,
A. Contin,
S. De Pasquale2,
G. Sartorelli,
A. Zichichi
University and INFN Bologna, Bologna, Italy e
D. Bartsch,
I. Brock,
H. Hartmann,
E. Hilger,
H.-P. Jakob,
M. Jüngst,
A.E. Nuncio-Quiroz,
E. Paul,
U. Samson,
V. Schönberg,
R. Shehzadi,
M. Wlasenko
Physikalisches Institut der Universität Bonn,
Bonn, Germany b
N.H. Brook,
G.P. Heath,
J.D. Morris
H.H. Wills Physics Laboratory, University of Bristol,
Bristol, United Kingdom m
M. Kaur,
P. Kaur3,
I. Singh3
Panjab University, Department of Physics, Chandigarh, India
M. Capua,
S. Fazio,
A. Mastroberardino,
M. Schioppa,
G. Susinno,
E. Tassi
Calabria University,
Physics Department and INFN, Cosenza, Italy e
J.Y. Kim
Chonnam National University, Kwangju, South Korea
Z.A. Ibrahim,
F. Mohamad Idris,
B. Kamaluddin,
W.A.T. Wan Abdullah
Jabatan Fizik, Universiti Malaya, 50603 Kuala Lumpur, Malaysia r
Y. Ning,
Z. Ren,
F. Sciulli
Nevis Laboratories, Columbia University, Irvington on Hudson,
New York 10027 o
J. Chwastowski,
A. Eskreys,
J. Figiel,
A. Galas,
K. Olkiewicz,
B. Pawlik,
P. Stopa,
L. Zawiejski
The Henryk Niewodniczanski Institute of Nuclear Physics, Polish Academy of Sciences, Cracow,
Poland i
L. Adamczyk,
T. Bołd,
I. Grabowska-Bołd,
D. Kisielewska,
J. Łukasik4,
M. Przybycień,
L. Suszycki
Faculty of Physics and Applied Computer Science,
AGH-University of Science and Technology, Cracow, Poland p
A. Kotański5,
W. Słomiński6
Department of Physics, Jagellonian University, Cracow, Poland
O. Behnke,
U. Behrens,
C. Blohm,
A. Bonato,
K. Borras,
D. Bot,
R. Ciesielski,
N. Coppola,
S. Fang,
J. Fourletova7,
A. Geiser,
P. Göttlicher8,
J. Grebenyuk,
I. Gregor,
T. Haas,
W. Hain,
A. Hüttmann,
F. Januschek,
B. Kahle,
I.I. Katkov9,
U. Klein10,
U. Kötz,
H. Kowalski,
M. Lisovyi,
E. Lobodzinska,
B. Löhr,
R. Mankel11,
I.-A. Melzer-Pellmann,
S. Miglioranzi12,
A. Montanari,
T. Namsoo,
D. Notz11,
A. Parenti,
L. Rinaldi13,
P. Roloff,
I. Rubinsky,
U. Schneekloth,
A. Spiridonov14,
D. Szuba15,
J. Szuba16,
T. Theedt,
J. Ukleja17,
G. Wolf,
K. Wrona,
A.G. Yagües Molina,
C. Youngman,
W. Zeuner11
Deutsches Elektronen-Synchrotron DESY, Hamburg, Germany
V. Drugakov,
W. Lohmann, S. Schlenstedt
Deutsches Elektronen-Synchrotron DESY, Zeuthen, Germany
G. Barbagli,
E. Gallo
INFN Florence, Florence, Italy e
P. G. Pelfer
University and INFN Florence, Florence, Italy e
A. Bamberger,
D. Dobur,
F. Karstens,
N.N. Vlasov18
Fakultät für Physik der Universität Freiburg i.Br.,
Freiburg i.Br., Germany b
P.J. Bussey19,
A.T. Doyle,
W. Dunne,
M. Forrest,
M. Rosin,
D.H. Saxon,
I.O. Skillicorn
Department of Physics and Astronomy, University of Glasgow,
Glasgow, United Kingdom m
I. Gialas20,
K. Papageorgiu
Department of Engineering in Management and Finance, Univ. of
Aegean, Greece
U. Holm,
R. Klanner,
E. Lohrmann,
H. Perrey,
P. Schleper,
T. Schörner-Sadenius,
J. Sztuk,
H. Stadie,
M. Turcato
Hamburg University, Institute of Exp. Physics, Hamburg,
Germany b
C. Foudas,
C. Fry,
K.R. Long,
A.D. Tapper
Imperial College London, High Energy Nuclear Physics Group,
London, United Kingdom m
T. Matsumoto,
K. Nagano,
K. Tokushuku21,
S. Yamada,
Y. Yamazaki22
Institute of Particle and Nuclear Studies, KEK,
Tsukuba, Japan f
A.N. Barakbaev,
E.G. Boos,
N.S. Pokrovskiy,
B.O. Zhautykov
Institute of Physics and Technology of Ministry of Education and
Science of Kazakhstan, Almaty, Kazakhstan
V. Aushev23,
O. Bachynska,
M. Borodin,
I. Kadenko,
A. Kozulia,
V. Libov,
D. Lontkovskyi,
I. Makarenko,
Iu. Sorokin,
A. Verbytskyi,
O. Volynets
Institute for Nuclear Research, National Academy of Sciences, Kiev
and Kiev National University, Kiev, Ukraine
D. Son
Kyungpook National University, Center for High Energy Physics, Daegu,
South Korea g
J. de Favereau,
K. Piotrzkowski
Institut de Physique Nucléaire, Université Catholique de
Louvain, Louvain-la-Neuve, Belgium q
F. Barreiro,
C. Glasman,
M. Jimenez,
L. Labarga,
J. del Peso,
E. Ron,
M. Soares,
J. Terrón,
C. Uribe-Estrada,
M. Zambrana
Departamento de Física Teórica, Universidad Autónoma
de Madrid, Madrid, Spain l
F. Corriveau,
C. Liu,
J. Schwartz,
R. Walsh,
C. Zhou
Department of Physics, McGill University,
Montréal, Québec, Canada H3A 2T8 a
T. Tsurugai
Meiji Gakuin University, Faculty of General Education,
Yokohama, Japan f
A. Antonov,
B.A. Dolgoshein,
D. Gladkov,
V. Sosnovtsev,
A. Stifutkin,
S. Suchkov
Moscow Engineering Physics Institute, Moscow, Russia j
R.K. Dementiev,
P.F. Ermolov †,
L.K. Gladilin,
Yu.A. Golubkov,
L.A. Khein,
I.A. Korzhavina,
V.A. Kuzmin,
B.B. Levchenko24,
O.Yu. Lukina,
A.S. Proskuryakov,
L.M. Shcheglova,
D.S. Zotkin
Moscow State University, Institute of Nuclear Physics,
Moscow, Russia k
I. Abt,
A. Caldwell,
D. Kollar,
B. Reisert,
W.B. Schmidke
Max-Planck-Institut für Physik, München, Germany
G. Grigorescu,
A. Keramidas,
E. Koffeman,
P. Kooijman,
A. Pellegrino,
H. Tiecke,
M. Vázquez12,
L. Wiggers
NIKHEF and University of Amsterdam, Amsterdam, Netherlands h
N. Brümmer,
B. Bylsma,
L.S. Durkin,
A. Lee,
T.Y. Ling
Physics Department, Ohio State University,
Columbus, Ohio 43210 n
P.D. Allfrey,
M.A. Bell, A.M. Cooper-Sarkar,
R.C.E. Devenish,
J. Ferrando,
B. Foster,
C. Gwenlan25,
K. Horton26,
K. Oliver,
A. Robertson,
R. Walczak
Department of Physics, University of Oxford,
Oxford United Kingdom m
A. Bertolin, F. Dal Corso,
S. Dusini,
A. Longhin,
L. Stanco
INFN Padova, Padova, Italy e
P. Bellan,
R. Brugnera,
R. Carlin,
A. Garfagnini,
S. Limentani
Dipartimento di Fisica dell’ Università and INFN,
Padova, Italy e
B.Y. Oh,
A. Raval,
J.J. Whitmore27
Department of Physics, Pennsylvania State University,
University Park, Pennsylvania 16802 o
Y. Iga
Polytechnic University, Sagamihara, Japan f
G. D’Agostini,
G. Marini,
A. Nigro
Dipartimento di Fisica, Università ’La Sapienza’ and INFN,
Rome, Italy
J.E. Cole28,
J.C. Hart
Rutherford Appleton Laboratory, Chilton, Didcot, Oxon,
United Kingdom m
H. Abramowicz29,
R. Ingbir,
S. Kananov,
A. Levy,
A. Stern
Raymond and Beverly Sackler Faculty of Exact Sciences,
School of Physics, Tel Aviv University, Tel Aviv, Israel d
M. Kuze,
J. Maeda
Department of Physics, Tokyo Institute of Technology,
Tokyo, Japan f
R. Hori,
S. Kagawa30,
N. Okazaki,
S. Shimizu,
T. Tawara
Department of Physics, University of Tokyo,
Tokyo, Japan f
R. Hamatsu,
H. Kaji31,
S. Kitamura32,
O. Ota33,
Y.D. Ri
Tokyo Metropolitan University, Department of Physics,
Tokyo, Japan f
M. Costa,
M.I. Ferrero,
V. Monaco,
R. Sacchi,
V. Sola,
A. Solano
Università di Torino and INFN, Torino, Italy e
M. Arneodo,
M. Ruspa
Università del Piemonte Orientale, Novara, and INFN, Torino,
Italy e
S. Fourletov7,
J.F. Martin,
T.P. Stewart
Department of Physics, University of Toronto, Toronto, Ontario,
Canada M5S 1A7 a
S.K. Boutle20,
J.M. Butterworth,
T.W. Jones,
J.H. Loizides,
M.R. Sutton34,
M. Wing35
Physics and Astronomy Department, University College London,
London, United Kingdom m
B. Brzozowska,
J. Ciborowski36,
G. Grzelak,
P. Kulinski,
P. Łużniak37,
J. Malka37,
R.J. Nowak,
J.M. Pawlak,
W. Perlanski37,
T. Tymieniecka38,
A.F. Żarnecki
Warsaw University, Institute of Experimental Physics,
Warsaw, Poland
M. Adamus,
P. Plucinski39,
A. Ukleja
Institute for Nuclear Studies, Warsaw, Poland
Y. Eisenberg,
D. Hochman,
U. Karshon
Department of Particle Physics, Weizmann Institute, Rehovot,
Israel c
E. Brownson,
D.D. Reeder,
A.A. Savin,
W.H. Smith,
H. Wolfe
Department of Physics, University of Wisconsin, Madison,
Wisconsin 53706, USA n
S. Bhadra,
C.D. Catterall,
Y. Cui,
G. Hartner,
S. Menary,
U. Noor,
J. Standage,
J. Whyte
Department of Physics, York University, Ontario, Canada M3J
1P3 a
1 also affiliated with University College London,
United Kingdom
2 now at University of Salerno, Italy
3 also working at Max Planck Institute, Munich, Germany
4 now at Institute of Aviation, Warsaw, Poland
5 supported by the research grant no. 1 P03B 04529 (2005-2008)
6 This work was supported in part by the Marie Curie Actions Transfer of Knowledge
project COCOS (contract MTKD-CT-2004-517186)
7 now at University of Bonn, Germany
8 now at DESY group FEB, Hamburg, Germany
9 also at Moscow State University, Russia
10 now at University of Liverpool, UK
11 on leave of absence at CERN, Geneva, Switzerland
12 now at CERN, Geneva, Switzerland
13 now at Bologna University, Bologna, Italy
14 also at Institut of Theoretical and Experimental
Physics, Moscow, Russia
15 also at INP, Cracow, Poland
16 also at FPACS, AGH-UST, Cracow, Poland
17 partially supported by Warsaw University, Poland
18 partly supported by Moscow State University, Russia
19 Royal Society of Edinburgh, Scottish Executive Support Research Fellow
20 also affiliated with DESY, Germany
21 also at University of Tokyo, Japan
22 now at Kobe University, Japan
23 supported by DESY, Germany
24 partly supported by Russian Foundation for Basic
Research grant no. 05-02-39028-NSFC-a
25 STFC Advanced Fellow
26 nee Korcsak-Gorzo
27 This material was based on work supported by the
National Science Foundation, while working at the Foundation.
28 now at University of Kansas, Lawrence, USA
29 also at Max Planck Institute, Munich, Germany, Alexander von Humboldt
Research Award
30 now at KEK, Tsukuba, Japan
31 now at Nagoya University, Japan
32 member of Department of Radiological Science,
Tokyo Metropolitan University, Japan
33 now at SunMelx Co. Ltd., Tokyo, Japan
34 now at the University of Sheffield, Sheffield, UK
35 also at Hamburg University, Inst. of Exp. Physics,
Alexander von Humboldt Research Award and partially supported by DESY, Hamburg, Germany
36 also at Łódź University, Poland
37 member of Łódź University, Poland
38 also at University of Podlasie, Siedlce, Poland
39 now at Lund Universtiy, Lund, Sweden
† deceased
a
supported by the Natural Sciences and Engineering Research Council of Canada (NSERC)
b
supported by the German Federal Ministry for Education and Research (BMBF), under
contract numbers 05 HZ6PDA, 05 HZ6GUA, 05 HZ6VFA and 05 HZ4KHA
c
supported in part by the MINERVA Gesellschaft für Forschung GmbH, the Israel Science
Foundation (grant no. 293/02-11.2) and the U.S.-Israel Binational Science Foundation
d
supported by the Israel Science Foundation
e
supported by the Italian National Institute for Nuclear Physics (INFN)
f
supported by the Japanese Ministry of Education, Culture, Sports, Science and Technology
(MEXT) and its grants for Scientific Research
g
supported by the Korean Ministry of Education and Korea Science and Engineering
Foundation
h
supported by the Netherlands Foundation for Research on Matter (FOM)
i
supported by the Polish State Committee for Scientific Research, project no.
DESY/256/2006 - 154/DES/2006/03
j
partially supported by the German Federal Ministry for Education and Research (BMBF)
k
supported by RF Presidential grant N 1456.2008.2 for the leading
scientific schools and by the Russian Ministry of Education and Science through its
grant for Scientific Research on High Energy Physics
l
supported by the Spanish Ministry of Education and Science through funds provided by
CICYT
m
supported by the Science and Technology Facilities Council, UK
n
supported by the US Department of Energy
o
supported by the US National Science Foundation. Any opinion,
findings and conclusions or recommendations expressed in this material
are those of the authors and do not necessarily reflect the views of the
National Science Foundation.
p
supported by the Polish Ministry of Science and Higher Education
as a scientific project (2006-2008)
q
supported by FNRS and its associated funds (IISN and FRIA) and by an Inter-University
Attraction Poles Programme subsidised by the Belgian Federal Science Policy Office
r
supported by an FRGS grant from the Malaysian government
1 Introduction
Charm quarks are copiously produced in deep inelastic scattering (DIS) at HERA. At sufficiently high photon virtuality, , the production of charm quarks constitutes up to of the cross section [1, 2]. Previous measurements of cross sections [1, 2, 3, 4, 5] indicate that the production of charm quarks in DIS in the range GeV2 is consistent with the calculations of perturbative Quantum Chromodynamics (pQCD) in which charm is predominantly produced via boson-gluon fusion (BGF). This implies that the charm cross section is directly sensitive to the gluon density in the proton.
A charm quark in the final state can be identified by the presence of a corresponding charmed hadron. In this paper a study of the production of two such charmed particles, the and mesons, is presented. The mesons are reconstructed using the decays and , which are chosen as both contain charged particles111The charge-conjugated modes are implied throughout this paper. which are well reconstructed in the ZEUS detector. The proper decay lengths are of the order 300 m and 100 m for the and , respectively and can be measured[6, 7] with appropriate silicon trackers such as those at H1 and ZEUS.
Measurements of the and cross sections are presented with improved precision and in a kinematic region extending to lower transverse momentum, , than the previous ZEUS results[8]; this is made possible through the use of the precision tracking provided by the ZEUS microvertex detector (MVD). Single-differential cross sections have been measured as a function of , the Bjorken scaling variable, , , and the pseudorapidity, , of the mesons. The cross sections are compared to the predictions of a next-to-leading-order (NLO) QCD calculation using parameterisations of the parton densities in the proton which were determined from fits to inclusive DIS measurements from ZEUS and fixed-target experiments. The cross-section measurements are used to extract the open-charm contribution, , to the proton structure function, .
2 Experimental set-up
The analysis was performed with data taken from 2004 to 2005 when HERA collided electrons with energy with protons of energy . The results are based on an sample corresponding to an integrated luminosity of 133.6 3.5 pb-1.
A detailed description of the ZEUS detector can be found elsewhere [9]. A brief outline of the components that are most relevant for this analysis is given below.
In the kinematic range of the analysis, charged particles were tracked in the central tracking detector (CTD) [10, *npps:b32:181, *nim:a338:254] and the MVD [13]. These components operated in a magnetic field of 1.43 T provided by a thin superconducting solenoid. The CTD consisted of 72 cylindrical drift chamber layers, organised in nine superlayers covering the polar-angle222The ZEUS coordinate system is a right-handed Cartesian system, with the axis pointing in the proton beam direction, referred to as the “forward direction”, and the axis pointing left towards the centre of HERA. The coordinate origin is at the nominal interaction point. region .
The MVD consisted of a barrel (BMVD) and a forward (FMVD) section with three cylindrical layers and four planar layers of single-sided silicon strip sensors in the BMVD and FMVD respectively. The BMVD provided polar-angle coverage for tracks with three measurements from to . The FMVD extended the polar-angle coverage in the forward region to . After alignment, the single-hit resolution of the BMVD was m and the impact-parameter resolution of the CTD-BMVD system for high-momentum tracks was m.
The high-resolution uranium–scintillator calorimeter (CAL) [14, *nim:a309:101, *nim:a321:356, *nim:a336:23] consisted of three parts: the forward (FCAL), the barrel (BCAL) and the rear (RCAL) calorimeters. Each part was subdivided transversely into towers and longitudinally into one electromagnetic section (EMC) and either one (in RCAL) or two (BCAL and FCAL) hadronic sections (HAC). The smallest subdivision of the calorimeter was called a cell. The CAL energy resolutions, as measured under test-beam conditions, were for electrons and for hadrons, with in GeV.
3 Event selection and reconstruction
A three-level trigger system was used to select events online [9, 24, 25]. At the third level, events with a reconstructed scattered-electron or -meson candidate were kept for further analysis.
The kinematic variables , and the fraction of the electron energy transferred to the proton in its rest frame, , were reconstructed using the double angle (DA) method [26] which relies on the angles of the scattered electron and the hadronic energy flow.
The events were selected offline with the following cuts:
-
•
10 GeV, where is the energy of the scattered electron;
-
•
, where is determined from the energy and angle of the scattered electron. This condition removes events where fake electrons are found in the FCAL;
-
•
, where JB signifies the Jacquet-Blondel [27] method of kinematic reconstruction. This condition rejects events where the hadronic system cannot be measured precisely;
-
•
, where and is the energy of the energy-flow object (EFO) [28] reconstructed from tracks detected in the CTD and MVD and energy clusters measured in the CAL. The sum runs over all EFOs;
-
•
, where is the primary vertex position determined from tracks;
-
•
the impact point (), of the scattered electron on the surface of the RCAL must lie outside the region (15 cm, 15 cm) centred on (0,0).
Electron candidates in the transition regions between FCAL and BCAL as well as between BCAL and RCAL were rejected because of the poor energy reconstruction in these areas. The angle of the scattered electron was determined using either its impact position on the CAL inner face or a reconstructed track. When available, SRTD and HES were also used. The energy of the scattered electron was corrected for non-uniformity due to geometric effects caused by cell and module boundaries.
The selected kinematic region was and . The production of and mesons was measured in the range of transverse momentum and pseudorapidity .
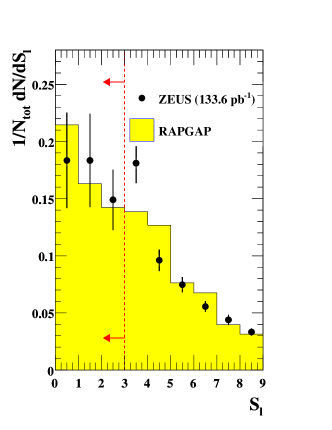
The decay-length significance is a powerful variable for the rejection of combinatorial background and is defined as , where is the decay length in the transverse plane and is the uncertainty associated with this distance. The decay length is the distance in the transverse plane between the point of creation and decay vertex of the meson and is given by
| (1) |
where is the transverse momentum vector and is the two dimensional position vector of the reconstructed decay vertex projected onto the plane. The vector points to the fitted geometrical centre of the beam-spot which is taken as the origin of the meson. The centre of the elliptical beam-spot was determined every 2000 well measured events [29] by fitting a Gaussian curve to the and distributions of the primary vertex. The mean of these fitted curves was then taken to be the beam-spot position. The widths of the beam-spot were 80 m and 20 m in the and directions, respectively. The decay-length error, , was determined by folding the width of the beam-spot with the covariance matrix of the decay vertex after both were projected onto the meson momentum vector.
3.1 -meson reconstruction
The (and ) mesons were reconstructed in the decay channel . In each event, all track pairs with equal charges were combined with a third track with opposite charge to form a candidate. The pion mass was assigned to the tracks with equal charges and the kaon mass was assigned to the remaining track. These were then associated and refitted to a common decay vertex [30] and the invariant mass, , was calculated. The tracks were required to have transverse momentum GeV and GeV for the pion and kaon tracks, respectively. To ensure that all tracks used were well reconstructed they were required to have passed through 3 superlayers of the CTD and have at least 2 BMVD measurements in the plane and 2 in the direction.
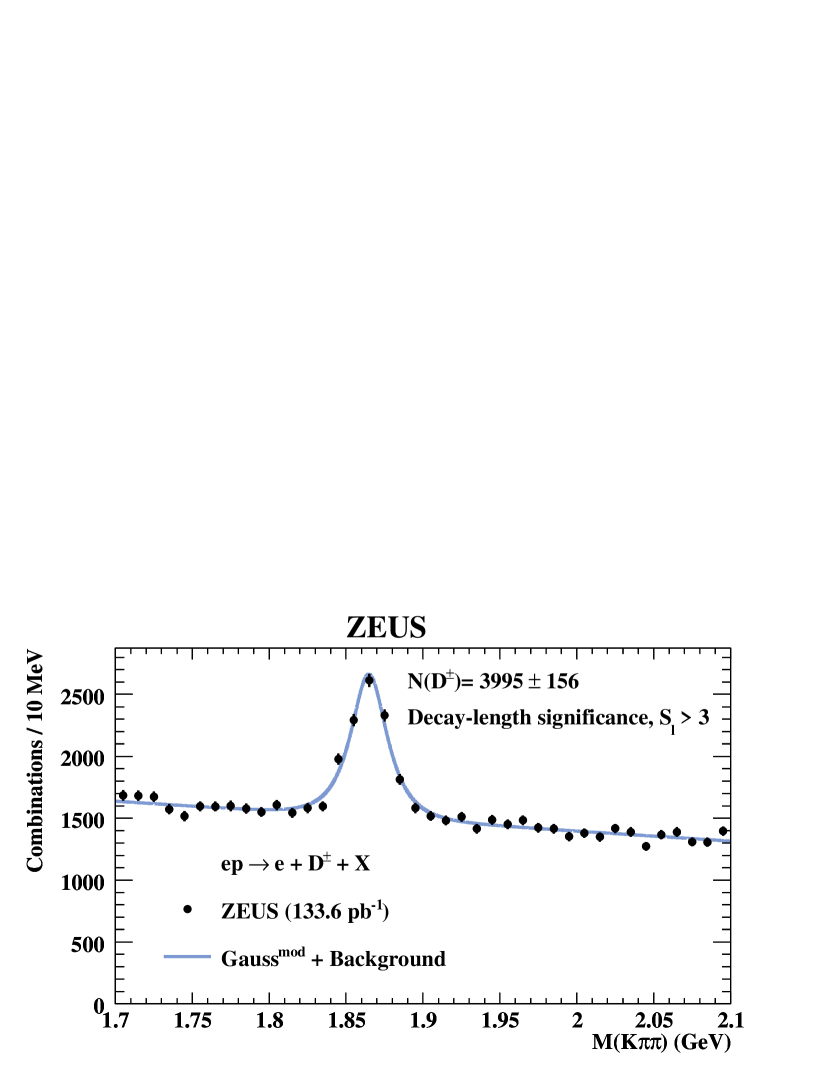
Figure 1 shows the distribution for candidates. The combinatorial background was reduced by the requirements that the of the decay vertex be less than 9 for 3 degrees of freedom and that the decay-length significance, , be greater than 3 (see Fig. 4). In order to extract the number of reconstructed mesons the distribution was fitted with the sum of a modified Gaussian function [31] and a linear background function. The modified Gaussian function used was
| (2) |
where . This functional form described both the data and MC well. The signal position, , and the width, , as well as the numbers of mesons in each signal were free parameters of the fit. The number of reconstructed mesons yielded by the fit was .
A sample of candidates with GeV, GeV and 3 GeV was used to obtain the lifetime of the meson. The higher cuts were used to obtain a signal with no requirements made on the significance of the decay length. The number of reconstructed mesons yielded by the fit to the data was .
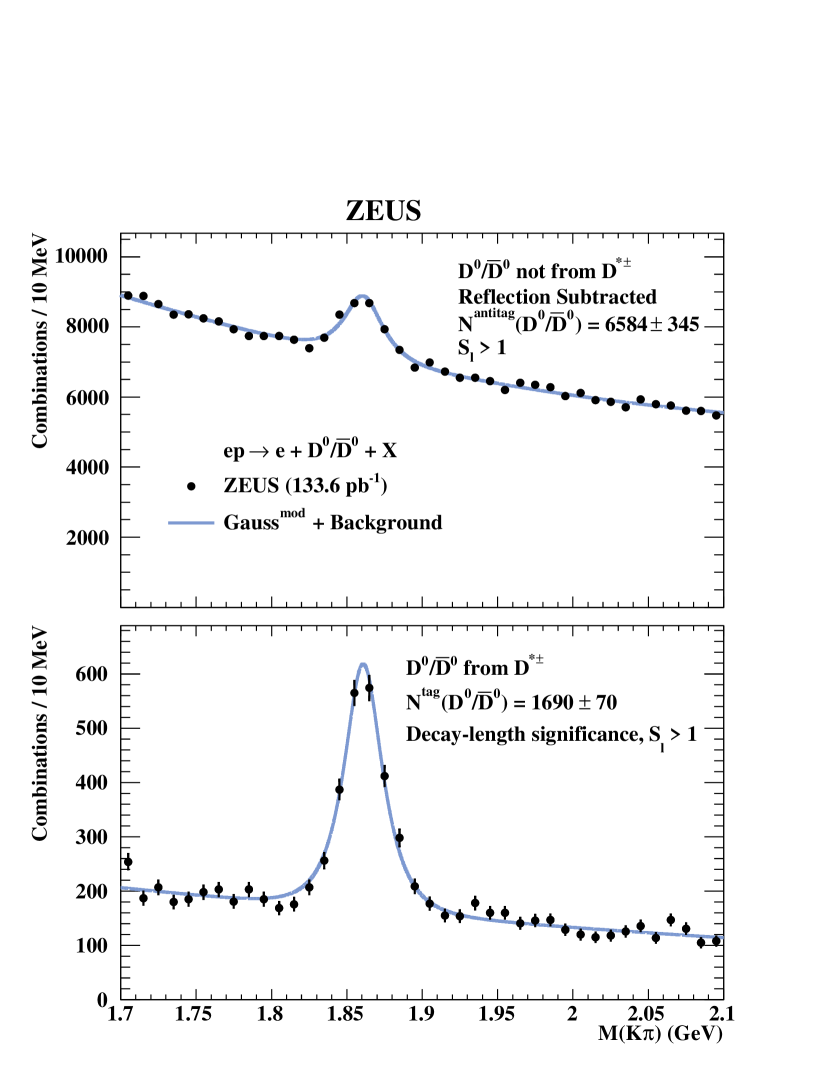
The (and ) mesons were reconstructed in the decay channel , with candidates found in a similar manner to the , except that only oppositely charged pairs of tracks were combined together to form the meson candidate. The tracks were required to have transverse momentum GeV and GeV for the kaon and pion tracks. The and cuts were 8 and 1, respectively, with 1 degree of freedom in the vertex fit (see Fig. 4). After selection, the candidates were separated into tagged and antitagged samples with the antitagged sample used for cross-section measurements.
The tagged group consisted of candidates which are consistent with a decay when combined with a third track that could be a “soft” pion, (). The soft pion was required to have GeV and charge opposite to that of the kaon. The tagged sample was used for the correction of the MC and reflection subtraction in the antitagged sample. For the antitagged sample, containing mesons not coming from a , incorrect assignment of the pion and kaon masses produced a wider reflected signal. The distribution of this reflection was estimated using the tagged candidates and, after normalising it to the ratio of the number of mesons in the two samples, it was subtracted from the antitagged candidates. Figure 2 shows the distributions for tagged and antitagged candidates. The distributions were fitted simultaneously assuming that both have the same peak position and width and, like the , were parameterised as a modified Gaussian function. The number of antitagged (tagged) mesons yielded by the fit was .
A sample of candidates with GeV and GeV was used to obtain the lifetime of the meson. The higher cuts were used to obtain a signal with no requirements made on the significance of the decay length. The number of antitagged (tagged) mesons yielded by the fit was .
3.2 -meson lifetimes
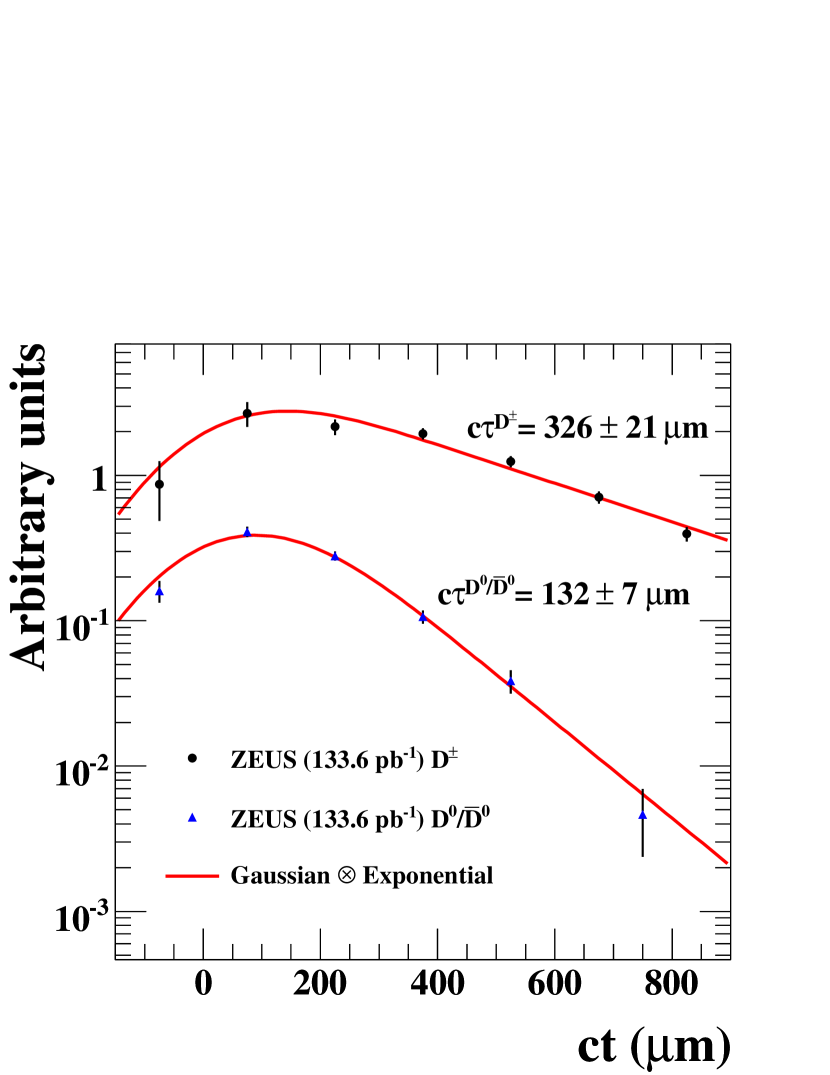
Lifetimes for the and mesons were calculated using decay lengths in the transverse plane and reconstructed -meson signals in the kinematic region , , and . Unfolding is not necessary as the detector acceptance is uniform with respect to the displacement of the secondary vertex and the normalisation of the lifetime distribution is irrelevant. The number of mesons in a given bin of proper decay length, , was extracted and the distributions fitted with the function
| (3) |
where , is the lifetime and is the spatial resolution. This function represents an exponential decay convoluted with a Gaussian resolution. For the purposes of the lifetime extraction, was set to the value extracted from the tagged sample, 120 m, which depended only weakly on .
The fitted distributions for and mesons are shown in Fig. 3 and the extracted values for the lifetime are:
The systematic uncertainties are significantly smaller than the statistical uncertainty as the measurement has only a small dependence on the details of the MC simulation. The values are consistent with the world average values of 311.8 2.1 m and 122.9 0.5 m [32] for the and , respectively.
4 Monte Carlo models
The acceptances were calculated using the Rapgap 3.00 [33] Monte Carlo (MC) model, which was interfaced with Heracles 4.6.1 [34] in order to incorporate first-order electroweak corrections. The generated events were then passed through a full simulation of the detector using Geant 3.21 [35] before being processed and selected with the same software as used for the data.
The MC was used to simulate events containing charm produced by the BGF process. The Rapgap generator used leading-order matrix elements with leading-logarithmic parton-shower radiation. The CTEQ5L [36] PDF for the proton was used, and the charm quark mass was set to 1.5 GeV. Charm fragmentation was implemented using the Lund string model [37]. mesons originating from decays were accounted for by inclusion of a Rapgap -quark sample where the -quark mass was set to 4.75 GeV.
A weighting procedure utilising the tagged sample was applied in order to correct for imperfections in the MC description of the decay-length uncertainty [29].
5 NLO QCD calculations
The NLO QCD predictions for the cross sections were obtained using the HVQDIS program [38] based on the fixed-flavour-number scheme (FFNS). In this scheme, only light partons ( and ) are included in the initial-state proton as partons whose distributions obey the DGLAP equations [39, *sovjnp:20:94, *np:b126:298, *jetp:46:641] and the pair is produced via the BGF mechanism with NLO corrections [43, *pl:b353:535, *np:b392:162, *np:b392:229]. The presence of different large scales, , and the mass of the quark, , can spoil the convergence of the perturbative series because the neglected terms of orders higher than (where is the strong coupling constant) contain log factors which can become large.
The predictions for -meson production at NLO were obtained using HVQDIS with the following inputs. The ZEUS-S NLO QCD global fit [47] to structure function data was used as the parameterisation of the proton PDFs. This fit was repeated [48] in the FFNS, in which the PDF has three active quark flavours in the proton. In this fit was set to 0.363 GeV and the mass of the charm quark was set to 1.5 GeV; the same mass was therefore used in the HVQDIS calculation. The renormalisation and factorisation scale, , was set to . The charm fragmentation to the particular meson was described by the Peterson function [49] with the Peterson parameter, , set to 0.035 [50]. The values used for the hadronisation fractions, , were those previously measured in DIS at ZEUS, 0.216 and 0.450 for the and antitagged , respectively [8].
To estimate the contribution of beauty production, the HVQDIS calculation and hadronisation from the MC were combined, using where . The ZEUS NLO QCD fit was used as the proton PDF, so that the mass used in this fit was also used in the HVQDIS program. The hadronisation fraction, , was set to 0.231 and 0.596 for the and , respectively [51].
The HVQDIS predictions for -meson production are affected by theoretical uncertainties listed below. The average uncertainty on the total cross sections is given in parentheses:
-
•
the ZEUS PDF uncertainties propagated from the experimental uncertainties of the fitted data (). The change in the cross section was independent of the kinematic region;
-
•
the mass of the charm quark (). The charm quark mass was changed consistently in the PDF fit and in HVQDIS by ;
-
•
the renormalisation and factorisation scale, (). The scales and were used;
-
•
the parameter of the Peterson fragmentation function () was varied by [52].
6 Data correction and systematic uncertainties
For a given observable , the production cross section was determined using:
| (4) |
where is the number of reconstructed mesons in a bin of size , is the reconstruction acceptance as found from the MC sample which includes migrations, efficiencies and QED radiative effects for that bin, is the integrated luminosity and is the branching ratio for the decay channel used in the reconstruction.
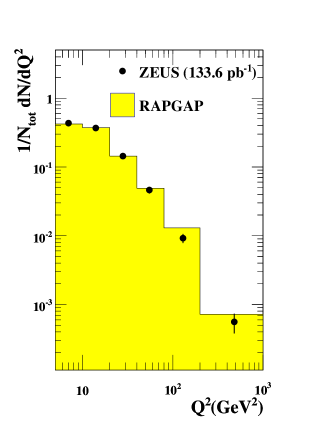
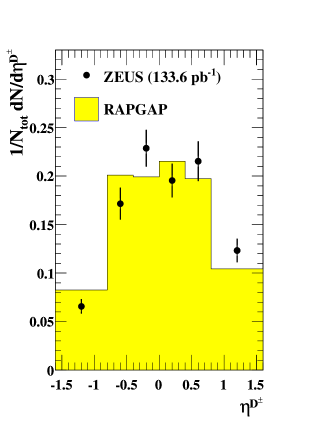
Small admixtures to the reconstructed signals from other decay modes were taken into account in the MC sample used for the acceptance-correction procedure. To correct from the number of reconstructed mesons to the production cross sections, small migrations were taken into account between the tagged and antitagged samples. It was checked that the Rapgap MC sample gives a reasonable description of the data for selected DIS and meson variables. Figures 4, 5 and 6 show important variables for the secondary vertex reconstruction, distributions for the DIS variables and the kinematics of the meson, respectively. For all variables, the number of reconstructed mesons is extracted by fitting the number of mesons in each bin of the distribution. The MC provides a good enough description of the data for acceptance calculations in all variables.
Reconstruction acceptances vary depending on the particle and kinematic region of the measurement. For example, the overall and acceptances calculated with Rapgap after applying the selection criteria for the kinematic region are and , respectively. The lower average acceptance in relation to previous ZEUS measurements is accounted for by reduced efficiency for reconstructed mesons due to the extension of the kinematic range to lower and the use of lifetime tagging. This is offset by a gain of a factor of 20 and 3 in the signal to background ratios of the and samples.
The systematic uncertainties of the measured cross sections were determined by changing the analysis procedure and repeating all calculations. The following possible sources of systematic uncertainties were considered [53, 29] with the average effect on the measured and total cross sections shown in parentheses:
-
•
the cut on was changed by ();
-
•
the cut on the scattered electron energy, , was changed by 1 GeV ();
-
•
the -quark cross section was varied by a factor of two in the reference MC sample ();
-
•
the uncertainty of the tracking performance was obtained by varying all momenta by which corresponds to the uncertainty in the magnetic field; and by changing the track momentum and angular resolutions by of their values. The asymmetric resolution variations were used since the MC signals typically had somewhat narrower widths than those observed in the data ();
-
•
the uncertainty of the MVD hit efficiency was obtained [29] by evaluating the relative difference in single-track efficiency between data and MC when 2 and 2 measurements were required in the BMVD ();
-
•
the cut on was varied by in the analysis and in the analysis [54] ();
-
•
the cut on the of the secondary vertex was changed by 2 in the analysis and 1.5 in the analysis ();
-
•
the MC distribution was reweighted in order to account for the difference (see Fig. 6) between data and MC ();
-
•
the MC distribution was reweighted in order to account for the difference (see Fig. 6) between data and MC ().
An additional source of systematic uncertainty in the analysis was investigated:
-
•
the background function was parameterised by an exponential function ().
Several other sources of systematic uncertainty were considered and found to have an effect of on the total cross sections. These sources were related to the DIS selection criteria and the method for extracting the number of tagged mesons.
The systematic uncertainty is dominated by , which is related to the description of the MVD resolution. This uncertainty was evaluated from the differences between the data and MC description of (see Fig. 4). This difference was then propagated to a cut variation of the cut and the analysis procedure repeated.
Contributions from the different systematic uncertainties were calculated and added in quadrature separately for positive and negative variations. Uncertainties due to those on the luminosity measurement and branching ratios were only included in the measured and total cross sections. For differential cross sections these uncertainties are not included in the tables and figures.
7 Cross sections
Charm meson cross sections for the process were calculated using the reconstructed and signals (see Section 3) in the kinematic region , , and .
The following cross sections were measured:
-
•
The production cross section for and mesons:
-
•
The production cross section for and mesons not originating from decays:
The corresponding predictions from HVQDIS are:
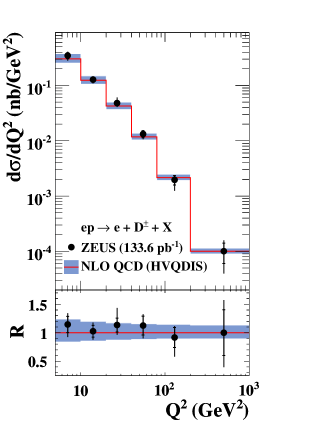
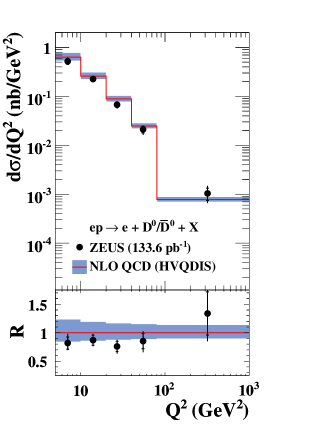
where “had.” and “br.” represent the uncertainty on the HVQDIS prediction due to the uncertainties of the hadronisation fraction and decay-chain branching ratios, respectively. The predictions used the default parameter settings as discussed in Section 5. The quadratic sum of the other uncertainties of these predictions is shown with the “syst.” label. A small contribution () to the total cross sections arises from mesons produced in events. All predictions include a contribution calculated in each bin with HVQDIS. The HVQDIS predictions are in agreement with the data.
The differential and cross sections as functions of and are shown in Figs. 7 and 8 and given in Tables 1 and 2. The cross sections in and both fall by about three orders of magnitude in the measured region. The cross section in falls by about two orders of magnitude and there is no significant dependence on . The HVQDIS predictions describe the shape of all measured differential cross sections well. The slight difference in normalisation in Fig. 8 reflects the difference of the corresponding total cross section.
8 Extraction of
The open-charm contribution, , to the proton structure function, , can be defined in terms of the inclusive double-differential cross section in and by
| (5) |
In this paper, the cross section is obtained by measuring the and production cross sections and employing the hadronisation fraction to derive the total charm cross section. A limited kinematic region is accessible for the measurement of mesons, therefore a prescription for extrapolating to the full kinematic phase space is needed. The measured value of in a bin is calculated with
| (6) |
where is the cross section in the bin in the measured region of and and is the corresponding cross section evaluated with HVQDIS. The value of was calculated in FFNS from the NLO coefficient functions [47] using the same values of parameters as in the calculation of . The cross sections were measured in bins of and (Table 3) and is quoted at representative and values near the centre-of-gravity for each bin (Table 4).
Beauty contributions were subtracted from the data using the predictions obtained from HVQDIS. The contribution to the total cross section from calculated using the ZEUS NLO fit was, on average, 1.3 and at most [5] and was taken into account, in , in the extraction of . The size of the contribution from was similar to that in other PDFs.
The factor to extrapolate from the measurement range to the full phase space was estimated using HVQDIS and was found to vary from at high to at low . A complete list of the extrapolation factors is given in Table 4.
The following uncertainties associated with the method of extrapolation were evaluated with the average effect given in parentheses:
-
•
changing the charm mass by GeV consistently in the HVQDIS calculation and in the calculation of (). The largest effect was seen at low and low ;
-
•
using the upper and lower predictions given by the uncertainty in the ZEUS NLO PDF fit, propagated from the experimental uncertainties of the fitted data, to perform the extraction of ();
-
•
changing the contribution of beauty events subtracted from the data by a factor 2 (). The largest effect was seen at low and high ();
- •
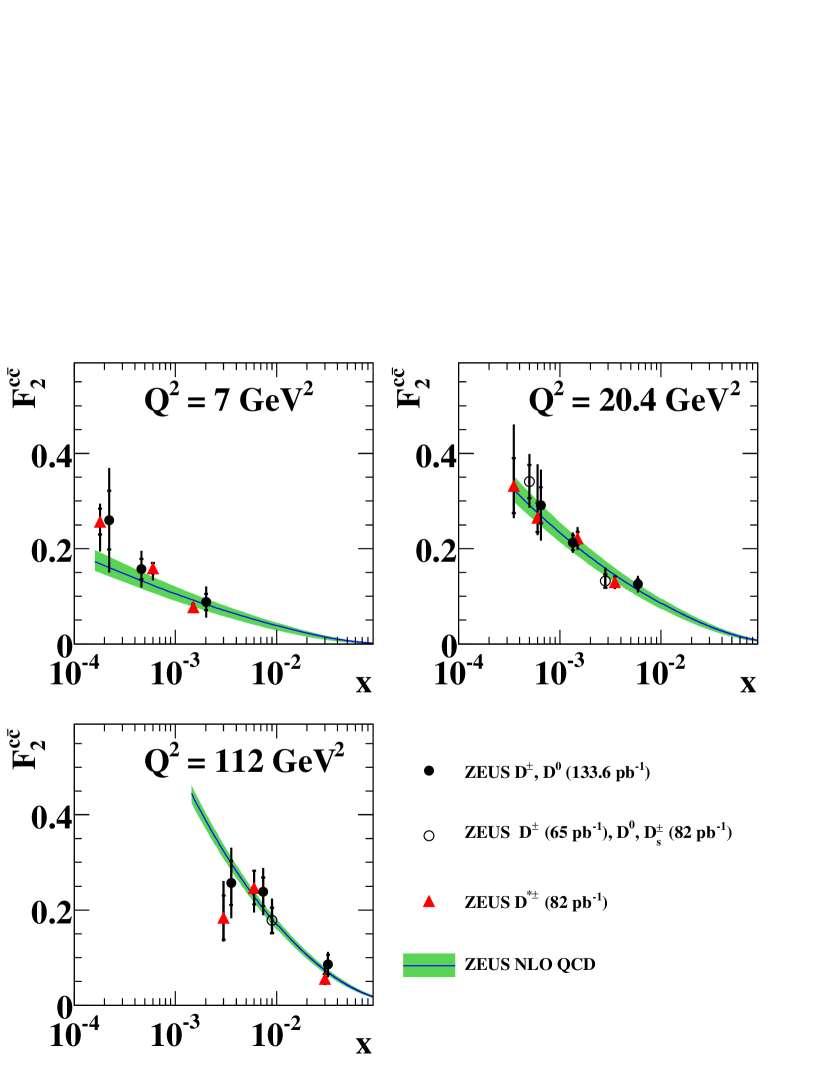
The values measured from and data are combined using a procedure that accounts for the systematic and point-to-point correlations between the analyses [55]. The combined values of obtained from and production are given in Table 5 and shown in Fig. 9. Also shown is the ZEUS NLO QCD fit which describes the data well for all and . The uncertainty of the theoretical prediction shown is that from uncertainty of the charm mass. Due to the improved statistical precision resulting from lifetime tags with the MVD, more measurements of were extracted than in the previous publication [8]. Also, extrapolation factors were significantly reduced, from e.g. a value of about 5–6 to about 2 at GeV2, due to the extension of the kinematic range to lower . At high these results are competitive with based measurements [5].
9 Conclusions
The production of the charm mesons and has been measured with the ZEUS detector in the kinematic range GeV2, , GeV and . Combinatorial background to the meson signals was reduced by using the ZEUS microvertex detector to reconstruct displaced secondary vertices.
The measured meson cross sections were compared to the predictions of NLO QCD with the proton PDFs extracted from inclusive DIS data. A good description was found.
The visible cross sections in bins of and were used to extract the open-charm contribution, , to the proton structure function, . The extraction used factors calculated within the framework of NLO QCD.
The use of the microvertex detector has increased the precision and allowed an extension in the kinematic range to lower values of compared to previous results. Along with previous measurements of , the results presented here provide a direct constraint on the gluon density of the proton.
10 Acknowledgements
The strong support and encouragement of the DESY Directorate has been invaluable, and we are much indebted to the HERA machine group for their inventiveness and diligent efforts. The design, construction and installation of the ZEUS detector were made possible by the ingenuity and dedicated efforts of many people from inside DESY and from the home institutes who are not listed as authors. Their contributions are acknowledged with great appreciation.
10
References
- [1] ZEUS Coll., J. Breitweg et al., Eur. Phys. J. C 12, 35 (2000)
- [2] H1 Coll., C. Adloff et al., Phys. Lett. B 528, 199 (2002)
- [3] ZEUS Coll., J. Breitweg et al., Phys. Lett. B 407, 402 (1997)
- [4] H1 Coll., C. Adloff et al., Nucl. Phys. B 545, 21 (1999)
- [5] ZEUS Coll., S. Chekanov et al., Phys. Rev. D 69, 012004 (2004)
- [6] H1 Coll., A. Aktas et al., Eur. Phys. J. C 40, 349 (2005)
- [7] H1 Coll., A. Aktas et al., Eur. Phys. J. C 38, 447 (2005)
- [8] ZEUS Coll., S. Chekanov et al., JHEP 07, 074 (2007)
- [9] ZEUS Coll., U. Holm (ed.), The ZEUS Detector. Status Report (unpublished), DESY (1993), available on http://www-zeus.desy.de/bluebook/bluebook.html
- [10] N. Harnew et al., Nucl. Inst. Meth. A 279, 290 (1989)
- [11] B. Foster et al., Nucl. Phys. Proc. Suppl. B 32, 181 (1993)
- [12] B. Foster et al., Nucl. Inst. Meth. A 338, 254 (1994)
- [13] A. Polini et al., Nucl. Inst. Meth. A 581, 656 (2007)
- [14] M. Derrick et al., Nucl. Inst. Meth. A 309, 77 (1991)
- [15] A. Andresen et al., Nucl. Inst. Meth. A 309, 101 (1991)
- [16] A. Caldwell et al., Nucl. Inst. Meth. A 321, 356 (1992)
- [17] A. Bernstein et al., Nucl. Inst. Meth. A 336, 23 (1993)
- [18] A. Bamberger et al., Nucl. Inst. Meth. A 401, 63 (1997)
- [19] A. Dwurazny et al., Nucl. Inst. Meth. A 277, 176 (1989)
- [20] J. Andruszków et al., Preprint DESY-92-066, DESY, 1992
- [21] ZEUS Coll., M. Derrick et al., Z. Phys. C 63, 391 (1994)
- [22] J. Andruszków et al., Acta Phys. Pol. B 32, 2025 (2001)
- [23] M. Helbich et al., Nucl. Inst. Meth. A 565, 572 (2006)
- [24] W.H. Smith, K. Tokushuku and L.W. Wiggers, Proc. Computing in High-Energy Physics (CHEP), Annecy, France, Sept. 1992, C. Verkerk and W. Wojcik (eds.), p. 222. CERN, Geneva, Switzerland (1992). Also in preprint DESY 92-150B
- [25] P.D. Allfrey et al., Nucl. Inst. Meth. A 580, 1257 (2007)
- [26] S. Bentvelsen, J. Engelen and P. Kooijman, Proc. Workshop on Physics at HERA, W. Buchmüller and G. Ingelman (eds.), Vol. 1, p. 23. Hamburg, Germany, DESY (1992)
- [27] F. Jacquet and A. Blondel, Proceedings of the Study for an Facility for Europe, U. Amaldi (ed.), p. 391. Hamburg, Germany (1979). Also in preprint DESY 79/48
- [28] G.M. Briskin, Ph.D. Thesis, Tel Aviv University, Report DESY-THESIS 1998-036, 1998
- [29] D. Nicholass, Ph.D. Thesis, University College London, London, Report DESY-THESIS-2008-046, 2008
- [30] P. Billoir, R. Frühwirth and M. Regler, Nucl. Inst. Meth. A 241, 115 (1985)
- [31] ZEUS Coll., S. Chekanov et al., Eur. Phys. J. C 44, 13 (2005)
- [32] W.-M. Yao et al. (Particle Data Group), Journal of Physics G 33, 1 (2006)
- [33] H. Jung, Comp. Phys. Comm. 86, 147 (1995)
- [34] A. Kwiatkowski, H. Spiesberger and H.-J. Möhring, Comp. Phys. Comm. 69, 155 (1992). Also in Proc. Workshop Physics at HERA, W. Buchmüller and G.Ingelman (eds.), DESY, Hamburg (1991)
- [35] R. Brun et al., geant3, Technical Report CERN-DD/EE/84-1, CERN, 1987
- [36] CTEQ Coll., H.L. Lai et al., Eur. Phys. J. C 12, 375 (2000)
- [37] B. Andersson et al., Phys. Rep. 97, 31 (1983)
- [38] B.W. Harris and J. Smith, Phys. Rev. D 57, 2806 (1998)
- [39] V.N. Gribov and L.N. Lipatov, Sov. J. Nucl. Phys. 15, 438 (1972)
- [40] L.N. Lipatov, Sov. J. Nucl. Phys. 20, 94 (1975)
- [41] G. Altarelli and G. Parisi, Nucl. Phys. B 126, 298 (1977)
- [42] Yu.L. Dokshitzer, Sov. Phys. JETP 46, 641 (1977)
- [43] B.W. Harris and J. Smith, Nucl. Phys. B 452, 109 (1995)
- [44] B.W. Harris and J. Smith, Phys. Lett. B 353, 535 (1995). Erratum-ibid B 359 (1995) 423
- [45] E. Laenen et al., Nucl. Phys. B 392, 162 (1993)
- [46] E. Laenen et al., Nucl. Phys. B 392, 229 (1993)
- [47] ZEUS Coll., S. Chekanov et al., Phys. Rev. D 67, 012007 (2003)
- [48] Public access to ZEUS 2002 PDFs, available on http://www-pnp.physics.ox.ac.uk/cooper/zeus2002.html
- [49] C. Peterson et al., Phys. Rev. D 27, 105 (1983)
- [50] P. Nason et al., Nucl. Phys. B 565, 245 (2000)
- [51] ALEPH Coll., D. Buskulic et al., Phys. Lett. B 388, 648 (1996)
- [52] ZEUS Coll., S. Chekanov et al., Measurement of the charm fragmentation function in photoproduction at HERA, to be submitted to JHEP (2008)
- [53] G. Grigorescu, Ph.D. Thesis, NIKHEF, Amsterdam, 2008 (unpublished)
- [54] J. Gassner, Ph.D. Thesis, ETH Zürich, 2002 (unpublished)
- [55] A. Glazov, DIS2005, Proceedings of the 13th International Workshop on Deep Inelastic Scattering, W.H. Smith et al. (ed.), p. 237. American Institute of Physics (2005)
| bin | |||||||||
|---|---|---|---|---|---|---|---|---|---|
| (GeV2) | (nb/GeV2) | ||||||||
| 5, | 10 | 0. | 35 | 0. | 04 | +0. | 04 | 0. | 05 |
| 10, | 20 | 0. | 13 | 0. | 01 | +0. | 01 | 0. | 01 |
| 20, | 40 | 0. | 048 | 0. | 005 | +0. | 012 | 0. | 005 |
| 40, | 80 | 0. | 013 | 0. | 002 | +0. | 001 | 0. | 002 |
| 80, | 200 | 0. | 0020 | 0. | 0004 | +0. | 0002 | 0. | 0006 |
| 200, | 1000 | 0. | 00010 | 0. | 00004 | +0. | 00004 | 0. | 00005 |
| bin | |||||||||
| (nb) | |||||||||
| 0.00008, | 0.0004 | 3773. | 0 | 566. | 0 | +577. | 0 | 773. | 0 |
| 0.00040, | 0.0016 | 1643. | 0 | 136. | 0 | +183. | 0 | 128. | 0 |
| 0.0016, | 0.005 | 327. | 0 | 33. | 0 | +39. | 0 | 42. | 0 |
| 0.005, | 0.01 | 55. | 0 | 11. | 0 | +9. | 0 | 19. | 0 |
| 0.01, | 0.1 | 1. | 5 | 0. | 5 | +0. | 2 | 0. | 5 |
| bin | |||||||||
| (GeV) | (nb/GeV) | ||||||||
| 1.5, | 2.4 | 2. | 63 | 0. | 50 | +0. | 59 | 0. | 87 |
| 2.4, | 3.1 | 1. | 37 | 0. | 17 | +0. | 10 | 0. | 20 |
| 3.1, | 4.0 | 0. | 73 | 0. | 07 | +0. | 06 | 0. | 04 |
| 4.0, | 6.0 | 0. | 32 | 0. | 03 | +0. | 03 | 0. | 02 |
| 6.0, | 15.0 | 0. | 032 | 0. | 003 | +0. | 003 | 0. | 003 |
| bin | |||||||||
| (nb) | |||||||||
| 1.6, | 0.8 | 1. | 05 | 0. | 16 | +0. | 32 | 0. | 11 |
| 0.8, | 0.4 | 1. | 35 | 0. | 17 | +0. | 18 | 0. | 17 |
| 0.4, | 0.0 | 1. | 76 | 0. | 22 | +0. | 24 | 0. | 22 |
| 0.0, | 0.4 | 1. | 37 | 0. | 17 | +0. | 22 | 0. | 18 |
| 0.4, | 0.8 | 1. | 70 | 0. | 23 | +0. | 21 | 0. | 40 |
| 0.8, | 1.6 | 1. | 62 | 0. | 27 | +0. | 29 | 0. | 40 |
| bin | |||||||||
|---|---|---|---|---|---|---|---|---|---|
| (GeV2) | (nb/GeV2) | ||||||||
| 5, | 10 | 0. | 52 | 0. | 07 | +0. | 08 | 0. | 04 |
| 10, | 20 | 0. | 23 | 0. | 02 | +0. | 02 | 0. | 02 |
| 20, | 40 | 0. | 067 | 0. | 008 | +0. | 007 | 0. | 008 |
| 40, | 80 | 0. | 021 | 0. | 003 | +0. | 003 | 0. | 003 |
| 80, | 1000 | 0. | 0010 | 0. | 0003 | +0. | 0003 | 0. | 0002 |
| bin | |||||||||
| (nb) | |||||||||
| 0.00008, | 0.0004 | 4697. | 0 | 824. | 0 | +769. | 0 | 743. | 0 |
| 0.00040, | 0.0016 | 2896. | 0 | 254. | 0 | +235. | 0 | 225. | 0 |
| 0.0016, | 0.005 | 527. | 0 | 54. | 0 | +41. | 0 | 55. | 0 |
| 0.005, | 0.1 | 10. | 0 | 2. | 0 | +4. | 0 | 2. | 0 |
| bin | |||||||||
| (GeV) | (nb/GeV) | ||||||||
| 1.5, | 2.4 | 2. | 90 | 0. | 45 | +0. | 26 | 0. | 26 |
| 2.4, | 3.1 | 2. | 49 | 0. | 31 | +0. | 29 | 0. | 32 |
| 3.1, | 4.0 | 1. | 35 | 0. | 15 | +0. | 14 | 0. | 17 |
| 4.0, | 6.0 | 0. | 53 | 0. | 05 | +0. | 03 | 0. | 02 |
| 6.0, | 15.0 | 0. | 058 | 0. | 007 | +0. | 012 | 0. | 009 |
| bin | |||||||||
| (nb) | |||||||||
| 1.6, | 0.8 | 1. | 42 | 0. | 29 | +0. | 25 | 0. | 23 |
| 0.8, | 0.4 | 2. | 87 | 0. | 39 | +0. | 41 | 0. | 37 |
| 0.4, | 0.0 | 2. | 36 | 0. | 30 | +0. | 30 | 0. | 43 |
| 0.0, | 0.4 | 2. | 68 | 0. | 36 | +0. | 42 | 0. | 16 |
| 0.4, | 0.8 | 3. | 18 | 0. | 42 | +0. | 34 | 0. | 36 |
| 0.8, | 1.6 | 1. | 81 | 0. | 33 | +0. | 35 | 0. | 27 |
| bin | bin | ||||
|---|---|---|---|---|---|
| (GeV2) | (nb) | ||||
| 0.02, 0.12 | 0.52 | 0.13 | +0.17 | 0.14 | |
| 5, 9 | 0.12, 0.30 | 0.59 | 0.11 | +0.08 | 0.17 |
| 0.30, 0.70 | 0.56 | 0.17 | +0.17 | 0.14 | |
| 0.02, 0.12 | 0.94 | 0.10 | +0.07 | 0.13 | |
| 9, 44 | 0.12, 0.30 | 0.96 | 0.09 | +0.06 | 0.06 |
| 0.30, 0.70 | 0.73 | 0.12 | +0.08 | 0.20 | |
| 0.02, 0.12 | 0.20 | 0.05 | +0.01 | 0.03 | |
| 44, 1000 | 0.12, 0.30 | 0.35 | 0.06 | +0.05 | 0.08 |
| 0.30, 0.70 | 0.24 | 0.05 | +0.03 | 0.06 | |
| bin | bin | ||||
| (GeV2) | (nb) | ||||
| 0.02, 0.12 | 0.80 | 0.24 | +0.23 | 0.16 | |
| 5, 9 | 0.12, 0.30 | 0.92 | 0.20 | +0.13 | 0.12 |
| 0.30, 0.70 | 0.48 | 0.17 | +0.11 | 0.14 | |
| 0.02, 0.12 | 1.62 | 0.18 | +0.10 | 0.13 | |
| 9, 44 | 0.12, 0.30 | 1.42 | 0.15 | +0.05 | 0.06 |
| 0.30, 0.70 | 1.22 | 0.24 | +0.24 | 0.18 | |
| 0.02, 0.12 | 0.19 | 0.09 | +0.06 | 0.04 | |
| 44, 1000 | 0.12, 0.30 | 0.54 | 0.09 | +0.06 | 0.04 |
| 0.30, 0.70 | 0.54 | 0.15 | +0.15 | 0.18 | |
| factor | ||||||||
| (GeV2) | ||||||||
| 0.00022 | 0.295 | 0.092 | +0.091 | 0.074 | +0.026 | 0.022 | 3.2 | |
| 7.0 | 0.00046 | 0.176 | 0.031 | +0.023 | 0.050 | +0.010 | 0.008 | 2.3 |
| 0.00202 | 0.091 | 0.023 | +0.030 | 0.025 | +0.013 | 0.014 | 3.1 | |
| 0.00065 | 0.319 | 0.054 | +0.037 | 0.086 | +0.022 | 0.020 | 2.5 | |
| 20.4 | 0.00134 | 0.241 | 0.024 | +0.016 | 0.014 | +0.013 | 0.013 | 1.8 |
| 0.00588 | 0.131 | 0.015 | +0.010 | 0.018 | +0.009 | 0.009 | 2.4 | |
| 0.00356 | 0.260 | 0.058 | +0.029 | 0.066 | +0.020 | 0.025 | 1.7 | |
| 112.0 | 0.00738 | 0.280 | 0.049 | +0.038 | 0.064 | +0.032 | 0.033 | 1.5 |
| 0.03230 | 0.089 | 0.024 | +0.004 | 0.015 | +0.002 | 0.002 | 2.4 | |
| factor | ||||||||
| (GeV2) | ||||||||
| 0.00022 | 0.116 | 0.042 | +0.028 | 0.035 | +0.010 | 0.009 | 3.2 | |
| 7.0 | 0.00046 | 0.131 | 0.029 | +0.019 | 0.017 | +0.007 | 0.006 | 2.3 |
| 0.00202 | 0.068 | 0.020 | +0.019 | 0.014 | +0.010 | 0.010 | 3.1 | |
| 0.00065 | 0.252 | 0.051 | +0.049 | 0.037 | +0.017 | 0.016 | 2.5 | |
| 20.4 | 0.00134 | 0.169 | 0.019 | +0.006 | 0.007 | +0.009 | 0.009 | 1.8 |
| 0.00588 | 0.109 | 0.012 | +0.006 | 0.009 | +0.007 | 0.008 | 2.4 | |
| 0.00356 | 0.280 | 0.086 | +0.077 | 0.096 | +0.022 | 0.027 | 1.7 | |
| 112.0 | 0.00738 | 0.203 | 0.037 | +0.024 | 0.016 | +0.023 | 0.024 | 1.5 |
| 0.03230 | 0.040 | 0.019 | +0.012 | 0.008 | +0.001 | 0.001 | 2.4 | |
| (GeV2) | ||||||
|---|---|---|---|---|---|---|
| 0.00022 | 0.260 | 0.062 | +0.007 | 0.067 | ||
| 7.0 | 0.00046 | 0.157 | 0.022 | +0.016 | 0.035 | |
| 0.00202 | 0.088 | 0.017 | +0.009 | 0.016 | ||
| 0.00065 | 0.291 | 0.038 | +0.020 | 0.094 | ||
| 20.4 | 0.00134 | 0.213 | 0.016 | +0.018 | 0.040 | |
| 0.00588 | 0.126 | 0.010 | +0.010 | 0.042 | ||
| 0.00356 | 0.257 | 0.046 | +0.020 | 0.084 | ||
| 112.0 | 0.00738 | 0.238 | 0.030 | +0.015 | 0.041 | |
| 0.03230 | 0.086 | 0.020 | +0.001 | 0.026 | ||