Large grains in disks around young stars: ATCA observations of WW Cha, RU Lup, and CS Cha
Abstract
Context. Grains in disks around young stars grow from interstellar submicron sizes to planetesimals, up to thousands of kilometres in size, over the course of several Myr. Thermal emission of large grains or pebbles can be best observed at centimetre wavelengths. However, other emission mechanisms can contribute, most notably free-free emission from stellar winds and chromospheric activity.
Aims. We aim to determine the mechanisms of centimetre emission for three T Tauri stars. WW Cha and RU Lup were recently found to have grain growth at least up to millimetre sizes in their circumstellar disks, based on millimetre data up to 3.3 mm. CS Cha has similar indications for grain growth in its circumbinary disk.
Methods. The T Tauri stars WW Cha and RU Lup were monitored over the course of several years at millimetre and centimetre wavelengths, using the Australia Telescope Compact Array (ATCA). The new ATCA 7 mm system was also used to observe CS Cha at 7 mm.
Results. WW Cha was detected on several occasions at 7 and 16 mm. We obtained one detection of WW Cha at 3.5 cm and upper limits only for 6.3 cm. The emission at 16 mm was stable over periods of days, months and years, whereas the emission at 3.5 cm is found to be variable. A second young stellar object, Ced 112 IRS 4, was found in the field of WW Cha at 16 mm. RU Lup was detected at 7 mm. It was observed at 16 mm three times and at 3 and 6 cm four times and found to be variable in all three wavebands. CS Cha was detected at 7 mm, but the signal-to-noise was not high enough to resolve the gap in the circumbinary disk. The typical resolution of the 7 and 16 mm observations were 5–10 arcsec with rms mJy.
Conclusions. The emission at 3, 7 and 16 mm for WW Cha is well explained by thermal emission from millimetre and centimetre-sized “pebbles.” The cm spectral index between 3.5 and 6.3 cm is consistent with the emission from an optically-thick ionised wind, although the high variability of the cm emission points to a non-thermal contribution. The spectral energy distributions of both RU Lup and CS Cha from 1 to 7 mm are consistent with thermal emission from mm-sized grains. The variability of the longer-wavelength emission for RU Lup and the negative spectral index suggests non-thermal emission, arising from an optically-thin plasma.
Key Words.:
circumstellar matter – planetary systems: protoplanetary disks – stars: formation – stars: individual (WW Cha, RU Lup, CS Cha)1 Introduction
Planet formation takes place in the disks around young stellar objects (YSOs), where submicron-sized grains have to grow to planet size in about 10 Myr or less (Haisch et al., 2001; Carpenter et al., 2005; Setiawan et al., 2008). The very first step, where the grains grow from submicron size to several microns, may be traced by the 10-m silicate feature. Silicates of a few microns in size give considerably flatter features than those of submicron sizes (e.g. Przygodda et al., 2003). However, the strength and shape of the 10-m feature may also be influenced by the crystallinity of the grains (e.g., Meeus et al., 2003), or by their porosity (Voshchinnikov & Henning, 2008). Furthermore, the 10-m silicate feature only probes the surface layers of the circumstellar disks.
Growth up to millimetre (mm) sizes can be more readily observed by looking at the mm slope in the spectral energy distribution (SED). From the slope , where , the opacity index in the mm regime, where , can be obtained through
| (1) |
where is the ratio of optically thick to optically thin emission from the disk (Beckwith et al., 1990; Beckwith & Sargent, 1991; Rodmann et al., 2006). An opacity index indicates that grains have grown at least up to mm sizes, irrespective of their exact physical structure (Draine, 2006). Indeed, about 30 sources with grains up to at least mm sizes have been found over the past several years (Natta et al., 2004; Rodmann et al., 2006; Andrews & Williams, 2007; Lommen et al., 2007).
The next step, growth to centimetre (cm) sizes and beyond, is much harder to observe directly. The reason for this is that at cm wavelengths, where these “pebbles” can be observed, the emission is several orders of magnitudes weaker than at mm wavelengths. Furthermore, other processes such as chromospheric activity (Forbrich et al., 2007), gyrosynchrotron emission (André et al., 1988), electron-cyclotron maser emission (Dulk, 1985; Smith et al., 2003) or an ionised wind (Girart et al., 2004) may also contribute significantly to the cm emission. A particularly interesting source of variable cm emission may be that from (interacting) helmet streamers (Massi et al., 2006, 2008). To rule out these other cm emission mechanisms, the sources have to be monitored over days, months, and years, to ascertain that the cm emission is optically thin and not variable, and ideally be spatially resolved. So far, TW Hya is the only T Tauri star that has been monitored over sufficient time periods to safely characterise the cm emission as thermal emission from pebbles (Wilner et al., 2005). [Natta et al. (2004) and Alonso-Albi et al. (2008) also claim thermal emission from cm-sized grains though their observations have not yet been monitored over an extended period of time.]
Lommen et al. (2007) observed T Tauri stars in the southern constellations Lupus and Chamaeleon with the Australia Telescope Compact Array (ATCA111The Australia Telescope Compact Array is part of the Australia Telescope which is funded by the Commonwealth of Australia for operation as a National Facility managed by CSIRO.) at 3.3 mm, and found three sources that were resolved and had an opacity index . We chose the two brightest of these, WW Cha and RU Lup, for follow-up observations with the ATCA at 7 mm through 6 cm, the results of which are presented in this paper. The source CS Cha was not resolved at 3 mm but found to have an opacity index of by Lommen et al. (2007) and was added for high-resolution observations at 7 mm.
WW Cha is located in a reflection nebula in the Ced 112 region of the Chamaeleon I molecular cloud, and is thought to drive the highly collimated jets HH 915 and HH 931 (Bally et al., 2006; Wang & Henning, 2006). Wang & Henning (2006) claim that two near-infrared molecular-hydrogen emission knots detected by Gómez et al. (2004) on the opposite side of WW Cha may be the counterparts of HH 915. WW Cha has a relatively weak 10-m amorphous-silicate feature (Przygodda et al., 2003), indicating that the surface layers are dominated by micron-sized grains. No clear crystalline features are detected in the 10-m region. Reipurth et al. (1996) placed the bright mm source Cha-MMS2 about from IRAS 11083-7618, which is the infared counterpart to the T Tauri star WW Cha. However, given the similar fluxes found from SEST observations by both Henning et al. (1993) and Reipurth et al. (1996), the lack of other mm sources within several tens of arcseconds, and the fairly large beam used for these and the IRAS observations, we claim that Cha-MMS2 and WW Cha are one and the same source. Another T Tauri star, Ced 112 IRS 4, is located about to the north from WW Cha.
RU Lup is a very active and well-studied T Tauri star, showing variability in the optical, UV and X-ray bands (e.g. Lamzin et al., 1996; Stempels & Piskunov, 2002; Herczeg et al., 2005; Robrade & Schmitt, 2007). The mass accretion rate onto the central star is found to be relatively large, at M⊙ yr-1 (Lamzin et al., 1996; Podio et al., 2007). Stempels & Piskunov (2002) studied the variations in the radial velocity in RU Lup, which they found to be periodic with a period of 3.71 days. Stempels & Piskunov attribute this periodic variability to long-lived star spots, and find the solution of a substellar companion unlikely. Olofsson et al. (2008, in prep.) show a very strong and boxy 10-m feature for RU Lup, indicating the presence of submicron-sized particles in the disk photosphere. Contributions from crystalline silicates are detected between 20 and 35 m (Kessler-Silacci et al., 2006).
CS Cha was classified as a so-called transitional disk by Espaillat et al. (2007). The SEDs of transitional disks show a lack of infrared emission, indicating a deficit of warm dust close to the star. SEDs of transitional disks are well fit by models that include an inner hole, suggesting that the disks are in a transitional stage. The loss of warm dust can be explained by photo-evaporation, by dust growing to larger sizes and effectively moving the flux to longer wavelengths in the SED, and/or by the presence of an unseen planet that sweeps up material in the inner disk. However, CS Cha was recently found to be a binary (Guenther et al., 2007), and so is now classified as a circumbinary disk rather than a transitional disk. Basic parameters of the sources WW Cha, RU Lup, and CS Cha are presented in Table 1.
| Source | Cloud | Distancea | Ageb | Luminosityb | Massb | Spectral | Positiond |
|---|---|---|---|---|---|---|---|
| (pc) | (Myr) | (L⊙) | (M⊙) | typec | |||
| WW Cha | Cha I | 0.4–0.8 | 2.2 | 0.6–0.8 | K5 | (11:10:00.7, -76:34:59) | |
| RU Lup | Lup II | 0.04–0.5 | 2.1 | 2.0–2.8 | K7-M0 | (15:56:42.3, -37:49:15.47) | |
| CS Cha | Cha I | 2–3 | 1.3 | 0.9–1.2 | K4 | (11:02:25.1, -77:33:35.95) |
- a
- b
- c
-
d
RA and dec positions (J2000) from SIMBAD.
We here present observations of WW Cha and RU Lup, taken with the ATCA at wavelengths ranging from 7 mm to 6.3 cm, to determine their cm emission mechanisms. We also present ATCA 7 mm observations of the binary CS Cha, with the aim to obtain a longer-wavelength flux point and resolve the hole in the dust disk, which has a diameter of AU (Espaillat et al., 2007), at mm wavelengths. The observations are described in Sect. 2, with the basic results presented in Sect. 3 and further discussed in Sect. 4. Conclusions are presented in Sect. 5.
2 Observations
We present continuum observations of WW Cha, RU Lup, and CS Cha, observed with the ATCA over the period 2006-2008 at 7 and 16 mm and at 3.5 and 6.3 cm. The observations are listed in Table 2. ATCA is an array of m antennas, with antenna 6 (CA06) fixed at 6 km. The observations were carried out in double sideband, where each sideband had a bandwidth of 128 MHz. CA06 was only included in the reduction when the array was in an extended configuration (1.5A, 1.5B or 6D – where the number in these array configuration is approximately the longest baseline in kilometres). The data were calibrated and imaged using the MIRIAD package (Sault et al., 1995).
The complex gain calibration was done on the calibrators QSO B1057-797 (for WW Cha and CS Cha) and QSO B1622-297 (for RU Lup), both of which are within 10 degrees of the science targets. The complex gains for RU Lup were twice calibrated using different sources: on QSO B1600-44 (on 9 June 2007) and on QSO B1622-310 (on 4 November 2006).
Normally the absolute flux calibration was done on Uranus at 7 mm and on ATCA’s primary flux calibrator QSO B1934-638 at cm wavelengths. QSO B1934-638 is stable at cm wavelengths, and its flux as a function of frequency is well known. On two occasions the absolute flux calibration was done on Mars. The baselines on which Mars was resolved out were not used in the flux calibration. The absolute flux calibration was done on QSO B1057-797 and QSO B1921-293 on four occasions. See Table 2 for details.
Using QSO B1057-797 or QSO B1921-293 as an absolute flux calibrator does require some care. However, in some cases we have data very close in time to when the Observatory has published fluxes (e.g., the previous or next day for QSO B1057-797 in October 2007), and the long-term variability of QSO B1057-797 is at most a factor of 2, and that of QSO B1921-293 likely much smaller than that (see the ATCA calibrator pages at http://www.narrabri.atnf.csiro.au/calibrators/). In this work, we assume an uncertainty in the calibrated flux of about 15%, unless stated otherwise.
Note that for all of our observations the phase centre is offset from the source by one or two synthesised beamwidths in right ascension. This was done to avoid any artefacts at the centre of the field.
2.1 WW Cha
Observations of WW Cha at 7 mm were carried twice in compact configurations. On both days the observations did not include a planet for the flux calibrator and the fluxes were calibrated on the gain calibrator QSO B1057-797, resulting in an estimated uncertainty in the absolute flux calibration of 15% in October 2007 and 30% in March 2008. We conducted six observations of WW Cha at 16 mm in the period May 2006-March 2008, all in compact configurations except in November 2007 when an extended array was used. Without a dedicated flux calibrator on 31 March 2008, the estimated uncertainty for this track is 30%. WW Cha was observed at 3 and 6 cm twice.
2.2 RU Lup
RU Lup was observed at 7 mm just once, while three 16 mm observations were conducted, once in an extended configuration. One of the four observations made at 3 and 6 cm was in an extended array configuration. However a large fraction of the data on the longest baselines had to be flagged, losing the advantage of the extended configuration. Fluxes are thought to be calibrated to an uncertainty of 10% in October 2006.
2.3 CS Cha
Because the initial aim for CS Cha was to resolve the hole in the circumbinary disk, this source was only observed while the ATCA was in an extended configuration. CS Cha was observed four times at 7 mm in 2008, including a full track on 30 June, though poor weather rendered these data unusable.
| Obs. date | Wavelengths | Configuration | Flux calibrator | Integrationa | Notes |
| (mm) | (hours) | (weather, array & data) | |||
| WW Cha, ATCA 7 mm band | |||||
| 5 October 2007 | 7.0, 7.3 | H75C | 1057-797 | 1.35 | CA02 offline |
| 31 March 2008 | 7.0, 7.3 | H168 | 1057-797 | 1.99 | |
| WW Cha, ATCA 12 mm band | |||||
| 8 May 2006b | 16.1, 16.2 | H214C | Mars | 0.80 | excellent conditions; CA03CA04 offline |
| 13 October 2006 | 16.1, 16.2 | H214C | 1934-638 | 1.31 | very good conditions; noisy 16.1 mm data |
| 18 October 2006 | 16.1, 16.2 | EW352 | 1934-638 | 3.32 | noisy 16.1 mm data |
| 24 October 2007 | 15.4, 16.2 | H214C | 1934-638 | 3.15 | conditions deteriorated over scan |
| 2 November 2007 | 15.4, 16.2 | 1.5A | 1934-638 | 8.48 | |
| 31 March 2008 | 15.4, 16.2 | H168 | 1057-797 | 1.33 | |
| WW Cha, ATCA 3+6 cm bands | |||||
| 18 October 2006 | 34.7, 62.5 | EW352 | 1934-638 | 3.95 | a lot of data flagged |
| 9 June 2007 | 34.7, 62.5 | EW352 | 1934-638 | 5.19 | |
| RU Lup, ATCA 7 mm band | |||||
| 6 October 2007 | 7.0, 7.3 | H75C | Uranus | 0.99 | CA04 offline |
| RU Lup, ATCA 12 mm band | |||||
| 11 October 2006 | 16.1, 16.2 | H214C | 1934-638 | 3.66 | very good conditions |
| 24 October 2007 | 16.1, 16.2 | H214C | 1934-638 | 2.49 | fair conditions |
| 4 November 2007 | 15.4, 16.2 | 1.5A | 1934-638 | 3.79 | fair conditions |
| RU Lup, ATCA 3+6 cm bands | |||||
| 12 October 2006 | 34.7, 62.5 | H214C | 1934-638 | 3.53 | very good conditions |
| 13 October 2006 | 34.7, 62.5 | H214C | 1934-638 | 1.70 | very good conditions |
| 9 June 2007 | 34.7, 62.5 | EW352 | 1934-638 | 3.32 | good conditions |
| 4 November 2007 | 34.7, 62.5 | 1.5A | 1934-638 | 3.48 | a lot of data flagged |
| CS Cha, ATCA 7 mm band | |||||
| 26 April 2008 | 7.0, 7.3 | 6A | 1921-293 | 6.89 | fair conditions |
| 30 June 2008 | 6.7, 7.0 | 1.5B | Mars | 4.85 | poor conditions |
| 5 July 2008 | 6.7, 7.0 | 1.5B | Uranus | 0.72 | very good conditions |
| 6 July 2008 | 6.7, 7.0 | 1.5B | Uranus | 1.71 | fair conditions |
-
a
Total time spent on the science target, before flagging and calibration of data.
-
b
Three antennas only.
3 Results
3.1 WW Cha
Table 3 summarises the fluxes on the different dates at the various wavelengths. Note that in the Table and below the uncertainties do not include the uncertainties from the absolute flux calibration as given in the previous section. Continuum fluxes are from point-source fits in the () plane, where the source was detected at 3 or better. For the cases where WW Cha was not detected to at least 3, an upper limit of three times the root mean square of the noise is quoted.
| Obs. date | Wavelength | Fluxa | RMSa | Beam sizeb |
|---|---|---|---|---|
| (mm) | (mJy) | (mJy/beam) | (arcsec) | |
| ATCA 7 mm band | ||||
| 5 Oct 2007 | 7.0 | |||
| 5 Oct 2007 | 7.3 | |||
| 31 Mar 2008 | 7.0 | |||
| 31 Mar 2008 | 7.3 | |||
| ATCA 12 mm band | ||||
| 8 May 2006 | 16.1 | |||
| 8 May 2006 | 16.2 | |||
| 13 Oct 2006 | 16.1 | |||
| 13 Oct 2006 | 16.2 | |||
| 18 Oct 2006 | 16.1 | |||
| 18 Oct 2006 | 16.2 | |||
| 24 Oct 2007 | 15.4 | |||
| 24 Oct 2007 | 16.2 | |||
| 2 Nov 2007 | 15.4 | |||
| 2 Nov 2007 | 16.2 | |||
| 31 Mar 2008 | 15.4 | |||
| 31 Mar 2008 | 16.2 | |||
| ATCA 3 cm band | ||||
| 18 Oct 2006 | 34.7 | |||
| 9 June 2007 | 34.7 | |||
| ATCA 6 cm band | ||||
| 18 Oct 2006 | 62.5 | |||
| 9 June 2007 | 62.5 | |||
-
a
Continuum fluxes are from point-source fits in the () plane. If the source was not detected at 3, a 3 upper limit is quoted. RMS calculated from the cleaned image.
-
b
Restored beam, using natural weighting. Note that the exact beam size depends on frequency and location of the source in the sky, as well as on the time of the observations, over which time range the data were taken, and exactly which data/baselines were included.
-
c
The 16 mm values from the 2 November 2007 data were obtained with antenna 6 included, causing the significantly lower point-source flux. Note that a Gaussian fit recovers the full flux, indicating that the source is probably extended.
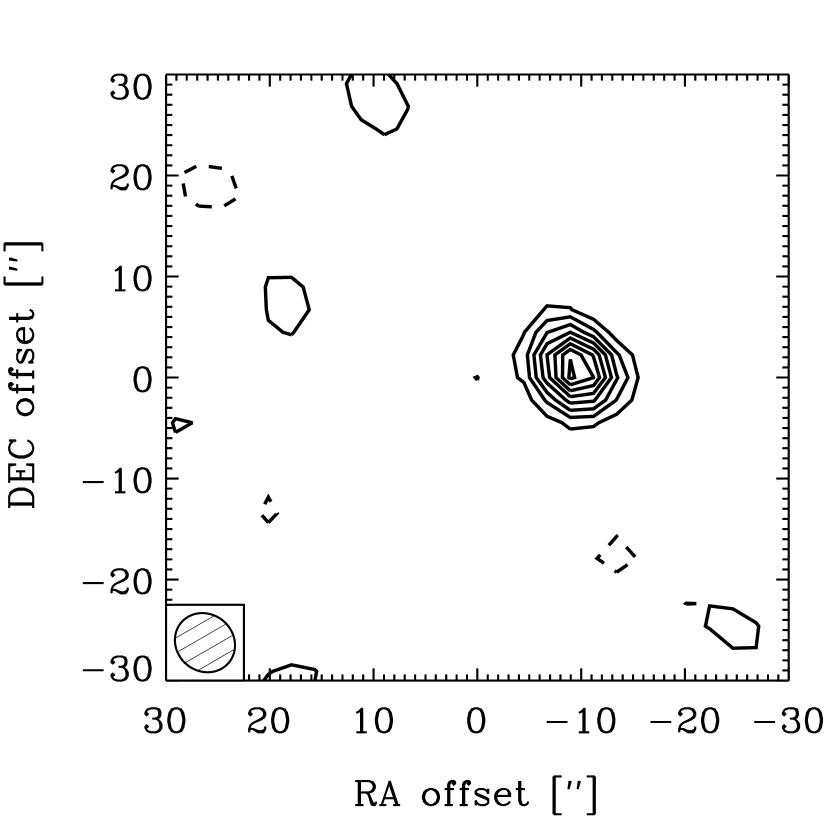
WW Cha was observed with the ATCA at 3.3 mm in August 2005 and reported to have a point-source flux of 25.9 mJy by Lommen et al. (2007). At 7 mm, the source was detected in both sidebands on both occasions at which it was observed, and the fluxes in the two sidebands were consistent from one date to the other to within the uncertainties of the absolute flux calibrations. The fluxes at the different frequencies will be treated as separate observations in the analysis. Figure 1 shows WW Cha at 7.3 mm.
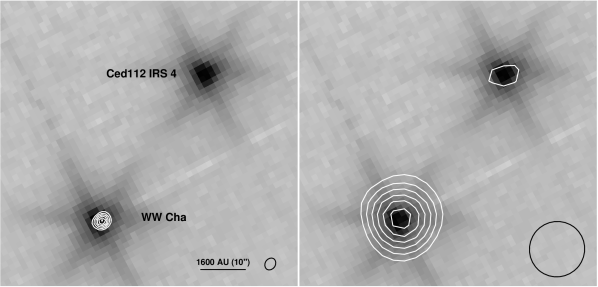
WW Cha was observed at 16 mm six times in the period May 2006–March 2008. It was detected in both sidebands each time it was observed except on 13 October 2006, when an upper limit was obtained at 16.1 mm. See Fig. 2 for a comparison of the 3 mm and 16 mm detections. For each frequency, the flux is constant over the different observations to within the uncertainties, as demonstrated by Fig. 3, which shows the results from point-source fits in the () plane at 16.2 mm, where CA06 was not included in the 2 November 2007 data for consistency. Taking the arithmetic mean of the fluxes and quadratic mean of the uncertainties given in Table 3, average point-source fluxes of , and mJy at 15.4, 16.1 and 16.2 mm respectively were obtained.

WW Cha was observed at 3.5 and 6.3 cm twice. A upper limit of 0.22 mJy at 3.5 cm was found on 18 October 2006, whilst on 9 June 2007 a point-source flux of mJy detected, demonstrating that the emission varies by a factor of 3 within a year. The emission at 3.5 cm was found to be unpolarised down to the noise level on 9 June 2007. upper limits of 0.20 and 0.40 mJy were determined at 6.3 cm on these two dates.
In conclusion, WW Cha is detected at 3, 7, 16 mm and 3.5 cm, and upper limits were found at 6.3 cm, as depicted in Fig. 4. Most notably, the source was detected at 16 mm six out of six times, and found stable over periods varying from days to years, while the 3.5 cm emission was found to vary.

3.1.1 Other sources in the field
At 16.2 mm, a second source was detected about 40 to the north-west of WW Cha. This source was identified with the YSO Ced 112 IRS 4 – see Fig. 2. The data at 16.2 mm were combined in the () plane, yielding a point-source flux of mJy. The source was subsequently also detected at 7 mm with a point-source flux of mJy, and the source was not detected at 3 mm, down to a 3 upper limit of 3.3 mJy. This implies a rather shallow mm slope (), possibly indicating a large contribution from, e.g., free-free emission at 16 and maybe also 7 mm.
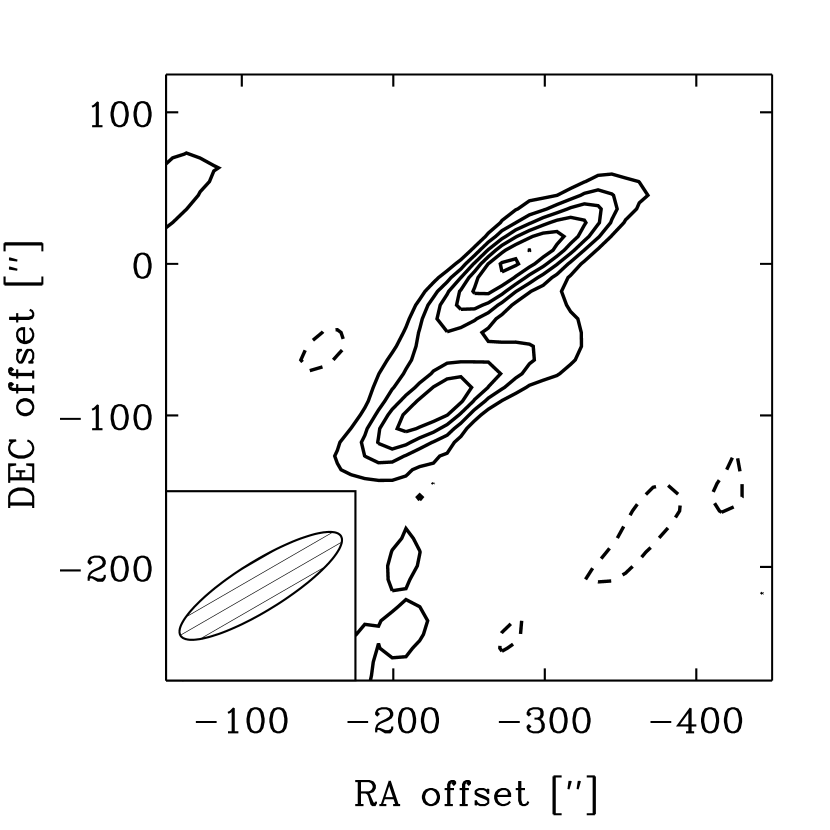
In addition, two large lobe-like features were detected about to the west of WW Cha at both 3.5 and 6.3 cm. These as yet unidentified radio sources are clearly seen in the 6 cm data, as shown in Fig. 5, which presents the combined 6.3 cm data from 18 October 2006 and 9 June 2007. The positions of the sources are 11:08:43, -76:34:58 (J2000) (northern source) and 11:08:56, -76:36:24 (J2000) (southern source). The sources show up in both epochs at which WW Cha was observed at 6.3 cm, but they were not both positively detected at 3.5 cm in each epoch (see Table 4). Using the results from point-source fits in the () plane, spectral slopes between 3.5 and 6.3 cm of and are found for the northern source and of and for the southern source, for 18 October 2006 and 9 June 2007 respectively. Recall that is defined as , and a negative value implies a flux that increases towards longer wavelengths. Such steeply rising negative spectra are generally attributed to non-thermal emission. Neither of the two sources were detected at 16 mm. The sources may be background radio galaxies, though their fluxes are lower than the limiting magnitude of the 6 cm Parkes-MIT-NRAO radio continuum survey.
| Obs. date | Wavelength | Fluxa | RMSb | Beam sizec | |
| (cm) | (mJy) | (mJy/beam) | (arcsec) | ||
| (northern) | (southern) | ||||
| 18 October 2006 | 3.47 | 0.09 | |||
| 9 June 2007 | 3.47 | 0.29 | 0.08 | ||
| 18 October 2006 | 6.25 | 1.34 | 1.29 | 0.16 | |
| 9 June 2007 | 6.25 | 1.71 | 0.99 | 0.14 | |
-
a
Continuum fluxes from point-source fits in the () plane. 3 upper limits are quoted in the case of non-detections.
-
b
RMS calculated from the cleaned image.
-
c
Restored beam, using natural weighting.
3.2 RU Lup
Table 5 summarises the fluxes of RU Lup on the different dates at the various wavelengths.
| Obs. date | Wavelength | Fluxa | RMSa | Beam sizeb |
|---|---|---|---|---|
| (mm) | (mJy) | (mJy/beam) | (arcsec) | |
| ATCA 7 mm band | ||||
| 6 October 2007 | 7.0 | |||
| 6 October 2007 | 7.3 | |||
| ATCA 12 mm band | ||||
| 11 October 2006 | 16.1 | |||
| 11 October 2006 | 16.2 | |||
| 24 October 2007 | 15.4 | |||
| 24 October 2007 | 16.2 | |||
| 4 November 2007 | 15.4 | |||
| 4 November 2007 | 16.2 | |||
| ATCA 3 cm band | ||||
| 12 October 2006 | 34.7 | |||
| 13 October 2006 | 34.7 | |||
| 9 June 2007 | 34.7 | |||
| 4 November 2007 | 34.7 | |||
| ATCA 6 cm band | ||||
| 12 October 2006 | 62.5 | |||
| 13 October 2006 | 62.5 | |||
| 9 June 2007 | 62.5 | |||
| 4 November 2007 | 62.5 | |||
-
a
Continuum fluxes are from point-source fits in the () plane, where 3 upper limits are quoted in the case of non-detections. RMS calculated from the cleaned image.
-
b
Restored beam, using natural weighting. Note that the exact beam size depends on frequency and location of the source in the sky, as well as on the time of the observations, over which time range the data were taken, and exactly which data/baselines were included.
The source RU Lup was observed at 3.3 mm with the ATCA on 24 August 2005 and reported to have a point-source flux of 12.7 mJy (Lommen et al., 2007). RU Lup was observed at 7 mm only once and clearly detected (see Fig. 6). Point-source fluxes of mJy at 7.0 mm and of mJy at 7.3 mm were obtained. Though these values are consistent with each other, both wavelengths will be treated separately again, for consistency.
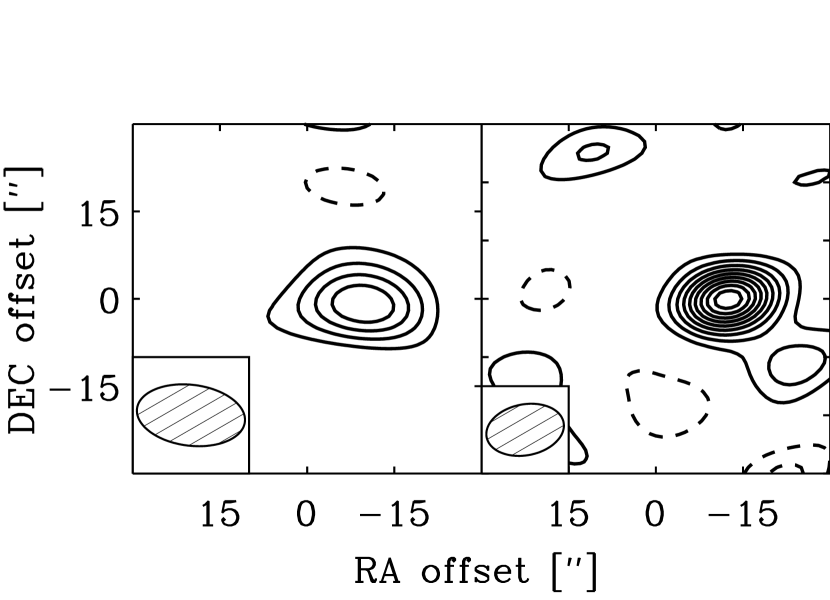
Three sets of observations were made of RU Lup at 16 mm. It was detected on 11 October 2006 (see Fig. 6), with point-source fluxes of and mJy at 16.1 and 16.2 mm respectively. It was not detected on 24 October 2007, with 3 upper limits of and mJy at 15.4 and 16.2 mm. A flux of at 16.2 mm was detected on 4 November 2007, and a 3 upper limit of mJy at 15.4 mm, implying that the flux of RU Lup dropped by at least a factor of six over the course of a year. The data were checked for polarisation on 11 October 2007, when the emission was strongest. However, the emission was found to be unpolarised down to the noise level of our observations.
At 3.5 and 6.3 cm, RU Lup was observed on four different occasions (see Table 5). It was detected in most data sets, but the flux varied by up to a factor of two over the course of a year. Thus, RU Lup was detected at wavelengths ranging from 3.3 mm to 6.3 cm, with variable emission at 16 mm and longer wavelengths. The SED is given in Fig. 7.

3.3 CS Cha
Table 6 summarises the 7 mm fluxes of CS Cha on the different dates. CS Cha was previously observed at 3.3 mm with the ATCA on 26 August 2005 and detected with a point-source flux of 5.9 mJy (Lommen et al., 2007). The phases on 30 June 2008 were so unstable that the data could not be used in the analysis. The source was detected once at 7.3 mm, twice at 7.0 mm, and upper limits were determined at 6.7 mm. No proper map could be extracted from the data, in the case of 26 April 2008 because most of the baselines had to be flagged as bad and no closure could be reached, and in the case of 6 July 2008 because of the very elongated beam due to the short observing time. The analysis was done in the () plane, and a point-source flux of mJy was found at 7.3 mm on 26 April 2008. An average 7.0 mm point-source flux of mJy (arithmetic mean of the fluxes and quadratic mean of the uncertainties) was determined from the two detections. None of the 7 mm-band detections were resolved. The SED of CS Cha is shown in Fig. 8.
| Obs. date | Wavelength | Fluxa | RMSa | Beam sizeb |
|---|---|---|---|---|
| (mm) | (mJy) | (mJy/beam) | (arcsec) | |
| 26 April 2008 | 7.0 | 0.129 | ||
| 26 April 2008 | 7.3 | 0.114 | ||
| 5 July 2008 | 6.7 | 0.273 | ||
| 5 July 2008 | 7.0 | 0.238 | ||
| 6 July 2008 | 6.7 | 0.371 | ||
| 6 July 2008 | 7.0 | 0.218 |
-
a
Continuum fluxes are from point-source fits in the () plane, where 3 upper limits are quoted in the case of non-detections. RMS calculated from the cleaned image. CS Cha is located at 11:02:25.1, -77:33:35.95 (J2000).
-
b
Restored beam, using natural weighting. Note that the exact beam size depends on frequency and location of the source in the sky, as well as on the time of the observations, over which time range the data were taken, and exactly which data/baselines were included.

4 Discussion and interpretation
The YSOs WW Cha, RU Lup, and CS Cha were observed at 7 mm using the ATCA. WW Cha and RU Lup were furthermore observed at 16 mm, 3.5 cm, and 6.3 cm. In this Section we discuss the implications of our observations and in particular we try to determine the source of the emission at cm wavelengths.
4.1 WW Cha
The SED of WW Cha (Fig. 4) shows a break in slope at 16 mm. This suggests that the 16 mm flux is a continuation of the mm flux, implying that the emission up to that wavelength comes from thermal dust emission. The stability of the 16 mm flux over time scales of days, months and years (see Fig. 3) supports the hypothesis that it is due to thermal emission from large, cool dust grains, and makes it unlikely that it is due to stellar magnetic activity, which is known to show variations up to an order of magnitude or more over timescales varying from months to years (e.g. Kutner et al., 1986; Chiang et al., 1996).
4.1.1 Disk emission
If the mm emission (from 3 to 16 mm) is due to dust, we should be able to resolve the emission (on the scale of the disk). To determine whether the source is resolved at any of these wavelengths, the method of Lommen et al. (2007) was followed. A circular Gaussian was fitted in the () plane and if the Gaussian fitted flux is at least 2 larger than the flux from a point-source fit, the source is concluded to be resolved at that wavelength. Using this definition, the 7 mm emission was found to be resolved on 31 March 2008 and the 16 mm emission was resolved on 2 November 2007 when WW Cha was observed with the 1.5A array configuration. Note that these two dates have the lowest RMS in their respective wave bands, as well as the smallest beam sizes. For details, see Table 7 (and note that the 2 November 2007 data include antenna 6). Fitting a circular Gaussian in the () plane to the emission of WW Cha at 3 mm gives a flux of 33.1 mJy (Lommen et al., 2007) and yields a size of arcsec, corresponding to a physical (disk) size of AU at a distance of 160 pc (Whittet et al., 1997). A circular Gaussian fitted to the 7.0 mm emission in the () plane gives a Gaussian flux of mJy and a corresponding source size of arcsec, consistent with the size at 3 mm. Similarly, for the 15.4 mm emission a Gaussian flux of mJy and a corresponding source size of arcsec are obtained, which is consistent with both the 3 and 7 mm sizes. See Table 7 for full details.
| Obs. date | Wavelength | Flux (p)a | Flux (G)a | RMSb | Gaussian size | Beam sizec | Dust opacityd | Disk masse |
|---|---|---|---|---|---|---|---|---|
| (mm) | (mJy) | (mJy) | (mJy/beam) | (arcsec) | (arcsec) | (cm2 g-1) | (M⊙) | |
| 24-28 August 2005f | 3.3 | 2.86 | 0.024 | |||||
| 31 March 2008 | 7.0 | 1.94 | 0.027 | |||||
| 31 March 2008 | 7.3 | 1.90 | 0.033 | |||||
| 2 November 2007 | 15.4 | 1.29 | 0.055 | |||||
| 2 November 2007 | 16.2 | 1.26 | 0.045 |
-
a
Continuum fluxes are from point-source (p) and circular Gaussian (G) fits in the () plane.
-
b
RMS calculated from the cleaned image.
-
c
Restored beam, using natural weighting.
-
d
Using the opacity law of Beckwith et al. (1990) = 10 ( Hz)β, with .
-
e
Assuming a gas-to-dust ratio of 100.
-
f
From Lommen et al. (2007).
The peak brightness temperature of the emission is given by
| (2) |
where is Boltzmann’s constant and the area of the emitting source. The 16.2 mm flux of mJy, (see Table 7, but now including a 15% uncertainty from the absolute flux calibration), implies a brightness temperature K. The low brightness temperature rules out that the emission is thermal free-free from an ionised gas (e.g. Morgan et al., 1990; Snell & Bally, 1986), unless (a) the emission has very low optical depth, or (b) it has a very low filling factor within the apparently resolved region (or a combination of these). Finally, a fit to the SED of WW Cha (Fig. 4) from 1.3 to 16.2 mm gives . Given the stability of the 16 mm flux, the resolved size of the emission, the low peak brightness temperature, and the slope of the SED, we conclude that the emission at 16 mm is thermal emission from large grains or small “pebbles”.
From our previous 3.3 mm observations, Lommen et al. (2007) determined the disk mass for WW Cha as 0.077 M⊙. However, this mass determination assumed a dust opacity at 3.3 mm of cm2 g-1. Given the shallow slope of the SED in the mm regime for WW Cha, this value appears to be rather small. Indeed, if we take the mm slope and assume that the contribution of optically-thick emission is negligible at these wavelengths, we find . Using the opacity law of Beckwith et al. (1990)222Note that Beckwith et al. (1990) estimate Hz cm2 g-1, where is the opacity index for the gas and the dust combined, i.e., with an implied gas-to-dust ratio. Our values for , however, are for the dust alone, and hence we have to account for the gas-to-dust ratio explicitly in the calculation of the disk mass., cm2 g-1, this yields a dust opacity at 3.3 mm of cm2 g-1 and consequently a disk mass of M⊙, where we use
| (3) |
with the gas-to-dust ratio (taken to be 100), the distance to the source, the dust opacity, and the brightness at the frequency for a dust temperature (taken to be 25 K), as given by the Planck function. Disk masses in the range of 0.024 to 0.055 M⊙ are found for our observations out to 16 mm using this opacity law (see Table 7). The spread in disk masses can in part be explained by the uncertainty in the values of the fluxes, and is also an indication that the opacity law is not entirely applicable to the case at hand. However, a disk mass of 0.03 M⊙ for the system is probably accurate to within a factor of a few. Taking into account the contribution of optically-thick emission, i.e., in Eq. 1 (Lommen et al., 2007), does not significantly change the results, giving disk masses in the range of 0.03 to 0.07 M⊙. A more detailed determination of the disk mass requires radiative-transfer modelling of the system, including the full SED and available spatial information. For this, we refer the reader to an up coming paper (Ménard, et al., in prep.).
4.1.2 Emission at longer wavelengths
The slope of the 3.5 to 6.3 cm part of the SED gives , which suggests that the emission is thermal, perhaps from an optically-thick, ionised wind (Panagia & Felli, 1975; Wright & Barlow, 1975; Olnon, 1975). However, at 3.5 cm WW Cha appears to change in flux by a factor of three between the two epochs at which it was observed (18 October 2006 and 9 June 2007). This amount of variability makes optically-thick wind emission an unlikely source for the cm emission. Indeed it is difficult to determine a spectral index in the cm, as the 3.5 cm flux clearly varies and only upper limits were obtained at 6.3 cm. Smith et al. (2003) found that for T Tau the cm spectral index can be positive even for non-thermal emission. They attribute the highly variable emission at 3.5 cm, along with a high level of polarisation and a very compact emission region, to an origin in a magnetically-dominated region close to the star. However, this is unlikely to be the cause of the emission at 3.5 cm for WW Cha, which we found to be unpolarised down to the noise level of our observations. Without information about the size of the emitting region, it is difficult to determine the nature of the cm emission in WW Cha. Follow-up observations should include very-long-baseline-array observations, which would resolve the system down to scales of several stellar radii, such as has been done for, e.g., the double binary T Tau (Smith et al., 2003) and for the binary system V773 Tauri A (Massi et al., 2008). We can conclude, however, that the emission at cm wavelengths is not dominated by thermal emission from large, cm-sized grains.
4.2 RU Lup
RU Lup was detected at 3.3, 7.0, and 7.3 mm. It was also detected at longer wavelengths, although not every time the source was observed. The SED shows a break around 16 mm (Fig. 7), indicating that the dominating emission mechnism changes, as was also observed for WW Cha.
4.2.1 Disk emission
Lommen et al. (2007) found the RU Lup to be resolved at 1.4 and 3.3 mm, with sizes of and respectively, and a (sub)mm slope from 450 m through 3.3 mm, indicating that the mm emission is due to grains of at least mm sizes. Adding the data points at 7.0 and 7.3 mm to the SED of RU Lup (see Fig. 7), a slope of from 450 m through 7.3 mm is found, indicating that the emission at 7 mm is still due to dust. Fitting a circular Gaussian in the () plane gives a Gaussian flux of and mJy at 7.0 and 7.3 mm respectively. This suggests that the 7.3 mm data are resolved (since ) with a Gaussian size of , which is about 1300 AU at 140 pc. This is quite large, suggesting an extended envelope rather than a disk. This Gaussian size gives a very low peak brightness temperature ( K). However, the evidence for extended emission is borderline, with the 7.0 mm flux failing our “resolved” test and the 7.3 mm emission only just meeting this criterion.
Lommen et al. (2007) estimated the disk in the system to be 0.032 M⊙ in mass, assuming an opacity at 3.3 mm of 0.9 cm2 g-1. Again neglecting the contribution from optically-thick emission, an opacity index is found. Using the opacity law of Beckwith et al. (1990), this implies an opacity of 3.30, 2.35, and 2.30 cm2 g-1 at 3.3, 7.0, and 7.3 mm, respectively. This in turn yields a disk mass of 0.010, 0.006, and 0.010 M⊙ for the different wavelengths, where the spread is most likely dominated by the uncertainty in the fluxes. Again, we refer the reader to an upcoming paper (Ménard, et al., in prep.) for a more detailed calculation of the disk mass.
4.2.2 Emission at longer wavelengths
RU Lup was detected twice at 16 mm, with a upper limit found from a third observation. The fluxes from the three different data sets are inconsistent with each other (see Fig. 3), ruling out thermal emission from large grains at these wavelengths. The centimetre slope of the SED from 3.5 to 6.3 cm is (taken from the detections on 13 October 2006), which, in contrast to WW Cha, implies non-thermal emission from optically thin gyrosynchrotron emission (Anglada et al., 1998; Forbrich et al., 2006), though the variability of the emission makes it difficult to fit one consistent slope to the data. The 16 mm flux is surprisingly high (see Fig. 7) and appears to result from more than just thermal emission from dust grains. One possible explanation for the excess 16 mm flux and its variability is that some of the emission comes from a cyclotron maser (Dulk, 1985). The data from 11 October 2006, when the 16 mm flux was highest, have negligible Stokes , , and fluxes and hence the emission was unpolarised. Furthermore, maser cyclotrons are expected to produce emission at and around the cyclotron frequency alone. This could result in the emission only being significantly stronger in one of the two sidebands, which is not observed. The lack of polarisation and strongly coherent emission seems to suggest that the emission is not due to a cyclotron maser. However, the overall frequency range of maser emission from a source could be larger than just directly around the cyclotron frequency, and the intrinsic polarisation is likely to be destroyed by Faraday rotation in the overlying plasma (Dulk, 1985). Therefore, cyclotron maser emission cannot be fully ruled out. Information on different, even shorter timescales of the radio emission may shed additional light on the processes at play, and the increased sensitivity of the ATCA with the recent addition of the Compact Array Broadband Backend can be a useful tool in this. Unfortunately, RU Lup was never observed at 16 mm, 3.5 cm and 6.3 cm on the same day and we know that the 3.5 cm varies by a factor of two within 24 hours. It seems likely that there are three different emission mechanisms – diskstarwind – acting over these three cm wavelength bands. This is different from WW Cha, where dust emission dominates up to 16 mm. To determine of the emission mechanism at longer wavelengths requires the source to be resolved, which needs very-long-baseline-interferometer observations.
4.3 CS Cha
During the three months that over which CS Cha was observed, the 7 mm emission was relatively stable and a mm slope from 1.3 to 7.3 mm was found. This is consistent with the SED slope found by Lommen et al. (2007) from 1.3 to 3.3 mm (). Since neither the 3 or 7 mm emission was resolved, it cannot be ruled out that the mm emission is optically thick. However, if we assume the emission to be completely optically thin, implies a dust opacity index . This would suggest that the 7 mm emission from CS Cha is also predominantly due to thermal dust emission from mm-sized grains.
The disk mass was estimated by Lommen et al. (2007) to be 0.021 M⊙. Taking the opacity law of Beckwith et al. (1990) and an opacity index , a mass of 0.016, 0.018, 0.016 M⊙ is found at the different wavelengths, which is consistent with the value of Lommen et al. (2007) given the uncertainties in the fluxes. Espaillat et al. (2007) found a disk mass of 0.04 M⊙ through more detailed modelling, slightly larger than the value found with a simple opacity law.
4.4 Large grains in protoplanetary disks
The mm slopes of WW Cha, RU Lup and CS Cha are given by , and respectively. This suggests that all three sources have grains of at least mm sizes, although it should be noted that the 7 mm emission of CS Cha was not resolved, and hence the emission could be optically thick. This suggests that grains grow from sub-micron sizes to at least mm sizes throughout the bulk of the disk within a few hundred thousand years. To date only one T Tauri star has been found with large, cm-sized grains – TW Hya. This was the only other source that has been monitored at cm wavelengths for long periods of time and was found to have stable thermal dust emission at 3.5 cm. But is TW Hya unique? Our new 16 mm results show that the disk of WW Cha also contains cm-sized grains (and we have similar results for the Herbig Ae star HD 100546; Wright et al. – in preparation). Furthermore, about 10% of the 16 mm emission from RU Lup is likely to derive from pebbles as well, so it would appear that cm-sized grains in protoplanetary disks are not as rare as might have been expected.
It has been a long-standing problem in planet formation theory that boulders of about a metre in size fall into the central star before accumulating and growing to kilometre-sized planetesimals (Weidenschilling, 1977). Recent numerical simulations have shown that this so-called ”metre-size barrier” can be overcome. For example, Johansen et al. (2007) find that grain growth via gravitational collapse can be very efficient in the mid-plane of turbulent disks where streaming instabilities help concentrate grains that grow to several 100 km in a few thousand years. Lyra et al. (2008) show that grains trapped in Rossby waves excited at the edge of dead zones can grow to Mars-sized embryos in a few thousand years. Brauer et al. (2008) also find that grains grow rapidly in the near-laminar dead zone of disks and that the associated pressure maxima near evaporation fronts ensure that the newly formed boulders to not migrate radially. These simulations all start with grains that are already at least cm-sized. Our results demonstrate that this is reasonable, and that with seeds of this size the metre-sized barrier can be overcome to produce fully-fledged protoplanets.
Ideally one would like to know the timescales of grain growth and so may be tempted to try to find an evolutionary sequence of grain size with age. For example, RU Lup and WW Cha are both about 0.5 Myr and show grain sizes up to about a cm, while TW Hya is 9 Myr and shows grains up to 3.5 cm. However, it should be noted that ages of T Tauri stars are notoriously difficult to determine, but more importantly, the data tell us that other, possibly different, emission mechanisms are stronger for WW Cha and RU Lup than for TW Hya – which may be age-related. Clearly, a much larger sample is needed to draw any significant conclusions regarding grain growth up to pebble or even boulder sizes.
5 Conclusions
We have been monitoring the mm and cm emission of two T Tauri stars, WW Cha and RU Lup, over the course of several years with the ATCA, and more recently performed 7 mm observations of the third young T Tauri star CS Cha. We find that emission up to 7 mm for all three sources is well explained by thermal dust emission from mm-sized grains. The stability of the 16 mm flux in WW Cha, along with the low peak brightness temperature at this wavelength, indicates that this emission is dominated by even larger, cm-size “pebbles”, making it the second protoplanetary disk known to contain such large grains. The 16 mm emission of RU Lup may also include dust emission from pebbles, but other emission mechanisms appear to dominate at this wavelength.
This work underlines the necessity to observe young stellar objects at multiple wavelengths and to monitor them over extended periods of time, in order to disentangle the various candidate emission mechanisms at mm and cm wavelengths. The ATCA is well suited to do this and with the upgrade of the correlator that is currently underway, increasing the bandwidth of the telescope by a factor of 16, extended surveys of southern protoplanetary disks will soon be within reach. This will allow us to put more stringent constraints on the processes involved in the first steps of planet formation, telling us where and when they take place.
Acknowledgements.
DL acknowledges Swinburne University and UNSW@ADFA for their hospitality. This work was partially supported by a Netherlands Research School For Astronomy network 2 grant and a Netherlands Organisation for Scientific Research Spinoza grant (DL and EFvD), a Swinburne Researcher Development Scheme, a Swinburne Special Studies Program, and the Programme National de Physique Stellaire (PNPS), INSU/CNRS (STM), and by an ARC Australian Research Fellowship (CMW). We would like to thank the ATNF staff at Narrabri for their hospitality and assistance, and Annie Hughes and Steve Longmore for assisting with some of the observations. We also thank François Ménard for useful discussions, and we are indepted to the anonymous referee, whose comments helped to considerably improve this paper. This research has made use of the SIMBAD database, operated at CDS, Strasbourg, France.References
- Alonso-Albi et al. (2008) Alonso-Albi, T., Fuente, A., Bachiller, R., et al. 2008, ApJ, 680, 1289
- André et al. (1988) André, P., Montmerle, T., Feigelson, E. D., Stine, P. C., & Klein, K.-L. 1988, ApJ, 335, 940
- Andrews & Williams (2007) Andrews, S. M. & Williams, J. P. 2007, ApJ, 659, 705
- Anglada et al. (1998) Anglada, G., Villuendas, E., Estalella, R., et al. 1998, AJ, 116, 2953
- Bally et al. (2006) Bally, J., Walawender, J., Luhman, K. L., & Fazio, G. 2006, AJ, 132, 1923
- Beckwith & Sargent (1991) Beckwith, S. V. W. & Sargent, A. I. 1991, ApJ, 381, 250
- Beckwith et al. (1990) Beckwith, S. V. W., Sargent, A. I., Chini, R. S., & Guesten, R. 1990, AJ, 99, 924
- Brauer et al. (2008) Brauer, F., Henning, T., & Dullemond, C. P. 2008, A&A, 487, L1
- Carpenter et al. (2005) Carpenter, J. M., Wolf, S., Schreyer, K., Launhardt, R., & Henning, T. 2005, AJ, 129, 1049
- Chiang et al. (1996) Chiang, E., Phillips, R. B., & Lonsdale, C. J. 1996, AJ, 111, 355
- Draine (2006) Draine, B. T. 2006, ApJ, 636, 1114
- Dulk (1985) Dulk, G. A. 1985, ARA&A, 23, 169
- Espaillat et al. (2007) Espaillat, C., Calvet, N., D’Alessio, P., et al. 2007, ApJ, 664, L111
- Forbrich et al. (2007) Forbrich, J., Massi, M., Ros, E., Brunthaler, A., & Menten, K. M. 2007, A&A, 469, 985
- Forbrich et al. (2006) Forbrich, J., Preibisch, T., & Menten, K. M. 2006, A&A, 446, 155
- Gauvin & Strom (1992) Gauvin, L. S. & Strom, K. M. 1992, ApJ, 385, 217
- Girart et al. (2004) Girart, J. M., Curiel, S., Rodríguez, L. F., et al. 2004, AJ, 127, 2969
- Gómez et al. (2004) Gómez, M., Persi, P., Marenzi, A. R., Roth, M., & Tapia, M. 2004, A&A, 423, 629
- Guenther et al. (2007) Guenther, E. W., Esposito, M., Mundt, R., et al. 2007, A&A, 467, 1147
- Haisch et al. (2001) Haisch, Jr., K. E., Lada, E. A., & Lada, C. J. 2001, ApJ, 553, L153
- Henning et al. (1993) Henning, T., Pfau, W., Zinnecker, H., & Prusti, T. 1993, A&A, 276, 129
- Herczeg et al. (2005) Herczeg, G. J., Walter, F. M., Linsky, J. L., et al. 2005, AJ, 129, 2777
- Hughes et al. (1993) Hughes, J., Hartigan, P., & Clampitt, L. 1993, AJ, 105, 571
- Hughes et al. (1994) Hughes, J., Hartigan, P., Krautter, J., & Kelemen, J. 1994, AJ, 108, 1071
- Johansen et al. (2007) Johansen, A., Oishi, J. S., Low, M.-M. M., et al. 2007, Nature, 448, 1022
- Kessler-Silacci et al. (2006) Kessler-Silacci, J., Augereau, J.-C., Dullemond, C. P., et al. 2006, ApJ, 639, 275
- Kutner et al. (1986) Kutner, M. L., Rydgren, A. E., & Vrba, F. J. 1986, AJ, 92, 895
- Lamzin et al. (1996) Lamzin, S. A., Bisnovatyi-Kogan, G. S., Errico, L., et al. 1996, A&A, 306, 877
- Lawson et al. (1996) Lawson, W. A., Feigelson, E. D., & Huenemoerder, D. P. 1996, MNRAS, 280, 1071
- Lommen et al. (2007) Lommen, D., Wright, C. M., Maddison, S. T., et al. 2007, A&A, 462, 211
- Lyra et al. (2008) Lyra, W., Johansen, A., Klahr, H., & Piskunov, N. 2008, ArXiv e-prints, 807
- Massi et al. (2006) Massi, M., Forbrich, J., Menten, K. M., et al. 2006, A&A, 453, 959
- Massi et al. (2008) Massi, M., Ros, E., Menten, K. M., et al. 2008, A&A, 480, 489
- Meeus et al. (2003) Meeus, G., Sterzik, M., Bouwman, J., & Natta, A. 2003, A&A, 409, L25
- Morgan et al. (1990) Morgan, J. A., Snell, R. L., & Strom, K. M. 1990, ApJ, 362, 274
- Natta et al. (2004) Natta, A., Testi, L., Neri, R., Shepherd, D. S., & Wilner, D. J. 2004, A&A, 416, 179
- Nürnberger et al. (1997) Nürnberger, D., Chini, R., & Zinnecker, H. 1997, A&A, 324, 1036
- Olnon (1975) Olnon, F. M. 1975, A&A, 39, 217
- Panagia & Felli (1975) Panagia, N. & Felli, M. 1975, A&A, 39, 1
- Podio et al. (2007) Podio, L., Garcia, P. J. V., & Bacciotti, F. 2007, Memorie della Societa Astronomica Italiana, 78, 693
- Przygodda et al. (2003) Przygodda, F., van Boekel, R., Àbrahàm, P., et al. 2003, A&A, 412, L43
- Reipurth et al. (1996) Reipurth, B., Nyman, L.-A., & Chini, R. 1996, A&A, 314, 258
- Robrade & Schmitt (2007) Robrade, J. & Schmitt, J. H. M. M. 2007, A&A, 473, 229
- Rodmann et al. (2006) Rodmann, J., Henning, T., Chandler, C. J., Mundy, L. G., & Wilner, D. J. 2006, A&A, 446, 211
- Sault et al. (1995) Sault, R. J., Teuben, P. J., & Wright, M. C. H. 1995, in ASP Conf. Ser. 77: Astronomical Data Analysis Software and Systems IV, 433
- Setiawan et al. (2008) Setiawan, J., Henning, T., Launhardt, R., et al. 2008, Nature, 451, 38
- Smith et al. (2003) Smith, K., Pestalozzi, M., Güdel, M., Conway, J., & Benz, A. O. 2003, A&A, 406, 957
- Snell & Bally (1986) Snell, R. L. & Bally, J. 1986, ApJ, 303, 683
- Stempels & Piskunov (2002) Stempels, H. C. & Piskunov, N. 2002, A&A, 391, 595
- Voshchinnikov & Henning (2008) Voshchinnikov, N. V. & Henning, T. 2008, A&A, 483, L9
- Wang & Henning (2006) Wang, H. & Henning, T. 2006, ApJ, 643, 985
- Weidenschilling (1977) Weidenschilling, S. J. 1977, Ap&SS, 51, 153
- Weintraub et al. (1989) Weintraub, D. A., Sandell, G., & Duncan, W. D. 1989, ApJ, 340, L69
- Whittet et al. (1997) Whittet, D. C. B., Prusti, T., Franco, G. A. P., et al. 1997, A&A, 327, 1194
- Wilner et al. (2005) Wilner, D. J., D’Alessio, P., Calvet, N., Claussen, M. J., & Hartmann, L. 2005, ApJ, 626, L109
- Wright & Barlow (1975) Wright, A. E. & Barlow, M. J. 1975, MNRAS, 170, 41