The isolated neutron star candidate 2XMM J104608.7-594306
Over the last decade, X-ray observations unveiled the existence of several classes of isolated neutron stars (INSs) which are radio-quiet or exhibit radio emission with properties much at variance with those of ordinary radio pulsars. The identification of new sources is crucial in order to understand the relations among the different classes and to compare observational constraints with theoretical expectations. A recent analysis of the 2XMMp catalogue provided less than 30 new thermally emitting INS candidates. Among these, the source 2XMM J104608.7-594306 appears particularly interesting because of the softness of its X-ray spectrum, eV and cm-2 (3 ), and of the present upper limits in the optical, , and (98.76% confidence level), which imply a logarithmic X-ray-to-optical flux ratio , corrected for absorption. We present the X-ray and optical properties of 2XMM J104608.7-594306 and discuss its nature in the light of two possible scenarios invoked to explain the X-ray thermal emission from INSs: the release of residual heat in a cooling neutron star, as in the seven radio-quiet ROSAT-discovered INSs, and accretion from the interstellar medium. We find that the present observational picture of 2XMM J104608.7-594306 is consistent with a distant cooling INS with properties in agreement with the most up-to-date expectations of population synthesis models: it is fainter, hotter and more absorbed than the seven ROSAT sources and possibly located in the Carina Nebula, a region likely to harbour unidentified cooling neutron stars. The accretion scenario, although not entirely ruled out by observations, would require a very slow ( 10 km s-1) INS accreting at the Bondi-Hoyle rate.
Key Words.:
stars: neutron – X-rays: individuals: 2XMM J104608.7-594306 – Catalogs1 Introduction
A major outcome of the ROSAT mission has been the discovery of a group of radio-quiet isolated neutron stars (INSs) with properties clearly at variance from the bulk of the population of rotation-powered pulsars. At present, the group comprises seven objects (whence the nickname “Magnificent Seven”, or M7) sharing similar properties, which include purely thermal X-ray spectra with very soft temperatures (–100 eV) and low absorption column densities ( few cm-2), long spin periods (–10 s), intense magnetic fields (–1014 G), very faint optical counterparts ( when detected, implying X-ray-to-optical flux ratios ) and no associations with supernova remnants or stellar companions (see e.g. Haberl 2007, for a recent review).
For some time, following the pioneering work by Ostriker et al. (1970) and Shvartsman (1971), it was thought that these sources might belong to the long sought population of old INSs powered by accretion of the interstellar medium (ISM), which was expected to be detected by ROSAT (see Treves et al. 2000, for a review). However, the measurement of large proper motions (e.g. Motch et al. 2007, 2008, and references therein) strongly supports the idea that the M7 represent a local population ( pc, Posselt et al. 2007; van Kerkwijk & Kaplan 2007) of middle-aged neutron stars ( 105–106 yr), which give off thermal radiation as they cool down. The similar spin periods and their position on the diagram raised the possibility that they could be related to other populations of INSs – like magnetars, high magnetic field radio pulsars (HBPSRs) and rotating radio transients (RRATs; McLaughlin et al. 2006) – which is an intriguing and still debated issue (e.g. Popov et al. 2006; Kaplan 2008; Keane & Kramer 2008).
| OBSID | Observation Date | Detector | Filter | Counts | Rate | Near Gap? | |||
|---|---|---|---|---|---|---|---|---|---|
| (ks) | (arcmin) | (ks) | (10-2 s-1) | ||||||
| 112580601 | 2000-07-26 | pn | thick | 27.7 | 9.7 | 15.0 | 558 | yes | |
| M1 | thick | 33.2 | 8.7 | 17.8 | 244 | no | |||
| M2 | thick | 30.1 | 9.1 | 15.7 | 198 | yes | |||
| 112580701 | 2000-07-27 | pn | thick | 8.0 | 9.7 | 4.3 | 161 | yes | |
| M1 | thick | 10.9 | 8.7 | 5.9 | 88 | no | |||
| M2 | thick | 7.9 | 9.1 | 4.1 | 41 | yes | |||
| 112560101 | 2001-06-25 | pn | thick | 21.5 | 15.8 | 6.7 | 291 | yes | |
| 112560201 | 2001-06-28 | pn | thick | 20.5 | 15.9 | 6.3 | 200 | yes | |
| 145740101 | 2003-01-25 | M1 | thick | 6.9 | 8.3 | 4.6 | 78 | yes | |
| 145740201 | 2003-01-27 | M1 | thick | 6.9 | 8.3 | 4.6 | 73 | yes | |
| M2 | thick | 6.9 | 8.0 | 4.8 | 69 | yes | |||
| 145740301 | 2003-01-27 | M1 | thick | 6.8 | 8.3 | 4.5 | 59 | yes | |
| M2 | thick | 6.8 | 8.0 | 4.7 | 68 | yes | |||
| 145740501 | 2003-01-29 | M2 | thick | 6.9 | 7.9 | 4.8 | 67 | yes | |
| 160160101 | 2003-06-08 | M1 | thick | 16.5 | 8.5 | 8.8 | 127 | yes | |
| M2 | thick | 15.5 | 8.2 | 8.6 | 114 | no | |||
| 160160901 | 2003-06-13 | M1 | thick | 31.1 | 8.5 | 16.6 | 207 | no | |
| M2 | thick | 31.1 | 8.3 | 17.1 | 217 | no | |||
| 145780101 | 2003-07-22 | M1 | thick | 8.4 | 9.4 | 4.6 | 76 | no | |
| 160560101 | 2003-08-02 | M2 | medium | 11.8 | 9.1 | 6.3 | 121 | no | |
| 160560201 | 2003-08-09 | M1 | thick | 12.2 | 8.6 | 6.8 | 105 | no | |
| M2 | medium | 12.1 | 9.1 | 6.4 | 96 | no | |||
| 160560301 | 2003-08-18 | M1 | thick | 18.5 | 8.6 | 10.8 | 155 | no | |
| M2 | medium | 18.5 | 9.4 | 10.0 | 160 | no | |||
| 206010101 | 2004-12-07 | pn | medium | 19.3 | 17.3 | 5.8 | 366 | no | |
| 311990101 | 2006-01-31 | pn | thick | 24.3 | 7.7 | 15.9 | 837 | no | |
| M2 | thick | 65.3 | 8.2 | 44.2 | 731 | no | |||
| 9488 | 2008-09-05 | ACIS-I | OBF | 60.0 | 6.7 | 57.0 | 567 | no |
Considering that within 1 kpc the M7 appear in comparable numbers as young ( few Myr) radio and -ray pulsars (Popov et al. 2003), they may represent the only identified members of a large, yet undetected, elusive population of radio-quiet and thermally emitting INSs. The discovery of new candidates is then mandatory in order to make any progress towards an understanding of their properties as a population and of their relations with other classes of Galactic INSs.
Despite the relatively small field of view and low sky coverage of the XMM-Newton Observatory111In a near future, eROSITA will become an excellent tool to search for INSs (http://www.mpe.mpg.de/projects.html#erosita)., its large effective area and good positional accuracy at soft X-ray energies make it ideal to look for faint INS candidates. Recently, Pires & Motch (2008) reported on the preliminary results of a programme aimed at identifying new thermally emitting INSs in the 2XMMp catalogue222http://xmmssc-www.star.le.ac.uk/Catalogue/xcat_
public_2XMMp.html. This version of the catalogue, released on July 2006, contains more than 120 thousand sources, covering a total sky area of 285 deg2.
Out of the considered 7.2 EPIC pn sources with count rates above 0.01 s-1, less than 30 good candidates met all the selection criteria – i.e. well detected point-like sources showing soft thermal spectrum ( eV and cm-2), with no optical candidates and no identifications in over 170 astronomical catalogues. The brightest and most promising INS candidate is source 2XMM J104608.7-594306 (hereafter XMM J1046). In this work we discuss the properties of XMM J1046 in connection with the two main options concerning its nature, a cooling or an accreting INS. The description of the selection procedure and the results of follow-up optical observations on a sample of the X-ray brightest INS candidates will be presented elsewhere (Pires et al., in preparation).
2 XMM J1046 in X-rays and the optical
2.1 Observations and data reduction
Thanks to the fact that source XMM J1046 is at an angular distance of only 8.5 arcmin from the well studied binary system Eta Carinae, it was serendipitously observed by the EPIC pn and MOS detectors on board XMM-Newton on many different occasions. As part of an observational campaign to study the star-forming region of the Carina Nebula, XMM J1046 was also serendipitously observed once in a recent Chandra observation (September 2008). Although this X-ray mission has observed Eta Carinae many times, XMM J1046 was not detected before given the smaller field of view of the ACIS instruments relative to the EPIC cameras.
| Absorbed blackbody fit | Constant | ||||||||||
| OBSID | Detector | d.o.f. | Goodness | d.o.f. | Goodness | ||||||
| (1021 cm-2) | (eV) | (erg s-1 cm-2) | (%) | (eV) | (%) | ||||||
| 112580601 | M1 | 19 | 21 | 43.7 | 19 | 20 | 40.6 | ||||
| 112580701 | M1 | 15 | 21 | 11.2 | 15 | 20 | 12.6 | ||||
| 160160101 | M2 | 19 | 13 | 81.6 | 20 | 12 | 87.2 | ||||
| 160160901 | M1 / M2 | 25 | 32 | 13.1 | 25 | 31 | 16.0 | ||||
| 145780101 | M1 | 15 | 24 | 3.6 | 16 | 23 | 4.0 | ||||
| 160560101 | M2 | 34 | 37 | 25.0 | 35 | 36 | 25.7 | ||||
| 160560201 | M1 / M2 | 53 | 42 | 79.5 | 56 | 41 | 88.8 | ||||
| 160560301 | M1 / M2 | 33 | 30 | 44.9 | 37 | 32 | 65.9 | ||||
| 206010101 | pn | 35 | 26 | 86.7 | 35 | 25 | 89.1 | ||||
| 311990101 | pn / M2 | 62 | 65 | 38.1 | 63 | 64 | 43.0 | ||||
| 9488 | ACIS-I | 13 | 20 | 12.9 | 18 | 18 | 37.7 | ||||
We analysed 16 XMM-Newton archival observations, spanning from July 2000 to February 2006, in which XMM J1046 was visible. The event files were processed applying standard procedures with SAS 7.1.2333http://xmm.esac.esa.int/sas. The MOS and pn observations were reduced using emchain and epchain, respectively, applying default corrections. The event lists were filtered for intervals of high background activity as well as to retain the pre-defined patterns corresponding to single, double, triple and quadruple pixel events, for the MOS observations, and single and double pixel events, for the pn observations, as these have the best energy calibration. Source and background events were extracted using circular regions of radii 25 arcsec (centered on the position of the X-ray source) and 50 arcsec, respectively. Background regions were defined on an area free of sources in the same CCD and roughly at the same distance from the readout node as the source region. We restricted our analysis to the 0.15–3 keV energy range. Whenever possible for a given observation, data from all EPIC cameras were analysed simultaneously to better constrain the spectral parameters.
The Chandra observation was analysed using CIAO 4.0.1 and CALDB 3.4.5444http://cxc.harvard.edu/ciao4.0/index.html. We processed the event files with the task acis_process_events, also applying default corrections. Since the observation was taken in VFAINT mode, we cleaned the ACIS background while processing the event file. We checked for the presence of known processing offsets using the aspect calculator tool available on the CIAO web pages. Finally, we selected events corresponding to grades 0, 2, 3, 4 and 6 (in ASCA terminology) and applied the good time intervals, also filtering for periods of background flares. For the spectral analysis, we used the 0.5–3 keV energy band due to the molecular contamination that is degrading the quantum efficiency of the ACIS front-illuminated chips, at energies below 0.5 keV555http://cxc.harvard.edu/proposer/POG. Source and background regions were extracted applying similar criteria as for XMM-Newton data. In Table 1 we list, for every observation, the effective exposure times, off-axis angles, the number of extracted source photons for the spectral analysis and the source count rate, corrected for vignetting, in the given energy bands.
2.2 Spectral analysis
EPIC and Chandra images do not reveal any particular background enhancement close to the X-ray source. However, the Chandra data, which benefit from a lower instrumental background, do show some weak diffuse extended emission (a filamentary structure roughly consistent with some large-scale nebulosity seen in the optical666ESO MAMA-R digitized plate. This filament is not in the field of view of our ESO/SOAR images.). The brightest part is located 5 to 7 arcmin south-east of the X-ray source. This filament is not detected on the XMM-Newton images, although it is marginally in the field of view of the EPIC cameras. None of the background regions used in the spectral analysis overlaps with this diffuse X-ray emission. Therefore, it is expected that the noise for the EPIC data is dominated by the (position independent) instrumental background. The noticeable vignetting and spreading of the PSF prevailing at the large off-axis angles where the source stands in many XMM-Newton observations both contribute to the difficulty in measuring the spectrum of XMM J1046 in these cases.
Spectra were binned requiring a different minimum number of counts per energy bin, depending on the total number of source counts. Spectra extracted from the shortest exposures have at least 5 counts per bin. Using XSPEC 12.4777http://heasarc.gsfc.nasa.gov/docs/xanadu/xspec, we tested different models (blackbody, power law, bremsstrahlung, Raymond-Smith, …), allowing the fit parameters to vary freely. Due to the low number of counts, we applied the maximum likelihood statistic (Cash 1979) in order to derive the best fit parameters and their uncertainties. The quality of each fit (“goodness”) is estimated by means of Monte Carlo simulated spectra, drawn from the best fit model, and the distribution of corresponding fit statistics. If most ( 50%) of the simulated spectra has a smaller fit statistic than the current model, then it is unlikely that the observed data were drawn from the model.
The spectrum of XMM J1046 is always best fitted by a single absorbed soft blackbody; other models (in particular, power law, optically thin thermal plasmas and magnetized neutron star atmospheres) invariably result in worse fits and there is no evidence for an additional (hard) component. In general, the X-ray emission of radio pulsars results from the sum of thermal and non-thermal components (see e.g. Kaspi et al. 2004, for a review). A power law component usually dominates the X-ray emission of young pulsars (age 105 yr) while old pulsars (age few Myr) exhibit a weak thermal component, probably originating from small heated polar caps, in addition to a dominating power law. On the other hand, the X-ray emission of the middle-aged pulsars (age few yr) known as “Three Musketeers” is clearly dominated by soft blackbody components superposed on a high energy tail with photon indexes 1.7–2.1 (e.g. De Luca et al. 2005). The addition of a power law component with similar photon indexes to the blackbody model does not improve the fit of XMM J1046. Any power law component contributes at most 4% (3 confidence level, 0.5–10 keV range) to the source luminosity. Therefore, a power law flux as low, relative to the thermal component, as that of the Three Musketeers (0.3–1.7 %) would not be detectable in XMM J1046 with the available data and can not be presently excluded. However, an X-ray spectrum dominated by a non-thermal component is clearly ruled out.
The M7 show rather stable spectral and timing properties. In particular, the X-ray brightest source RX J1856.5-3754 shows very constant flux and spectral properties over several years. Its X-ray spectrum is remarkably well reproduced by a blackbody with no significant deviations (e.g. Burwitz et al. 2003). On the other hand, the second brightest source RX J0720.4-3125 is the only one among the M7 that has been shown to undergo long-term variations in its spectral parameters, at more or less constant flux. This behaviour is either possibly cyclic and related to the star precession (Haberl et al. 2006; Hohle et al. 2008, and references therein) or impulsive, being interpreted as a sudden change on the neutron star surface accompanied with a simultaneous torque, caused by an accretion or glitch episode (van Kerkwijk et al. 2007).
Considering the 16 XMM-Newton observations, single absorbed blackbodies have temperatures and column densities888The errors on reported in Pires & Motch (2008, Table 2) should be multiplied by a factor 10. ranging from to eV and from to cm-2; errors are 1. In some cases, the small number of counts prevents a well constrained fit. In order to check the significance of the variations of the spectral parameters of XMM J1046, we performed a test on the 16 XMM-Newton observations, assuming that they do not change in time and have values equal to their respective weighted means eV and cm-2 (hereafter, reported errors on the weighted means are 3 , unless otherwise noted). We found that and are consistent with being the same in all observations at an acceptable but low confidence level for the temperature ( and for 15 degrees of freedom, respectively; the probabilities of getting a larger are 4% and 19%). However, we note that among the data sets with the largest values of there are some observations for which the source elongated point spread function (PSF) overlaps the CCD gaps of the EPIC instruments. The correction for the missing part of the energy-dependent PSF might not be well calibrated, in particular at large off-axis angles (XMM J1046 is located at 9 arcmin, on average, but its off-axis angle can be as large as 15 arcmin, see Table 1). This would require the inclusion of an additional systematic error which would have the effect of lowering the values. On the other hand, if we only consider the 10 observations for which the source is not located close to a gap999Observations flagged with “no” in Table 1., we find that the temperature and column density are steady over the six-year time interval at rather high confidence levels: eV (23%) and cm-2 (44%), see Table 2.
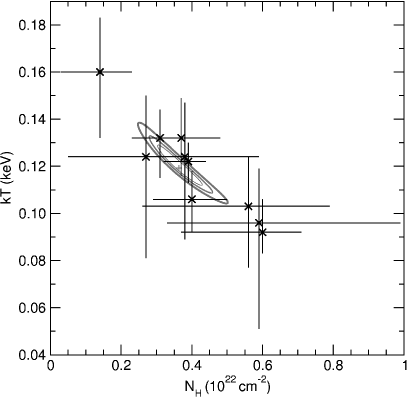
Alternatively, if the column density is held constant to the mean value cm-2, the computed range in is narrower, 111–132 eV, and the parameters are better constrained (1 errors correspond to 5% of the best values against 20% when is free to vary, see Table 2 for the individual fits). In this case, the variations in are statistically significant (99.26%). We note, however, that the sample of analysed observations is highly heterogeneous and thus subjected to systematic uncertainties. In particular, the different observing conditions – distance to the optical axis, observing modes and cameras – as well as calibration uncertainties at energies below 0.5 keV especially for the MOS cameras101010http://xmm2.esac.esa.int/docs/documents/CAL-TN-
0018.pdf, do not allow one to draw definite conclusions on the source intrinsic spectral variability. Hereafter, we adopt the weighted mean blackbody temperature and column density of the 10 best XMM-Newton observations for the purpose of further discussion on the source properties. In Fig. 1 the individual best fits are plotted together with the contours obtained fitting all data with one single blackbody model.
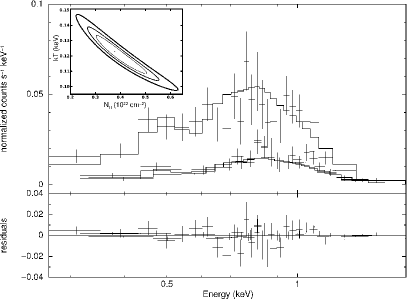
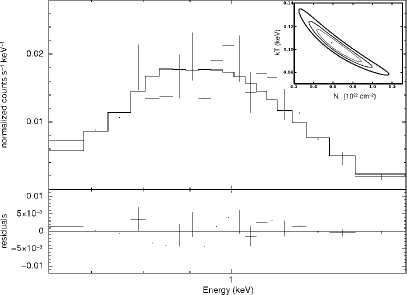
A slightly more absorbed blackbody fit is found for the Chandra observation (Table 2). We note, however, that the response of the front-illuminated ACIS chips is not best suited to derive the spectral parameters of a source as soft as XMM J1046. This, and the fact that only photons with energies above 0.5 keV were considered, act together to cast some doubts on the column density derived in the blackbody fit. In Fig. 2 we show the spectral fits of the two data sets with the best signal-to-noise ratio among the analysed data.
The weighted mean of the 0.15–3 keV observed flux is erg s-1 cm-2, considering the 16 XMM-Newton observations; the computed range is to erg s-1 cm-2 (1 ). Although a constant flux is not statistically acceptable ( for 15 degrees of freedom), a long term variability is excluded once the fluxes in the EPIC cameras are considered separately: the averaged flux in the pn camera is systematically fainter than that measured in the MOS cameras but both are consistent with a constant flux (at confidence levels of 19% and 92%, respectively). The same 13–20 % discrepancy between the two instruments is seen in the three observations where both cameras were simultaneously on.
According to recent cross-calibration studies111111S. Mateos talk in the XMM-Newton Survey Science Center consortium meeting 2008, http://xmm.esac.esa.int/external/xmm_
data_analysis/ssc_meeting/agenda.php, the MOS cameras register 7–9 % higher flux than pn below 4.5 keV121212The discrepancy between the cameras is even larger (of 12–13%) at higher energies, according to the work just cited. and this excess increases with off-axis angle. The larger discrepancy can thus be explained by the large off-axis angle of XMM J1046 in the set of analysed observations.
The probabilities that temperature and column density are constant also increase when the cameras are considered individually (a consequence of the larger errors), but there is no systematic relation as for the flux (i.e. the weighted mean values are roughly the same).
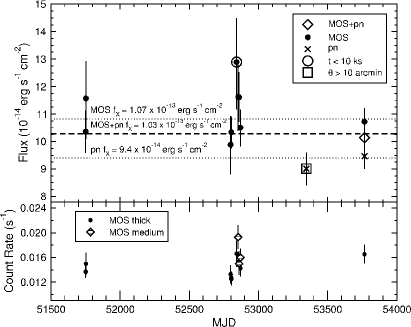
Once again, accounting only for the set of 10 observations not close to a gap, the overall picture further argues against significant flux variations: the MOS and pn fluxes can be considered to be constant either when the cameras are analysed together or separately (Fig. 3). The weighted means and respective confidence levels for the two cameras are erg s-1 cm-2 (44%) and erg s-1 cm-2 (78%). Despite of the discrepancy between the two instruments, the fluxes are compatible within errors. We adopt here the mean value of the flux as measured by the two cameras, which is also consistent with the value inferred when the cameras are analysed together erg s-1 cm-2. A direct comparison of the source count rate, corrected for vignetting, for the MOS cameras, is also shown in Fig. 3.
2.3 Timing analysis
One of the most intriguing and discernible features of the M7 is that, when compared to radio pulsars, the neutron star spin periods are longer and distributed in a much narrower range. Six of the sources show sinusoidal X-ray pulsations with pulsed fractions between 1% and 18%. The detection of pulsations in the X-ray emission of source XMM J1046 would represent further evidence to unveil its nature. However, despite of the large number of archival observations that detected the source, only one (OBSID 311990101, pn) is really suitable to conduct timing analysis – the others being either too short and having few source counts or, for the MOS observations, taken in full frame mode which has a too poor frame resolution (2.6 s) for timing purposes. Similarly, the Chandra data was carried out with a 3.4 s time resolution imaging configuration.
With the aim to search for pulsations, we converted the photon arrival times of the pn observation from the local satellite to the solar system barycentric frame using the SAS task barycen. Source photons were extracted in a smaller elliptical region (relative to the extracted region for the spectral analysis) in order to avoid background events. For the same reason and, since XMM J1046 does not show counts above 1.5 keV, we only considered the 0.15–2 keV energy range. We next searched for pulsations using a (Rayleigh) test (Buccheri et al. 1983). No pulsations are found to a non-constraining 30% upper limit (3 ), in the 0.073–100 s period range; the dimness of the source would require a longer exposure in order to significantly constrain the upper limit on pulsations.
2.4 Optical follow-up
Follow-up optical observations performed in the B and R bands at the ESO Very Large Telescope (VLT) in February 2007 revealed no counterpart within 4.3 arcsec ( 5 ) from the position of XMM J1046, ::, ::, as derived running the SAS task emldetect on the best XMM-Newton observation 311990101. The 90% confidence level error circle on the position, arcsec, is given by , where is the nominal error as given by emldetect and is the systematic error on the detection position as provided by the 2XMMp catalogue, based on reliable cross-correlation with the USNO B1.0 optical catalogue. Similarly, we used the CIAO task wavdetect to determine the position and the 90% confidence level error circle using the Chandra data, which is fully consistent with the XMM-Newton results (::, ::, arcsec).
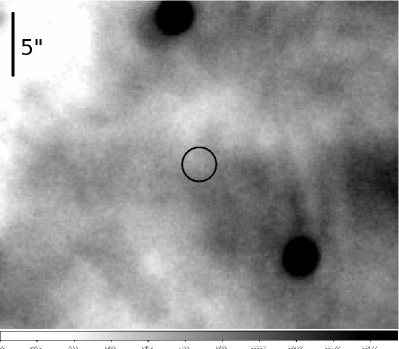
The VLT observations consisted of short exposure (2150 s in each filter) pre-imaging data which had the goal of selecting possible optical candidates for spectroscopy or deeper imaging131313Details on the optical follow-up of this and other INS candidates are reported in a separate paper (Pires et al., in preparation).. The optical images were astrometrically calibrated using non-saturated 2MASS and GSC-2 catalogued stars and the GAIA software141414http://star-www.dur.ac.uk/pdraper/gaia/gaia.html. We obtained additional imaging on the source at the Southern Astrophysical Research (SOAR) 4.1 m telescope in V and H (61120 s and 61575 s) in February 2008, which also failed to detect any object. In order to compute upper limits for the optical counterpart of XMM J1046, we defined the limiting magnitude of the data as the magnitude of the faintest simulated star still succesfully measured by means of PSF fitting, on the exact location of XMM J1046. For all filters, the synthetic star was no longer detected or it was rejected (while trying to fit the PSF model) when the signal-to-noise ratio was worse than 2.5. At this confidence level (98.76%), the present upper limits are , and . Although some structure in the H nebular emission is present close to the position of the X-ray source, it is not clear if it is related to XMM J1046 since similar structures also appear in other parts of the nebula, see Fig. 4.
After correcting for photoelectric absorption and interstellar extinction, the above limits imply . For an assumed cm-2, (Predehl & Schmitt 1995) and the unabsorbed X-ray flux151515In this work we adopted the notation and to denote the unabsorbed fluxes while is used for the observed flux. is erg s-1 cm-2 in the 0.1–12 keV energy band. The high value of the X-ray-to-optical flux ratio pratically rules out any other possibility than an INS. For instance, late-type (M, G, K) stars and active galactic nuclei (AGN) show logarithmic X-ray-to-optical flux ratios and within and (e.g. Barcons et al. 2007, and references therein), respectively, while cataclysmic variable (CV) systems and BL Lac objects, which are among the most extreme classes of objects, have (e.g. Schwope et al. 1999). Obscured T-Tauri stars would exhibit much more absorbed X-ray spectra. We also note that the high total Galactic extinction in the direction of XMM J1046 (; Schlegel et al. 1998) rules out a background AGN. Moreover, the Parkes-MIT-NRAO Multibeam Survey of the southern hemisphere shows no radio source located at 6 arcmin from the position of XMM J1046 to a flux limit of 32 mJy (Wright et al. 1994). The Parkes Multibeam Pulsar Survey has a sensitivity of about 0.14 mJy for a canonical pulsar (Lyne 2008; Manchester et al. 2005) and also failed to detect the source – the nearest entry in the ATNF Pulsar Catalogue is AXP 1E 1048.1-5937, at 32 arcmin from XMM J1046, and the young radio pulsar PSR J1052-5954, at 50 arcmin.
This, together with its thermal, soft energy distribution, makes XMM J1046 a very promising INS candidate, with overall properties similar to the M7. Deep radio searches and dedicated X-ray and optical observations should be carried out in order to confirm its nature and to determine to which subgroup of INSs it may belong. For comparison, the identification of the M7 RX J2143.0+0654 with an INS was first proposed on the basis of a 500 net counts ROSAT PSPC spectrum and of follow-up optical observations yielding (Zampieri et al. 2001); the nature of the source was then confirmed by a dedicated XMM-Newton observation (Zane et al. 2005).
3 Discussion
On the basis of the present data, the identification of XMM J1046 with an INS appears convincing. If proven correct, this would be the first example of a presumably radio-quiet and X-ray dim INS, located at a significantly greater distance than the M7.
Most probably, all cooling INSs contained in the ROSAT Bright Source Catalogue have already been identified (Popov et al. 2000; Rutledge et al. 2003), so that new sources must be looked for at lower fluxes. The search for “blank field” sources161616Sources without an optical candidate in their X-ray error circles. in the entire ROSAT All-Sky Survey and in HRI pointings (e.g. Agüeros et al. 2006; Chieregato et al. 2005; Treves et al. 2007) produced candidates with X-ray-to-optical flux ratios of 10 to 100. Further X-ray and optical investigations of one such blank field led to the discovery of Calvera, a likely INS (which exact nature is, however, still unclear) with a very large (Rutledge et al. 2008). However, this source, like most of the other INS candidates discovered in the ROSAT data at faint fluxes, is at high Galactic latitude while it is expected that both accreting and cooling INSs at greater distances should be more abundant close to the Galactic plane.
Detailed population synthesis calculations (Posselt et al. 2008) show that, in general, cooling INSs at lower soft X-ray fluxes are also expected to be hotter than the M7 (an observational bias due to the higher photoelectric absorptions) and still at small angular distance from their birth star forming regions. Recently, Muno et al. (2008) used XMM-Newton and Chandra archival observations covering significant part of the sky close to the Galactic plane () to present constraints on the number of magnetar candidates. The search was sensitive to sources with luminosities erg s-1 and pulsed fractions %, at distances within a few kiloparsecs (see their Fig. 6). Interestingly, their results can also be used to constrain the number of cooling INSs, since no new pulsating neutron star candidate was found in spin period range 5 to 20 s. Rescaling luminosity down to the typical values inferred for the M7 ( erg s-1) we obtain that the search presented by Muno et al. (2008) is sensitive to such objects up to a few hundred parsecs. Taking into account the expected distribution of cooling INSs on the sky (Popov et al. 2005; Posselt et al. 2008), we obtain as a rough estimate that the limits by Muno et al. can be translated into 1000 detectable cooling neutron stars up to a few hundred parsecs. In comparison with other limit this does not provide new important constraints. Still, a similar search in slightly wider period range focused on the possibility of finding cooling INSs is welcomed.
The spatial location of XMM J1046, close to the center of the Carina Nebula, and the derived value of the source column density suggest that it may be physically associated with this giant H ii region. The Carina Nebula harbours a large number of massive stars and has ongoing active star formation (see e.g. Smith & Brooks 2007, and references therein). The source column density is a factor of 10 higher than those typical of the M7 and is consistent with the one towards Eta Carinae ( cm-2, Leutenegger et al. 2003). Eta Carinae’s distance, measured with high accuracy through the expansion parallax of its circumstellar nebula, is 2.3 kpc (e.g. Smith 2006). The distance to XMM J1046 is then likely to be comparable.
If the star surface is an isotropic blackbody emitter, then
which gives a radiation radius (as seen by an observer at infinity) of km for XMM J1046, assuming that it is at the same distance as Eta Carinae. Although smaller than the canonical neutron star radius, such a value is in agreement with what is measured for the M7: their redshifted radiation radii, as derived from X-ray blackbody fits and distance estimates, are in the range of 2 to 7 km. However, it is well known that larger emission radii (and softer temperatures) are inferred when the surface radiation is described by more realistic models which take into account the overall spectra of these sources – in particular, by invoking a geometrically thin hydrogen atmosphere on top of the condensed neutron star surface (e.g. Motch et al. 2003; Zane et al. 2004; Ho et al. 2007). Moreover, the presence of small hot regions on the surface is understood in terms of the anisotropic heat transport that occurs in the crust of cooling neutron stars endowed with a strong toroidal magnetic field component (Pérez-Azorín et al. 2006; Page et al. 2007). Recent investigations of neutron star thermal evolution which account for these effects (Aguilera et al. 2008) confirm that coolers can easily have polar caps with high temperatures and small radii.
Alternatively, the rich star forming environment of the Carina Nebula brings in the intriguing possibility that XMM J1046 could be a much older neutron star accreting from the ISM, probably born outside the nebula and whose orbit is presently intersecting the H ii region. We note that, in this case, position and velocity are not expected to be correlated. The gas mass in the Carina Nebula is 106 M⊙ (Smith & Brooks 2007) which, for a typical H ii region size of 100 pc, implies an average density of 10 cm-3. In fact, as reported by Mizutani et al. (2002), two distinct electron density components are detected in a 30 pc area centered on the Carina I and II H ii regions: a high-density ( 100–350 cm-3) component and an extended low-density ( cm-3) component detectable over the entire mapped region. If XMM J1046 is moving inside the nebula, the corresponding increase on the column density is 1.5 cm-2 pc-1, assuming a typical density of 50 cm-3. This means that the source could be up to 10 pc inside the nebula and would still be compatible with the measured value and with the one derived for Eta Carinae.
At 2.3 kpc, the luminosity of XMM J1046 is erg s-1. Although the estimated emission radius of XMM J1046 is comparable to those of the M7, the higher blackbody temperature is responsible for the factor of nearly 10 higher X-ray luminosity. If XMM J1046 is in the accretion phase, mass entrainment should then proceed at a rate g s-1, where is the efficiency. The Bondi-Hoyle accretion rate for a star moving through the ISM with particle density is g s-1, where is the velocity of the neutron star relative to the ISM in units of 10 km s-1. For cm-3, as appears likely inside the nebula, Bondi-Hoyle accretion can produce the required luminosity but the star should move very slowly through the gas, km s-1. Radio pulsars are known to have very high spatial velocity (typically km s-1; e.g. Hobbs et al. 2005; Faucher-Giguère & Kaspi 2006), thus the chance to have an object so slow is very small. Morevover, several mechanisms are known to inhibit accretion onto a magnetized INS (Blaes et al. 1995; Toropina et al. 2003; Ikhsanov 2007).
Interestingly, and in agreement with the results of simulations by Posselt et al. (2008), a higher temperature and greater distance respective to the M7 are also observed in the only RRAT (J1819-1458, McLaughlin et al. 2007) detected up to now in X-rays. The XMM-Newton spectrum of J1819-1458 is well fitted by a blackbody with eV and a broad absorption feature at 1 keV – similar to those of the M7, which are usually interpreted as evidence for magnetic fields of few 10 G. Its DM distance is 3.6 kpc and the observed flux is erg s-1 cm-2 (0.3–5 keV). The M7 and this RRAT also share similar spin periods and period derivatives. On the other hand, steady or transient radio emission are not detected in any of the M7 to a rather sensitive limiting flux of few 10 Jy (Kondratiev et al. 2008). In order to better understand the relations between these two classes of INSs, further, deeper pointings in X-rays and in radio are required to firmly assess the nature of this and other RRAT sources.
4 Summary and conclusions
Overall, the present observational picture of XMM J1046 suggests that it has the right properties to be identified with a younger and more distant thermally emitting INS, possibly the eighth member of the ROSAT-discovered M7. The analysis of its X-ray emission, although based on archival data obtained with non-optimal configurations, reveals an intrinsically soft energy distribution, possibly variable on long time scales. However, uncertainties on the calibration accuracy of the large off-axis angles at which the source was observed may account for the variations of the derived spectral parameters. Its mean temperature, column density and 0.15–3 keV observed flux are eV, cm-2 and erg s-1 cm-2, where we adopted the weighted means of the subsample of the 10 best XMM-Newton observations. The present optical limits imply a logarithmic X-ray-to-optical flux ratio greater than 3.1, already high enough to safely exclude standard classes of X-ray emitters (late-type stars, AGN and CVs). The column density is consistent with the source being located within the Carina Nebula, roughly at a distance of 2 kpc. Assuming that the X-ray emission is well described by the mean parameters given above, XMM J1046 may be more luminous and youngish than the M7 and thus perhaps still close to its birth place. XMM J1046 is unique in the sense that it is hotter than the seven nearby sources and may represent an evolutionary missing link between the different classes of magnetars, radio-transient and radio-quiet INSs. The accretion scenario would require an unlikely low-velocity neutron star, combined with high accretion efficiency, to account for the X-ray luminosity of XMM J1046. A systematic search for pulsations is crucial in order to establish the true nature of this X-ray source.
Acknowledgements.
The work of A.M.P. is supported by FAPESP (grant 04/04950-4), CAPES (grant BEX7812/05-7), Brazil, and the Observatory of Strasbourg (CNRS), France. R.T. aknowledges financial support from INAF-ASI under contract AAE TH-058. The work of S.P. is partially funded by INTAS through grant 6-1000014-5706; S.P. is also grateful to the Observatory of Cagliari for hospitality when part of this work was completed. The authours acknowledge the use of the ATNF Pulsar Catalogue (http://www.atnf.csiro.au/research/pulsar/psrcat). We thank the anonymous referee for useful comments and suggestions which helped to improve the paper.References
- Agüeros et al. (2006) Agüeros, M. A., Anderson, S. F., Margon, B., et al. 2006, AJ, 131, 1740
- Aguilera et al. (2008) Aguilera, D. N., Pons, J. A., & Miralles, J. A. 2008, ApJ, 673, L167
- Barcons et al. (2007) Barcons, X., Carrera, F. J., Ceballos, M. T., et al. 2007, A&A, 476, 1191
- Blaes et al. (1995) Blaes, O., Warren, O., & Madau, P. 1995, ApJ, 454, 370
- Buccheri et al. (1983) Buccheri, R., Bennett, K., Bignami, G. F., et al. 1983, A&A, 128, 245
- Burwitz et al. (2003) Burwitz, V., Haberl, F., Neuhäuser, R., et al. 2003, A&A, 399, 1109
- Cash (1979) Cash, W. 1979, ApJ, 228, 939
- Chieregato et al. (2005) Chieregato, M., Campana, S., Treves, A., et al. 2005, A&A, 444, 69
- De Luca et al. (2005) De Luca, A., Caraveo, P. A., Mereghetti, S., Negroni, M., & Bignami, G. F. 2005, ApJ, 623, 1051
- Faucher-Giguère & Kaspi (2006) Faucher-Giguère, C.-A. & Kaspi, V. M. 2006, ApJ, 643, 332
- Haberl (2007) Haberl, F. 2007, Ap&SS, 308, 181
- Haberl et al. (2006) Haberl, F., Turolla, R., de Vries, C. P., et al. 2006, A&A, 451, L17
- Ho et al. (2007) Ho, W. C. G., Kaplan, D. L., Chang, P., van Adelsberg, M., & Potekhin, A. Y. 2007, Ap&SS, 308, 279
- Hobbs et al. (2005) Hobbs, G., Lorimer, D. R., Lyne, A. G., & Kramer, M. 2005, MNRAS, 360, 974
- Hohle et al. (2008) Hohle, M. M., Haberl, F., Vink, J., et al. 2008, ArXiv e-prints
- Ikhsanov (2007) Ikhsanov, N. R. 2007, Ap&SS, 308, 137
- Kaplan (2008) Kaplan, D. L. 2008, in American Institute of Physics Conference Series, Vol. 983, 40 Years of Pulsars: Millisecond Pulsars, Magnetars and More, ed. C. Bassa, Z. Wang, A. Cumming, & V. M. Kaspi, 331–339
- Kaspi et al. (2004) Kaspi, V. M., Roberts, M. S. E., & Harding, A. K. 2004, ArXiv Astrophysics e-prints
- Keane & Kramer (2008) Keane, E. F. & Kramer, M. 2008, ArXiv e-prints
- Kondratiev et al. (2008) Kondratiev, V. I., Burgay, M., Possenti, A., et al. 2008, in American Institute of Physics Conference Series, Vol. 983, 40 Years of Pulsars: Millisecond Pulsars, Magnetars and More, ed. C. Bassa, Z. Wang, A. Cumming, & V. M. Kaspi, 348–350
- Leutenegger et al. (2003) Leutenegger, M. A., Kahn, S. M., & Ramsay, G. 2003, ApJ, 585, 1015
- Lyne (2008) Lyne, A. G. 2008, in American Institute of Physics Conference Series, Vol. 983, 40 Years of Pulsars: Millisecond Pulsars, Magnetars and More, ed. C. Bassa, Z. Wang, A. Cumming, & V. M. Kaspi, 561–566
- Manchester et al. (2005) Manchester, R. N., Hobbs, G. B., Teoh, A., & Hobbs, M. 2005, AJ, 129, 1993
- McLaughlin et al. (2006) McLaughlin, M. A., Lyne, A. G., Lorimer, D. R., et al. 2006, Nature, 439, 817
- McLaughlin et al. (2007) McLaughlin, M. A., Rea, N., Gaensler, B. M., et al. 2007, ApJ, 670, 1307
- Mizutani et al. (2002) Mizutani, M., Onaka, T., & Shibai, H. 2002, A&A, 382, 610
- Motch et al. (2007) Motch, C., Pires, A. M., Haberl, F., & Schwope, A. 2007, Ap&SS, 308, 217
- Motch et al. (2008) Motch, C., Pires, A. M., Haberl, F., Schwope, A., & Zavlin, V. E. 2008, in American Institute of Physics Conference Series, Vol. 983, 40 Years of Pulsars: Millisecond Pulsars, Magnetars and More, ed. C. Bassa, Z. Wang, A. Cumming, & V. M. Kaspi, 354–356
- Motch et al. (2003) Motch, C., Zavlin, V. E., & Haberl, F. 2003, A&A, 408, 323
- Muno et al. (2008) Muno, M. P., Gaensler, B. M., Nechita, A., Miller, J. M., & Slane, P. O. 2008, ApJ, 680, 639
- Ostriker et al. (1970) Ostriker, J. P., Rees, M. J., & Silk, J. 1970, Astrophys. Lett., 6, 179
- Page et al. (2007) Page, D., Geppert, U., & Küker, M. 2007, Ap&SS, 308, 403
- Pérez-Azorín et al. (2006) Pérez-Azorín, J. F., Pons, J. A., Miralles, J. A., & Miniutti, G. 2006, A&A, 459, 175
- Pires & Motch (2008) Pires, A. M. & Motch, C. 2008, in American Institute of Physics Conference Series, Vol. 983, 40 Years of Pulsars: Millisecond Pulsars, Magnetars and More, ed. C. Bassa, Z. Wang, A. Cumming, & V. M. Kaspi, 363–365
- Popov et al. (2003) Popov, S. B., Colpi, M., Prokhorov, M. E., Treves, A., & Turolla, R. 2003, A&A, 406, 111
- Popov et al. (2000) Popov, S. B., Colpi, M., Treves, A., et al. 2000, ApJ, 530, 896
- Popov et al. (2006) Popov, S. B., Turolla, R., & Possenti, A. 2006, MNRAS, 369, L23
- Popov et al. (2005) Popov, S. B., Turolla, R., Prokhorov, M. E., Colpi, M., & Treves, A. 2005, Ap&SS, 299, 117
- Posselt et al. (2007) Posselt, B., Popov, S. B., Haberl, F., et al. 2007, Ap&SS, 308, 171
- Posselt et al. (2008) Posselt, B., Popov, S. B., Haberl, F., et al. 2008, A&A, 482, 617
- Predehl & Schmitt (1995) Predehl, P. & Schmitt, J. H. M. M. 1995, A&A, 293, 889
- Rutledge et al. (2008) Rutledge, R. E., Fox, D. B., & Shevchuk, A. H. 2008, ApJ, 672, 1137
- Rutledge et al. (2003) Rutledge, R. E., Fox, D. W., Bogosavljevic, M., & Mahabal, A. 2003, ApJ, 598, 458
- Schlegel et al. (1998) Schlegel, D. J., Finkbeiner, D. P., & Davis, M. 1998, ApJ, 500, 525
- Schwope et al. (1999) Schwope, A. D., Hasinger, G., Schwarz, R., Haberl, F., & Schmidt, M. 1999, A&A, 341, L51
- Shvartsman (1971) Shvartsman, V. G. 1971, Soviet Astronomy, 14, 662
- Smith (2006) Smith, N. 2006, ApJ, 644, 1151
- Smith & Brooks (2007) Smith, N. & Brooks, K. J. 2007, MNRAS, 379, 1279
- Toropina et al. (2003) Toropina, O. D., Romanova, M. M., Toropin, Y. M., & Lovelace, R. V. E. 2003, ApJ, 593, 472
- Treves et al. (2007) Treves, A., Campana, S., Chieregato, M., et al. 2007, Ap&SS, 308, 167
- Treves et al. (2000) Treves, A., Turolla, R., Zane, S., & Colpi, M. 2000, PASP, 112, 297
- van Kerkwijk & Kaplan (2007) van Kerkwijk, M. H. & Kaplan, D. L. 2007, Ap&SS, 308, 191
- van Kerkwijk et al. (2007) van Kerkwijk, M. H., Kaplan, D. L., Pavlov, G. G., & Mori, K. 2007, ApJ, 659, L149
- Wright et al. (1994) Wright, A. E., Griffith, M. R., Burke, B. F., & Ekers, R. D. 1994, ApJS, 91, 111
- Zampieri et al. (2001) Zampieri, L., Campana, S., Turolla, R., et al. 2001, A&A, 378, L5
- Zane et al. (2005) Zane, S., Cropper, M., Turolla, R., et al. 2005, ApJ, 627, 397
- Zane et al. (2004) Zane, S., Turolla, R., & Drake, J. J. 2004, Advances in Space Research, 33, 531