Bistability of vortex core dynamics in a single perpendicularly magnetized nano-disk
Abstract
Microwave spectroscopy of individual vortex-state magnetic nano-disks in a perpendicular bias magnetic field, , is performed using a magnetic resonance force microscope (MRFM). It reveals the splitting induced by on the gyrotropic frequency of the vortex core rotation related to the existence of the two stable polarities of the core. This splitting enables spectroscopic detection of the core polarity. The bistability extends up to a large negative (antiparallel to the core) value of the bias magnetic field , at which the core polarity is reversed. The difference between the frequencies of the two stable rotational modes corresponding to each core polarity is proportional to and to the ratio of the disk thickness to its radius. Simple analytic theory in combination with micromagnetic simulations give quantitative description of the observed bistable dynamics.
Magnetic vortices are singular topological states found in the equilibrium magnetic configuration of sub-micron size ferromagnetic dots Cowburn et al. (1999); Shinjo et al. (2000). In a certain range of dot aspect ratios (ratio of the dot thickness to its radius ) the equilibrium ground state of the static magnetization consists of the curling in-plane magnetization and a nanometer size core of the out-of-plane magnetization at the dot center. The magnetization of the vortex core can point either up or down, both polarities being degenerate at zero field. This bi-stable property of magnetic vortices, as well as the switching from one polarity to the other, have been intensively studied in the past few years because of their possible applications in magnetic storage devices Waeyenberge et al. (2006); Curcic et al. (2008); Yamada et al. (2007); Guslienko et al. (2008). It has already been established : (i) that the lowest excitation mode of the vortex state is the gyrotropic mode corresponding to a rotation of the vortex core about the dot center, (ii) that the frequency of this mode is linearly proportional the dot aspect ratio Guslienko et al. (2002), and (iii) that the sense of gyration of the vortex core is determined by a right-hand rule to the core polarity Curcic et al. (2008).
In this Letter, we report that by using the exquisitely sensitive method of magnetic resonance force microscopy (MRFM) Klein et al. (2008), we were able to observe bistability of the vortex core dynamics in a single magnetic disk subjected to a perpendicular bias magnetic field, that was varied in a wide range from positive (parallel to the vortex core) to negative (antiparallel to the vortex core) values. We demonstrate that in a certain range of the bias field magnitudes there are two stable gyrotropic modes of the vortex core rotation having different frequencies and opposite circular polarizations, and corresponding to opposite orientations of the vortex core relative to the direction of the bias magnetic field. The difference in frequencies of these two stable gyrotropic modes is proportional to the magnitude of the applied bias field, , and, also, to the dot aspect ratio . We believe that this effect might be important for the development of novel magnetic memory elements. It allows one to determine the polarity of the vortex core by measuring the frequency of the resonance absorption in a nano-disk subjected to a perpendicular field, which is substantially easier to implement than the detection of the sense of signal circular polarization, as it was suggested in Curcic et al. (2008).
Our experiments were performed at room temperature on individual nano-disks of the thickness nm and two different radii ( and nm). The nano-disks were patterned from a film of NiMnSb, a soft conductive magnetic material having very low magnetic losses (typical Gilbert damping constant is ), epitaxially grown on an InP(001) substrate Bach et al. (2003). A reference sample of a continuous film was cut out of the same film for characterization purposes. A 50 nm thick Si3N4 cap layer was deposited on top of the disks for protection, and a 300 nm thick Au broadband strip-line microwave antenna was evaporated on top of the disks. This antenna generates a linearly polarized microwave magnetic field oriented in-plane perpendicularly to the stripe direction. The disk samples were placed in the uniform external bias magnetic field oriented perpendicular to the disk plane and having magnitude that was continuously varied from to kOe.
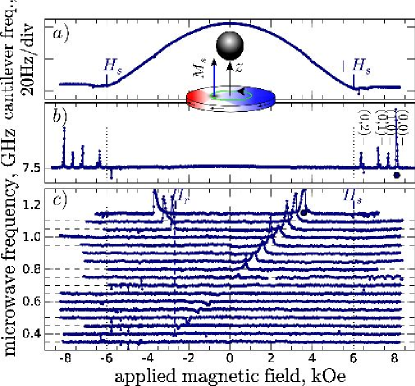
The detection scheme of MRFM is inspired by magnetic force microscopy (MFM) Klein et al. (2008). It consists of an ultra-soft cantilever with a 800 nm diameter sphere of amorphous Fe (with 3% Si) glued to its apex. The magnetization curve of this probe is typical of a soft Fe sphere (coercitivity G). Its magnetic moment always follows the direction of the applied field and senses a dipolar force proportional to the perpendicular component of the magnetization of the nano-disk. MRFM spectroscopy is achieved by placing the center of the sphere above the center of the nano-disk. A ferromagnetic resonance (FMR) spectrum is obtained by recording the vibration amplitude of the cantilever as a function of at constant microwave excitation frequency, that is switched ON and OFF at the cantilever resonance frequency. The MRFM signal originates from the diminution of of the nano-disk produced by the absorbtion of the microwave field Klein et al. (2008). During the scan, the cantilever resonance frequency is also recorded (see Fig.1a). This enables static magnetometry of the sample. The saturation field of the nm nano-disk is kOe, which marks the region of the maximum radial susceptibility.
Fig.1b shows the FMR spectrum of the smaller nano-disk at the frequency of 7.5 GHz. Above the saturation field , the excitation spectrum of the disk consists of a series of peaks corresponding to the confined dipole-exchange spin-wave modes of the disk. Their quantized resonance frequencies (resonance fields) are given by Eq.(1) from Kakazei et al. (2004). These modes are labeled with a pair of azimutal and radial mode indices Klein et al. (2008). The lowest (and the most spatially uniform) spin wave mode of the disk is situated at 8.1 kOe and is marked by a blue circle symbol. The frequency of this lowest quasi-uniform Kittel mode can be approximately described as:
| (1) |
where . Here is the saturation magnetization, are the diagonal elements of the effective demagnetization tensor of the uniformly magnetized disk, is a uniaxial perpendicular anisotropy field (easy-plane for ), and is the gyromagnetic ratio. All the parameters used in Eq. (1) were measured independently using the reference film sample by means of standard magnetometry and cavity-FMR techniques (results are presented in table 1). The calculated position of the Kittel mode (as well as the positions of the higher modes calculated using Eq. (1) from Kakazei et al. (2004)) are shown near the corresponding index pairs in Fig.1b. This calculation did not use any adjustable parameters and took into account the stray field of the cantilever probe (around 500 Oe) Klein et al. (2008). The analytically calculated values of for the smaller and larger disks are kOe and kOe, respectively.
| Ms (G) | (rad.s-1.G-1) | (G) | |
|---|---|---|---|
When the external magnetic field is reduced below the saturation field , a single magnetic vortex is formed inside the nano-disk (which can be visualized by standard MFM). Fig.1c shows the dynamical behavior of the vortex-state disk (unsaturated regime). The absorption peak observed in the spectra corresponds to the excitation of the gyrotropic mode in the disk (see inset of Fig.1a) Novosad et al. (2005). It produces a mechanical signal mainly because the contribution of the vortex core to diminishes when it is excited Guslienko et al. (2008). Such signal is sensitive to the polarity of the vortex core: it is positive when the sphere magnetization and the vortex core are parallel and negative in the opposite case. Moreover, due to the field dependence of the magnetic moment of the sphere, the amplitude of the MRFM signal decreases as is reduced to zero.
The baseline of each spectrum in Fig.1c is set at the excitation frequency. The spectrum for 1.15 GHz has an intense peak at around kOe (blue circle) corresponding to the excitation of the gyrotropic mode of the vortex core, as well as its mirror image at kOe. The gyrotropic frequency decreases with the bias field , and in the zero field () has the value of 0.7 GHz. In the region of negative bias fields the mode continues to exist, but the corresponding resonance peak has a negative amplitude, which indicates that now the direction of the bias field and the amorphous sphere magnetization is opposite to that of the vortex core. The gyrotropic frequency continues to decrease with the same slope until the bias field value of kOe, where the resonance peak abruptly changes its sign, frequency, and slope, which indicates reversal of the vortex core polarity. Below the switching field the gyrotropic frequency of the inverted vortex core increases like it did in positive bias fields before the core reversal. It is important to note, that upon increasing the bias field, the gyrotropic mode persists at reduced frequency until the symmetric reversal field of kOe is reached, and the new reversal of the vortex core polarity takes place.
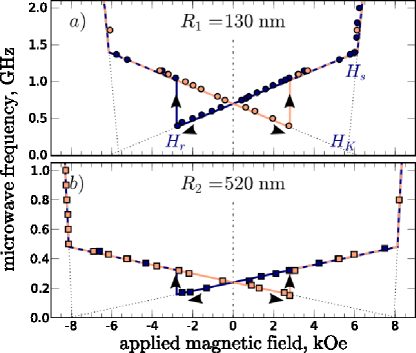
The complete phase diagrams demonstrating the dynamic hysteresis loops of the gyrotropic mode frequency in a perpendicular bias magnetic field for two disk sizes are presented in Fig.2. The dark blue dots correspond to the case when the bias field is reduced starting from large positive values, while the light red dots correspond to the opposite case, when the field is varied starting from large negative values.
Several important features emerge in these phase diagrams: (i) For the excitation frequency of the lowest mode in the disk is well described by the Kittel’s Eq. (1), and at the field slope of the mode frequency changes abruptly, while the expected discontinuity of the mode frequency is not seen in the experiment; (ii) In the interval each value of the bias field (except ) corresponds to two different gyrotropic mode frequencies corresponding to two opposite orientations of the vortex core relative to the bias field, and the difference between these frequencies increases with the bias field and with the disk aspect ratio ; (iii) The magnitude of the bias field , at which the reversal of the vortex core polarity occurs, seems to be approximately the same for both studied disks.
The frequency of the gyrotropic mode in the external perpendicular bias magnetic field can be calculated as a ratio of the field-dependent vortex stiffness to the field-dependent magnitude of the -component of the vortex gyrovector using the method of Thiele’s equation that was used in Guslienko et al. (2002) to calculate this frequency in the case when . According to the general definition given in Guslienko et al. (2002) (see Eq. (2) in Guslienko et al. (2002)) when the perpendicular bias field is introduced we can write the vortex gyrovector as , where is the vortex core polarity, is the gyrovector in zero bias field defined in Guslienko et al. (2002), and is the polar angle of the static magnetization at the disk lateral boundary. For a sufficiently large disk radius (much larger than the radius of the vortex core) is is possible to estimate from the standard electrodynamic boundary conditions at the vertical boundaries of the disk as .
The field-dependent vortex stiffness is found from the assumption that the main contribution to the vortex energy comes from the dipolar interaction of the volume magnetostatic charges created by the in-plane magnetization component of the shifted vortex outside the core Guslienko et al. (2002). In this region the in-plane magnetization components depend of the direction of the external bias field as , and the stiffness , that is proportional to the square of the radial derivative of the in-plane magnetization, is expressed as , where is the vortex stiffness in the zero bias field defined in Guslienko et al. (2002). Thus, we can write the explicit expression for the gyrotropic mode frequency in the perpendicular bias field as
| (2) |
where is the gyrotropic mode frequency in the zero bias field defined by Eq. (7) of Guslienko (2008). The approximate expression for obtained in the limit of small aspect ratios has the form Guslienko et al. (2002). The value of the saturation field can also be determined as the crossing point of the dispersion curves (1) and (2). It occurs at found to be kOe for the smaller disk, a result that is close to the experimentally measured value shown in Fig.2a.
The theoretical curves calculated using Eq. (2) are shown by solid lines in Fig.2, and it is clear from this figure that Eq. (2) gives a good quantitative description of the experimental data for two different values of the disk aspect ratio. This simple analytic theory does not account for the reversal of the vortex core polarity observed experimentally at (see Fig.(2)). Therefore, we performed micromagnetic simulations to reproduce this experimentally observed effect. The results of these simulations are presented in Fig.3.
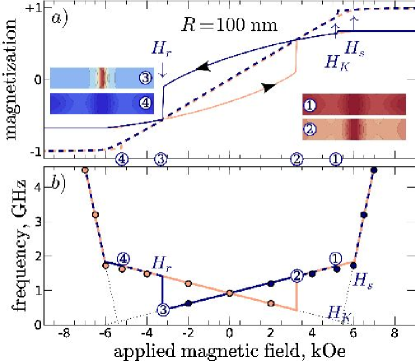
Our micromagnetic numerical code Boust and Vukadinovic (2004) calculates the stable configuration of the magnetization vector in the nano-disk by solving the Landau-Lifshitz (LL) equation in the time domain. A 3D mesh with a cubic cell of size 3.125 nm gives a discrete representation of the nano-disk magnetization. The nano-disk dimensions were chosen as nm, nm, while the values of the magnetic parameters were taken from table 1. The numerically calculated static hysteresis loop of (where the vertical component of the static magnetization was averaged over the disk volume) is shown in Fig.3a by a dashed line. Color images of distribution across the radial section of the disk taken at four points corresponding to progressively decreasing values of the perpendicular bias magnetic field are shown as inserts in Fig.3a. Although the vortex core switching is not seen in this averaged static hysteresis loop, it is clearly revealed when the averaging of the static component is done over the spatial region occupied by the vortex core ( nm), as demonstrated by the solid lines in Fig.3a, where the core polarity switching appears as a jump at kOe.
It should be noted, that the vortex core reversal in the negative perpendicular bias field was studied analytically and numerically in Thiaville et al. (2003) and was attributed to the formation of a Bloch point. Experimentally this effect was studied on an array of magnetic dots in Okuno et al. (2002). The magnitudes of the core reversal fields obtained in Thiaville et al. (2003); Okuno et al. (2002) are consistent with corresponding magnitudes obtained in our experiment Fig.2 and numerical modeling Fig.3a.
The dynamic hysteresis loop (i.e. the dependence of the gyrotropic mode frequency on the perpendicular bias magnetic field ) shown in Fig.3b was numerically calculated using a second code developed by the authors, which computes the full dynamic susceptibility tensor from linearization of the LL equation around the equilibrium configuration Boust and Vukadinovic (2004). It clearly demonstrates the effects of the bias-field-induced dynamic bistability Giesen et al. (2005) in the field interval . Additional numerical calculations are in progress to study the details of the gyrotropic frequency behavior in the vicinity of the points , where the vortex is formed, and , where the reversal of the vortex core polarity takes place.
This research was partially supported by the ANR PNANO06-0235 from France, by the European Grants DynaMax (FP6-IST 033749) and Master (NMP-FP7 212257), by the MURI Grant No. W911NF-04-1-0247 from the U.S. Army Research Office, by the Contract W56HZV-08-P-L605 from the U.S. Army TARDEC, RDECOM, and by the Grant No. ECCS-0653901 from the U.S. National Science Foundation. K.G. acknowledges support by the Ikerbasque Science Foundation.
References
- Cowburn et al. (1999) R. P. Cowburn, D. K. Koltsov, A. O. Adeyeye, M. E. Welland, and D. M. Tricker, Phys. Rev. Lett. 83, 1042 (1999).
- Shinjo et al. (2000) T. Shinjo, T. Okuno, R. Hassdorf, K. Shigeto, and T. Ono, Science 289, 930 (2000).
- Waeyenberge et al. (2006) B. V. Waeyenberge et al., Nature (London) 444, 461 (2006).
- Curcic et al. (2008) M. Curcic et al., Phys. Rev. Lett. 101, 197204 (2008).
- Yamada et al. (2007) K. Yamada et al., Nature Mater. 6, 270 (2007).
- Guslienko et al. (2008) K. Y. Guslienko, K. S. Lee, and S. K. Kim, Phys. Rev. Lett. 100, 027203 (2008).
- Guslienko et al. (2002) K. Y. Guslienko et al., J. Appl. Phys. 91, 8037 (2002).
- Klein et al. (2008) O. Klein et al., Phys. Rev. B 78, 144410 (2008).
- Bach et al. (2003) P. Bach et al., Appl. Phys. Lett. 83, 521 (2003).
- Kakazei et al. (2004) G. N. Kakazei et al., Appl. Phys. Lett. 85, 443 (2004).
- Novosad et al. (2005) V. Novosad et al., Phys. Rev. B 72, 024455 (2005).
- Guslienko (2008) K. Y. Guslienko, J. Nanosci. Nanotechnol. 8, 2745 (2008).
- Boust and Vukadinovic (2004) F. Boust and N. Vukadinovic, Phys. Rev. B 70, 172408 (2004).
- Thiaville et al. (2003) A. Thiaville, J. M. García, R. Dittrich, J. Miltat, and T. Schrefl, Phys. Rev. B 67, 094410 (2003).
- Okuno et al. (2002) T. Okuno, K. Shigeto, T. Ono, K. Mibu, and T. Shinjo, J. Magn. Magn. Mater. 240, 1 (2002).
- Giesen et al. (2005) F. Giesen et al., Appl. Phys. Lett. 86, 112510 (2005).