The First X-Ray Proper-Motion Measurements of the Forward Shock in the Northeastern Limb of SN 1006
Abstract
We report on the first X-ray proper-motion measurements of the nonthermally-dominated forward shock in the northeastern limb of SN 1006, based on two Chandra observations taken in 2000 and 2008. We find that the proper motion of the forward shock is about 0.48′′ yr-1 and does not vary around the rim within the 10% measurement uncertainties. The proper motion measured is consistent with that determined by the previous radio observations. The mean expansion index of the forward shock is calculated to be 0.54 which matches the value expected based on an evolutionary model of a Type Ia supernova with either a power-law or an exponential ejecta density profile. Assuming pressure equilibrium around the periphery from the thermally-dominated northwestern rim to the nonthermally-dominated northeastern rim, we estimate the ambient density to the northeast of SN 1006 to be 0.085 cm-3.
Subject headings:
ISM: individual (SN 1006) — shock waves — supernova remnants — X-rays: ISM1. Introduction
SN 1006 is a Galactic shell-type supernova remnant (SNR) originating from a Type Ia SN explosion. In X-rays, its northeastern (NE) and southwestern (SW) limbs are dominated by nonthermal synchrotron emission. These provided the first solid evidence that shells of SNRs are efficient accelerators of cosmic rays (Koyama et al. 1995; Winkler & Long 1997b). After the discovery of the nonthermal synchrotron emission from the NE and SW limbs of SN 1006, TeV -ray emission had been expected to be detected, but has not yet been established111The HESS team recently reported the detection of TeV emission from SN 1006 (De Naurois et al. 2008), which is consistent with the upper limit previously determined (Aharonian et al. 2005). Although their result seems reliable, the result is not yet published and they have not yet shown the TeV spectrum. Therefore, we do not take account of the detection in this paper. (Aharonian et al. 2005). TeV emission associated with SNR shocks can arise from either of two processes: inverse Compton scattering of cosmic microwave background photons by relativistic electrons (the leptonic process), or -decay emission resulting from accelerated protons interacting with the ambient medium (the hadronic process). The TeV flux from the hadronic process strongly depends on the ambient density (Ksenofontov et al. 2005). Thus, measuring the ambient density is important for understanding the origin of any TeV -ray emission detected from SN 1006.
The ambient density around the thermally emitting NW and SE rim can be measured based on spectral modelling of the thermally-dominated spectra. On the other hand, for the NE and SW rims where nonthermal emission dominates, it is quite difficult to measure the ambient density from spectral analyses. We may, however, infer the ambient density around nonthermally-dominated rims indirectly by assuming constancy of , where is the ambient density and is the shock velocity (i.e., a uniform pressure around the periphery from the thermally-dominated NW rim to the nonthermally-dominated NE rim). In this context, measuring the proper motion of the forward shock is important for estimating the ambient density around nonthermally-dominated rims of SNRs and constraining the origin of TeV -ray emission.
So far, proper-motion measurements of the SN 1006 have been performed by optical and radio observations. Optical proper-motion of the bright NW H filament was first measured by Long, Blair, & van den Bergh (1988) and later by Winkler, Gupta, & Long (2003), who precisely determined the proper motion to be 0.2800.008′′ yr-1 along the entire length of the NW filament. The radio observations measured the mean proper motion for the entire rim of the remnant to be 0.440.13′′ yr-1 (Moffett et al. 1993). Here, we report on the first X-ray proper-motion measurements of NE rim of SN 1006, based on two Chandra observations separated by about 8 yr.
2. Observations
We observed the NE rim of SN 1006 twice: first on 2000 July 10 (ObsID. 732; PI: Long) and a second time on 2008 June 24 (ObsID. 9107; PI: Petre). The second observation was specifically intended to allow a proper motion measurement; we requested the same pointing direction, roll angle and exposure time as the previous observation. The time difference between the two observations was 8.04 yr. We start our analysis from level 2 event files processed with calibration data files in CALDB ver. 3.4.0 for ObsID. 732, ver. 3.4.5 for ObsID. 9107. Fortunately, we see no background flares in the data from ObsID. 9107 so that we reject no data from the level 2 event file for this data set. On the other hand, we exclude high-background periods for data from ObsID. 732. The resulting net exposure times for ObsID. 732 and 9107 are 55.3 ks and 68.7 ks, respectively.
3. Analysis and Results
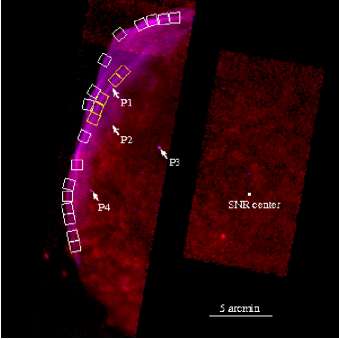
Figure 1 shows a two-color image obtained from the 2008 observation, after exposure correction to remove vignetting effects. Red and blue correspond to a low-energy (0.3–1.0 keV) and a high-energy (1.0–8.0 keV) band, respectively. The nonthermal forward shocks appear as bluish filamentary structures along the edge of the remnant. In the following analysis, we measure proper motions of various portions of the forward shocks by comparing the images obtained in the two epochs. We use an energy range of 1.0–8.0 keV to measure proper motions of the forward shocks.
Although the absolute astrometric accuracy for the Advanced CCD Imaging Spectrometer reported by the Chandra calibration team222http://cxc.harvard.edu/cal/ reached a good level of 90% uncertainty = 0.6′′, we further align the images taken in different two epochs by aligning positions of four point sources which are visible in the FOV. These four sources are marked as P1–P4 in Fig. 1. We determine their positions at each epoch, using wavdetect software included in CIAO ver. 4.0. Three of them (i.e., P1, P3, and P4 marked in Fig. 1) have optical counterparts, based on the Naval Observatory Merged Astrometric Dataset (NOMAD) catalog (Zacharias et al. 2005). The proper motions of the three sources are negligible, at less than 0.005′′yr-1 (Note that the P3 source is identified as a QSO; Winkler & Long 1997a). Although we cannot find an optical counterpart for the P2 source, the X-ray positions determined for the two epochs are consistent within the errors. Thus, we assume that the proper motion of the P2 source is also negligible. Then, we align the coordinates of the images so that the four point sources have the same coordinates in the two epochs, by using ccmap and ccsetwcs in IRAF IMCOORDS. In the alignment procedure, four parameters for the second-epoch image are allowed to vary: x and y shifts, rotation, and pixel scale. The best-fit parameters show very small differences; both x and y shifts are less than 0.2′′, rotation is less than 50′′, and no modification is required for the pixel scale. After the alignment, we find the rms residuals for the positions of the four point sources between the two epochs to be 0.14′′. We take this value as a systematic uncertainty in our proper-motion measurements.
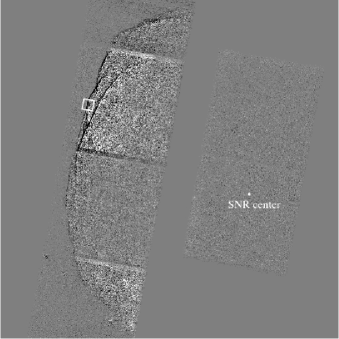
Figure 2 shows the difference image between the two epochs in the 1.0–8.0 keV band, after being exposure-corrected, registered and normalized to match the count rates in the two epochs. The narrow black lines along the periphery in this difference image clearly indicate the motion of the forward shock. In order to measure the proper motions accurately, we generate one-dimensional X-ray profiles along the apparent direction of motion—extracted from 21 areas (white and yellow boxes in Fig. 1) along the forward shock. Yellow boxes indicate inner shocks where there are essentially two shocks at the same azimuth angle (presumably a projection effect). In each case we have extracted the profiles in a direction perpendicular to the forward shock, as determined from the local tangent to the rim taken at each of the extraction boxes. Varying this tangent direction by several degrees does not significantly affect the results.
To calculate the expansion rates and expansion indices, we estimated the center for the SNR shell by fitting a circle to the outer surface-brightness contour of the whole remnant based on a ROSAT HRI image: RA 15h02m54s.9 (J2000), DEC (J2000), shown in Fig. 1 and Fig. 2. This center lies within of centers for the entire SN 1006 shell estimated from radio (Roger et al. 1988), X-ray (estimated by eye on a ROSAT PSPC image: Willingale et al. (1996), and optical (Winkler, Gupta, & Long 2003) images333Winkler, Gupta, & Long (2003) also give a center of curvature for bright NW optical filaments where they measured the proper motions; this position is offset ′ SE from the shell center.. The numbers of photons from the two epochs are equalized in each area by scaling. Each one-dimensional X-ray profile is binned by 0.492′′. An example one-dimensional profile is shown in Fig. 3, in which we can clearly see the motion of the shock. Then, shifting the first-epoch profile and calculating the -values from the difference between the two profiles at each shift position, we search for the best-matched shift position for each area. The reduced -values, which are nearly equal to -value divided by the number of bins in each area (here 69), range from 0.5 to 1.2 at the best-matched shift positions. In this way, we obtain a proper motion for each area. A detailed explanation of our method of proper-motion measurements can be found in Katsuda et al. (2008).
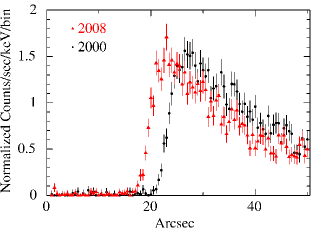
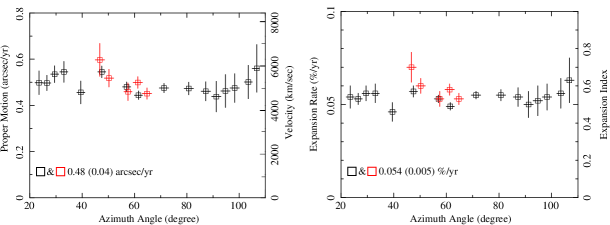
Figure 4 left shows both proper motions and velocities (for a distance of 2.2 kpc; Winkler, Gupta, & Long 2003) for all the areas as a function of azimuthal angle, and Fig. 4 right shows both expansion rates and expansion indices, ; and is derived from (the expansion rate) (the age of the remnant, 998 yr for observations used here). The data points with black and red are obtained from the white and yellow boxes in Fig. 1, respectively. The errors quoted are statistical 1 uncertainties. We find that the proper motion around the forward shocks is almost invariant. Also notable is that there is no significant velocity difference between the inner shock and the outer shock at the azimuth angle around 50∘–70∘. The weighted mean value of the proper motions of the forward shocks is calculated to be 0.48′′ yr-1 with the rms deviation of 0.04′′ yr-1. The expansion rates and the expansion indices are also nearly constant at about 0.054 % yr-1 and 0.54, respectively. The statistical error is about 10% (0.05′′ yr-1) for each data point, so that it is about three times greater than the systematic uncertainty of 0.017′′ yr-1 (= 0.14′′/8.04 yr). Thus, the current expansion index of the NE rim is considerably less than if it were in a free expansion (), but significantly higher than the value for an interstellar medium (ISM)-dominated adiabatically expanding SNR ().
4. Discussion
This paper presents the first X-ray proper-motion measurement of the forward shock along the NE rim of SN 1006. The measured proper motion of 0.480.04′′ yr-1 does not vary significantly with azimuth. This value is consistent with the mean expansion rate for the entire SN 1006 shell measured by radio observations, 0.440.13′′ yr-1 (Moffett et al. 1993). For other young SNRs, there have been problems reconciling expansion index measurements from X-ray and radio wavelengths, with the X-ray rate seeming to be larger in Cas A, Kepler’s SNR and Tycho’s SNR as noted by e.g., Hwang et al. (2002) or DeLaney et al. (2004). Table 1 summarizes the radio and X-ray expansion indices for these SNRs. We note that recent Chandra-based X-ray proper-motion measurements have reduced the expansion index for Kepler, more in line with the radio value. Cas A is the only SNR whose X-ray expansion index as measured with Chandra clearly differs from its radio value. Tycho’s SNR has yet to be remeasured with Chandra, but should be as soon as possible.
| SNR name | Radio | X-rays | |||||||
|---|---|---|---|---|---|---|---|---|---|
| Cas A | 0.351 | 0.731,2,3 | |||||||
| Tycho | 0.474 | 0.715 | |||||||
| Kepler | 0.56 | 0.93 0.35–0.88,9 | |||||||
| SN 1006 | 0.4810 | 0.5411 |
Note. — 1: Koralesky et al. (1998), 2: Vink et al. (1998), 3: DeLaney & Ludnick (2003), 4: Reynoso et al. (1997), 5: Hughes (2000), 6: Dickel et al. (1988), 7: Hughes (1999), 8: Katsuda et al. (2008), 9: Vink (2008), 10: Moffett et al. (1993), 11: This work
We here estimate the ambient density around the NE rim of SN 1006 and discuss its implication for TeV -ray emission. Along the NW rim, the proper motion of the forward shock is well determined to be 0.2800.008′′ yr-1 by optical observations (Long, Blair, & van den Bergh 1988; Winkler, Gupta, & Long 2003). The ratio of the forward shock velocities between the NE rim and the NW rim is estimated to be 1.7. The ambient density ahead of the NW rim is measured to be 0.15–0.25 cm-3 by X-ray spectroscopy (Long et al. 2003; Acero et al. 2007) or 0.25–0.4 cm-3 by optical spectroscopy (Raymond et al. 2007). We here take 0.25 cm-3 as a conservative ambient density value. Then, assuming pressure equilibrium around the periphery from the NW rim to the NE rim (i.e., constant ), we estimate the ambient density ahead of the NE rim to be 0.085 cm-3. This is consistent with the upper limit, 0.1 cm-3, constrained by an upper limit of TeV -ray flux obtained by HESS (Aharonian et al. 2005) combined with a -ray emission model (Ksenofontov et al. 2005).
We derived the mean expansion index of the NE forward shock to be 0.54. Dwarkadas & Chevalier (1998) examined the evolution of Type Ia SNe for both power-law and exponential density profiles of ejecta. From their calculations, the evolution of the forward shock is scaled by the time, yr. The age of SN1006, 998 yr, corresponds to 1.48–2.08 , depending on a range of the ambient density of 0.05–0.14 cm-3. Then, the expansion index is expected to be 0.57–0.53 (power-law) or 0.54–0.51 (exponential). Thus, we find that the measured value is in good agreement with that expected in the Type Ia SNe model with either a power-law or an exponential ejecta density profile.
We note that there are a number of thermally-dominated knotty features in the remnant (see, Fig.1). The origin of these features are suggested to be either fingers formed by Rayleigh-Taylor instabilities acting at the contact discontinuity between the swept-up ISM and the ejecta (Long et al. 2003; Cassam-Chenaï et al. 2007) or ejecta bullets (Long et al. 2003; Vink et al. 2003). It is also interesting to measure proper motions for these features, which is beyond the scope of this paper and remains as our future work.
5. Conclusion
We, for the first time, performed X-ray proper-motion measurements of the forward shock in the NE limb of SN 1006. The proper motion of the forward shock is derived to be 0.48′′ yr-1. This is consistent with the results from radio observations. The expansion index of the forward shock is calculated to be 0.54, which supports that SN 1006 is a remnant of a Type Ia supernova with either a power-law or an exponential ejecta density profile. We estimate the ambient density to the NE of SN 1006 to be 0.085 cm-3. Our derived ambient density of 0.085 cm-3 is below the limit of 0.1 cm-3 obtained by Ksenofontov et al. (2005) in modeling hadronic and leptonic TeV -ray emission subject to the HESS upper limit (Aharonian et al. 2005).
References
- Acero et al. (2007) Acero, F., Ballet, J., Decourchelle, A. 2007, A&A, 475, 883
- Aharonian et al. (2005) Aharonian, F., et al. 2005, ApJ, 437, 135
- Cassam-Chenai et al. (2007) Cassam-Chena, G., Hughes, J. P., Ballet, J., and Decourchelle, A. 2007, ApJ, 665, 315
- DeLaney & Ludnick (2003) DeLaney T. & Ludnick L. 2003, ApJ, 589, 818
- DeLaney et al. (2004) DeLaney T., Ludnick L., Fesen, R. A., Jones, T. W., Petre, R., & Morse, J. A. 2004, ApJ, 613, 343
- De Naurios et al. (2008) De Naurios et al. 2008, a presentation at cospar2008 (E13-0038-08)
- Dwarkadas & Chevalier (1998) Dwarkadas, V. V., & Chevalier, R. A. 1998, ApJ, 497, 807
- Dickel et al. (1988) Dickel, J. R., Sault, R., Arendt, R. G., Matsui, Y., & Korista, K. T. 1988, ApJ, 330, 254
- Katsuda et al. (2008) Katsuda, S., Tsunemi, H., Uchida, H., & Kimura M. 2008, ApJ, 689 225
- Koyama et al. (1995) Koyama, K., Petre, R., Gotthelf, E. V., Hwang, U., Matsuura, M., Ozaki, M., Holt, S. S. 1995, Nature, 378, 255
- Ksenofontov et al. (2005) Ksenofontov, L. T., Berezhko, E. G., & Vlk, H. J. 2005, A&A, 443, 973
- Long et al. (1988) Long, K. S., Blair, W. P., & van den Bergh, S. 1988, ApJ, 333, 749
- Long et al. (2003) Long, K. S., Reynolds, S. P., Raymond, J. C., Winkler, P. F., Dyer, K. K., Petre, R. 2003, ApJ, 586, 1162
- Moffett et al. (1993) Moffett, D. A., Goss, W. M., Reynolds, S. P. 1993, AJ, 106, 1566
- Hughes (1999) Hughes, J. P. 1999, ApJ, 527, 298
- Hughes (2000) Hughes, J. P. 2000, ApJ, 545, L53
- Hwang et al. (2002) Hwang, U., Decourchelle, A., Holt, S. S., & Petre, R. 2002, ApJ, 581, 1101
- Koralesky et al. (1998) Koralesky, B., Rudnick, L., Gotthelf, E. V., & Keohane, J. W. 1998, ApJ, 505, L27
- Raymond et al. (2007) Raymond, J. C., Korreck, K. E., Sedlacek, Q. C., Blair, W. P., Ghavamian, P., Sankrit, R. 2007, ApJ, 659, 1257
- Reynoso et al. (1997) Reynoso, E. M., Moffett, D. A., Goss, W. M., Dubner, G. M., & Goss, W. M. 1999, AJ, 117, 1827
- Roger et al. (1988) Roger, R. S., Milne, D. K., Kesteven, M. J., Wellington, K. J., & Haynes, R. F. 1988, ApJ, 332, 940
- Vink et al. (1998) Vink, J., Bloemen, H., Kaastra, J. S., Bleeker, A. M. 1998, A&A, 339, 201
- Vink et al. (2003) Vink, J., Laming, J. M., Gu, M. F., Rasmussen, A., & Kaastra, J. S. 2003, ApJ, 587, L31
- Vink (2008) Vink, J. 2008, ApJ, 689, 231
- Willingale et al. (1996) Willingale, R., West, R. G., Pye, J. P., & Stewart, G. C. 1996, MNRAS, 278, 749
- (26) Winkler, P. F., & Long, K. S. 1997a, ApJ, 486, L137
- (27) Winkler, P. F., & Long, K. S. 1997b, ApJ, 491, 829
- Winkler et al. (2003) Winkler, P. F., Gupta, G., & Long, K. S. 2003, ApJ, 585, 324
- Zacharias et al. (2005) Zacharias, N., Monet, D. G., Levine, S. E., Urban, S. E., Gaume, R., & Wycoff, G. L. 2005, NOMAD Catalog in VizieR Online Data Catalog