Radiation pressure and absorption in AGN: results from a complete unbiased sample from Swift
Abstract
Outward radiation pressure can exceed the inward gravitational pull on gas clouds in the neighbourhood of a luminous Active Galactic Nucleus (AGN). This creates a forbidden region for long-lived dusty clouds in the observed columnn density – Eddington fraction plane. (The Eddington fraction is the ratio of the bolometric luminosity of an AGN to the Eddington limit for its black hole mass.) The Swift/BAT catalogue is the most complete hard X-ray selected sample of AGN and has 97 low redshift AGN with measured column densities and inferred black hole masses. Eddington fractions for the sources have been obtained using recent bolometric corrections and the sources have been plotted on the plane. Only one source lies in the forbidden region and it has a large value of due to an ionized warm absorber, for which radiation pressure is reduced. The effective Eddington limit for the source population indicates that the high column density clouds in the more luminous objects lie within the inner few pc, where the central black hole provides at least half the mass. Our result shows that radiation pressure does affect the presence of gas clouds in the inner galaxy bulge. We discuss briefly how the plane may evolve to higher redshift, when feedback due to radiation pressure may have been strong.
keywords:
galaxies: nuclei - galaxies: ISM - quasars: general - radiative transfer1 Introduction
Evidence for a relatively tight relation between the mass of the central black hole of a galaxy and the mass or velocity dispersion of the surrounding stellar bulge (Kormendy & Richstone 1995; Magorrian et al. 1998, Gebhardt et al. 2000, Ferrarese et al. 2001; Tremaine et al. 2002) points to a coupling or feedback of the black hole on the galaxy. The accretion power produced by the growth of the black hole exceeds the binding energy of the galaxy by one to two orders of magnitude so some form of feedback is expected. What is unclear however is how it works. Is it the energy (Silk & Rees 1998, Haehnelt et al. 1998) or momentum (Fabian 1999; Fabian et al. 2002; King 2003; Murray et al. 2005) supplied by the central engine that are most effective? Winds, radiation pressure and jets have all been invoked and it is likely that they all play a role, although perhaps at different phases and in different objects.
Direct evidence of feedback is elusive and difficult to obtain. A quasar at the centre of a galaxy will have little effect on the stars of the surrounding bulge and only act on the gas. Catching and recognising an object where the gas is being expelled may not be easy. Here we provide clear evidence for the effect of radiation pressure from a central Active Galactic Nucleus (AGN) on surrounding dusty gas in a hard X-ray, flux-limited sample of AGN.
2 The Effective Eddington Limit
Laor & Draine (1993), Scoville & Norman (1995) and Murray et al. (2005) have shown that the effective Eddington limit, when the outward radiation pressure on gas exceeds the inward gravitational pull, can be much lower for dusty gas than for ionized dust-free gas, as assumed for the standard derivation. A reduction factor of 500 is obtained for an AGN spectral energy distribution (SED), peaking in the UV and assuming a Galactic dust-to-gas ratio (Fabian et al. 2008). X-ray ionization keeps the drift velocity of the dust grains relative to the gas low. The UV radiation is rapidly used up by a relatively small column density of gas and dust (equivalent hydrogen column density of ) and the effective Eddington limit drops off approximately linearly, reaching unity at column densities where it goes Compton thick around . This means that an AGN which has a luminosity one to two orders of magnitude below that standard Eddington limit may nevertheless exceed the effective Eddington limit for substantial columns of dusty gas.
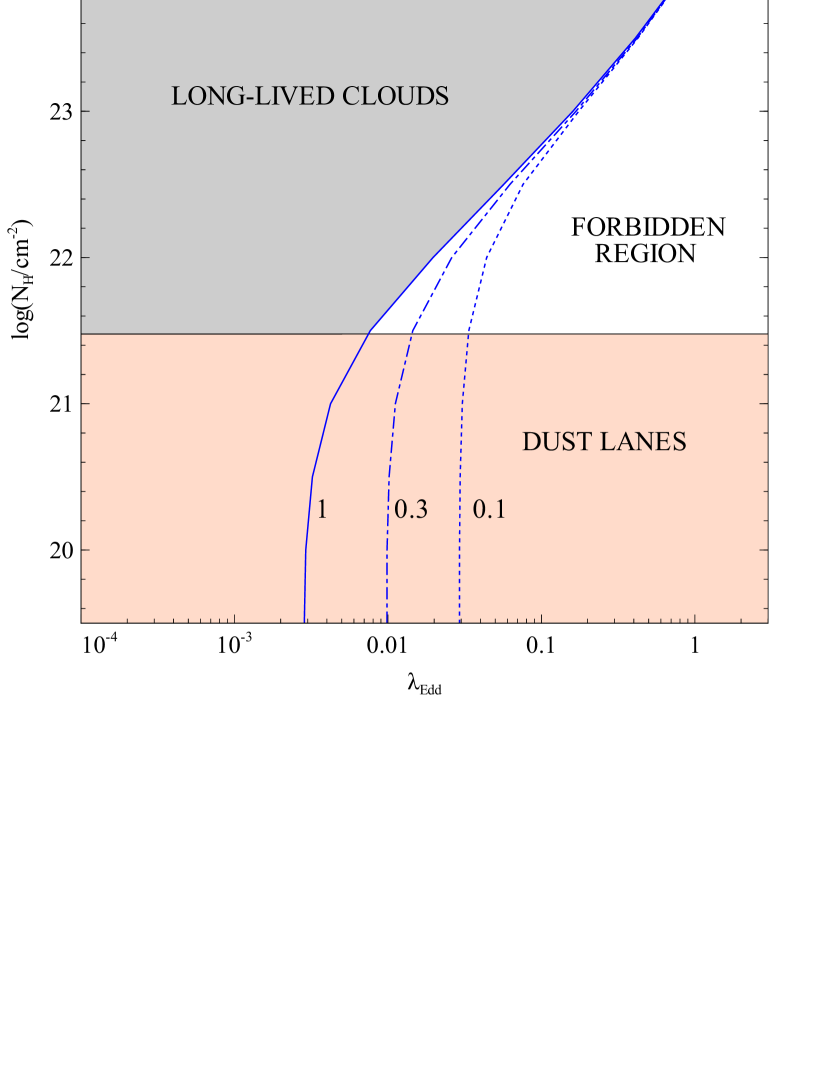
The actual interaction of the accelerated face with the rest of an absorbing cloud will be complicated and likely Rayleigh-Taylor unstable, with the details depending on magnetic fields, geometry and on how the force is transmitted to the whole cloud. The net result however is that long-lived stable clouds are not expected to survive in a regime where the effective Eddington limit is exceeded. This manifests as a forbidden region in the column density – Eddington fraction plane for AGN (Fabian et al. 2008). By Eddington fraction, we mean the ratio of the bolometric luminosity of the source to the standard Eddington limit. An AGN with is at the Effective Eddington limit for Galactic abundance dusty gas with . This is shown in Fig. 1. This limit has been calculated assuming an average SED typical for low Eddington ratio AGN (the thick black curve in Fig. 13 of Vasudevan & Fabian 2007); at high Eddington ratios the substantially different SED shape may marginally reduce the effective Eddington limit .
The above argument applies only where the black hole dominates the mass locally. For outer gas hundreds of pc to kpc from the black hole, the boundary increases in proportion to the enclosed mass of stars. Outer (few kpc) dust lanes in a galaxy bulge or disk are unlikely to have very high column densities (the total gas mass at radius is otherwise very high, , where the column density is and is the covering fraction), so we suggest a lower boundary to the forbidden region of . This agrees with the upper limit to of found for Seyfert 1–1.2 galaxies by Winter et al. (2008a).
Fabian et al. (2008) plotted several samples on the plane. These were a composite low-redshift sample of 23 objects from Swift and BeppoSAX, a sample of 77 sources from the Chandra Deep Field South and 13 objects from the Lockman Hole. The results provided tentative evidence for sources avoiding the forbidden region. Column densities are derived from X-ray spectra and Eddington fractions from X-ray luminosity (and a bolometric correction, Vasudevan & Fabian 2007) and importantly an estimate of the black hole mass. This was mainly done by combining K-band magnitudes of the AGN host with the correlation of Marconi & Hunt (2003). Winter et al. (2008a) find that, before application of a bolometric correction, the distributions of for absorbed and unabsorbed sources are significantly different. Here we include the bolometric correction to recover the full Eddington ratio. We present our analysis of 97 sources from the 9-month Swift BAT catalogue of AGN, with BH mass estimates (Tueller et al. 2008, Winter et al. 2008a), which is the most complete and uniform, hard X-ray flux-limited, sample of AGN. These sources lie above the Galactic Plane ( deg) and have 2MASS data for mass determination. A hard X-ray sample is important since it will be relatively insensitive to absorption (provided that the sources are not too Compton thick).
3 Results from the Swift/BAT 9-month AGN catalogue
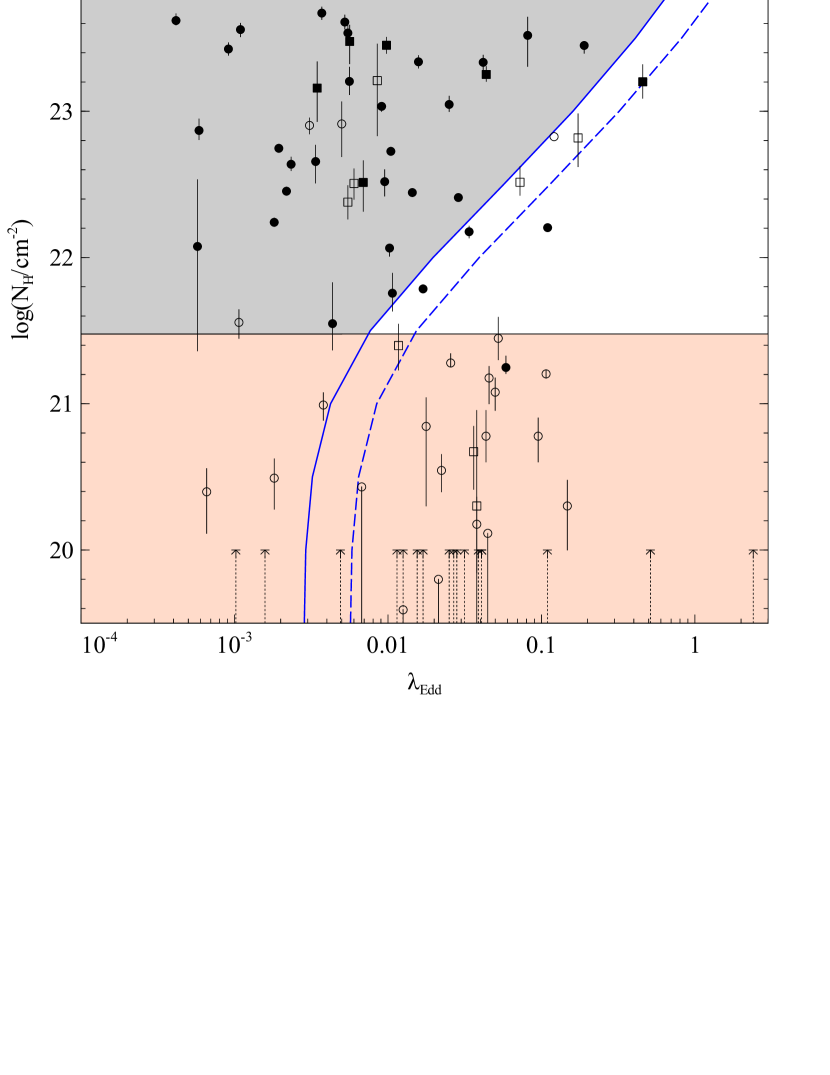
In Fig. 2 we present the column density against Eddington ratio for the 9-month Swift BAT catalogue of AGN. The column densities are presented by Winter et al. (2008a) and were obtained from fits to X-ray spectra from a variety of X-ray missions including ASCA, Suzaku, Chandra, XMM-Newton and the X-ray telescope (XRT) on Swift. The XRT fits were performed by Winter et al. (2008a) themselves, whereas the other fits were taken from the literature111The source represented in Fig. 2 by an empty circle near (0.1, 22.8) is shown after updating its parameters using archival XMM-Newton data.. The Eddington ratios are calculated using the standard formula . Winter et al. (2008a) estimate the black hole mass using the relation, using the K-band magnitudes from the 2MASS All-Sky Survey to provide bulge luminosities. The relation from Novak et al. (2006) is employed by these authors to calculate their BH masses, which are presented in Table 4 of their work. We then scale up the 2–10 keV luminosity to a bolometric luminosity using a hard X-ray bolometric correction dependent on the X-ray spectral shape. Vasudevan & Fabian (2007) find that the bolometric correction (and optical/UV/X-ray SED shape in general) depends on Eddington ratio, and the study of Shemmer et al. (2006) (and Shemmer et al. 2008 subsequently) finds a correlation between the X-ray photon index, , and Eddington ratio. This latter correlation is not reproduced by Winter et al. (2008a), possibly due to the intrinsic scatter in individual AGN accretion rates and photon indices, or a systematic deviation of lower luminosity AGN from the correlation. However, they do find correlates with in individual objects varying between observations (Winter et al., 2008b), lending credence to the possibility that spectral shape is linked to accretion rate, albeit in a non-straightforward fashion. Based on these findings, we adopt a bolometric correction of 19 for hard spectrum objects () and 55 for soft spectrum objects () and thus determine the Eddington ratios.
We note that the AGN from the 9-month BAT catalogue primarily lie in the region expected for long-lived absorption or dust lanes. There are a few objects which lie above the effective Eddington limit for dusty gas, but we note that this limit has hitherto been calculated assuming that the only inward gravitational force of importance is that from the central black hole. In reality, there may be a significant gravitational force from the stars located inward from the dusty gas clouds of interest. This would increase the effective Eddington limit by an amount proportional to the total enclosed mass, since the increased gravitational force is now able to balance a proportionately higher outward force due to radiation.
We estimate the importance of this effect as follows. If we enclose a mass equal to twice the central BH mass, the effective Eddington limit is doubled. Such a limit would allow the majority of the objects to now lie within the effective Eddington limit, with the exception of one (MCG-05-23-16). We can also comment on the constraints that such a modified effective Eddington limit would place on the location of the dusty gas clouds. The studies of Schödel et al. (2007) reveal that, in the case of our Galaxy, the enclosed mass doubles at a scale of a few parsecs from the nucleus. If nuclear star clusters often accompany AGN as the study of Seth et al. (2008) seems to suggest, then an effective Eddington limit that accounts for twice the BH mass would still comfortably locate the dusty gas clouds close to the nucleus.
4 Dust-to-Gas ratio and the Effective Eddington Limit
We note that the dust-to-gas ratio in AGN may deviate significantly from the Galactic dust-to-gas ratio (Maiolino et al., 2001). The calculations of the effective Eddington limit in Fabian et al. (2008) assume the Galactic value, via the assumption of inter-stellar medium (ISM) grain abundance in their cloudy simulations. Maiolino et al. (2001) suggest that the ratio of optical extinction to X-ray column density is systematically lower in AGN, and here we account for this effect by running further cloudy simulations with dust grain abundances reduced by factors 0.3 and 0.1 of the standard ISM abundance (Fig. 1). The effect of this alteration is signficant at low , where the effective Eddington limit is inversely propotional to the dust to gas ratio. At high column densities, the effective Eddington limit with the reduced dust-to-gas ratio converges with that for Galactic dust abundances, since atomic absorption in the gas dominates. However, since the change in effective Eddington limit at low column densities coincides with the regime where dust lanes could be responsible for the measured , this modification has little bearing on the shape of the ‘forbidden’ region in space. We note that the effective Eddington limit will also depend on the mass of the black hole, since the peak of the thermal black body in the UV depends on BH mass, but do not address this further here. The average SED used in the cloudy simulations is calculated from eight AGN SEDs with a range of BH masses (Vasudevan & Fabian, 2007) so is probably a representative choice of SED.
5 Discussion
Sources in the most complete sample of hard X-ray selected AGN available avoid the forbidden region in the plane. This is unlikely to be due to an observational selection effect since sources there should be brighter. The single source which lies in the forbidden region is MCG-05-23-016, which has a complex spectrum with warm absorbers (e.g. Reeves et al. 2007) and so not necessarily absorbed by dusty gas clouds. Our results provide strong evidence that radiation pressure from the central AGN is the main agent.
The good agreement between the distribution of sources and our allowed zones suggests that our assumptions are resonable. The radiation pressure seems to be transmitted to the whole cloud, or cloud complex, perhaps by magnetic fields. The Eddington fractions must be accurate to a factor of a few (Winter et al. 2008a suggest a factor of 3 uncertainty) and therefore the bolometric luminosities also. Our result (Fig. 2) provides a simple explanation for some of the otherwise complicated behaviour that has been reported in the relationship between absorption and luminosity in AGN (Hasinger 2008 and references therein).
There can be matter out of our line of sight in the low column density, high Eddington fraction sources but that matter will need to avoid the forbidden zone. For example it can reside in a Compton thick torus, as envisaged in many unification models for AGN.
We note that the soft X-ray bright Narrow-Line Seyfert 1 galaxies, which are generally considered to have high Eddington fractions do not show up in a hard X-ray selected sample owing to their steep X-ray spectra Malizia et al. (2008). They do not have strong absorption so would appear at the lower right of the plane.
We do not know the evolution of absorbing clouds in these galaxies, nor the evolution of the central black holes. Thus we cannot say whether the lowly-absorbed AGN have prevented clouds from accumulating or have blown away an existing population of clouds. The UV radiation from the AGN cannot vary greatly on the local dynamical timescale, where and are the radius in pc and velocity dispersion in units of , in order to obtain the agreement we see. Objects can of course appear in the forbidden zone for timescales much shorter than this. The absence of such objects argues that the luminosity of these AGN is either fairly steady or the duty cycle of high luminosity episodes is small.
What should in future become possible with large samples from XMM, Chandra and IXO is to study the evolution of the population of AGN. The distribution of AGN in the plane seen as a function of redshift should reveal in which direction they evolve. The mass doubling timescale for the black hole is assuming an accretion efficiency of 0.1. Since many of the objects in Fig. 2 have then they are growing on a timescale Gyr, which is slow. How cold gas accumulates within the host galaxy bulge and settles near its centre will determine the fuelling of the AGN and central star formation rates. Cold gas typically resides for about before forming stars in low galaxies (e.g. Kennicutt 1998), so star formation occurs faster than the black hole mass evolves. The rates at which the mass of the black hole and host galaxy bulge are changing are however both low.
The evolution of quasars means that high Eddington rate objects with short doubling times are common around redshifts of two and we can expect much higher densities of objects near the effective Eddington limit. The black hole mass is changing faster than gas is turned into stars and the effect of radiation pressure on the expulsion of gas can have dramatic effects on the mass reservoir for growing stars as well as the black hole (see Fabian 1999, Murray et al. 2005 and Fabian et al. 2008 for possible scenarios). The locus of the effective Eddington limit in the plane specifies the radius of the absorbing gas within the host galaxy and thus the masses of gas involved. Although we cannot deduce the evolution of an individual object from its position in the plane, how the population evolves may be attainable.
Our results show direct evidence for a coupling of the radiation from AGN and the surrounding gas.
6 Acknowledgments
ACF thanks The Royal Society for support, RVV acknowledges support from the UK Science and Technology Funding Council (STFC). We thank the BAT Team for their work which has made our study possible.
References
- Fabian (1999) Fabian A. C., 1999, MNRAS, 308, L39
- Fabian et al. (2008) Fabian A. C., Vasudevan R. V., Gandhi P., 2008, MNRAS, 385, L43
- Fabian et al. (2002) Fabian A. C., Wilman R. J., Crawford C. S., 2002, MNRAS, 329, L18
- Ferrarese et al. (2001) Ferrarese L., Pogge R. W., Peterson B. M., Merritt D., Wandel A., Joseph C. L., 2001, ApJ, 555, L79
- Gebhardt et al. (2000) Gebhardt K. et al., 2000, ApJ, 539, L13
- Haehnelt et al. (1998) Haehnelt M. G., Natarajan P., Rees M. J., 1998, MNRAS, 300, 817
- Hasinger (2008) Hasinger G., 2008, ArXiv e-prints, 808
- Kennicutt (1998) Kennicutt R. C., Jr., 1998, ARA&A, 36, 189
- King (2003) King A., 2003, ApJ, 596, L27
- Kormendy & Richstone (1995) Kormendy J., Richstone D., 1995, ARA&A, 33, 581
- Laor & Draine (1993) Laor A., Draine B. T., 1993, ApJ, 402, 441
- Magorrian et al. (1998) Magorrian J. et al., 1998, AJ, 115, 2285
- Maiolino et al. (2001) Maiolino R., Marconi A., Salvati M., Risaliti G., Severgnini P., Oliva E., La Franca F., Vanzi L., 2001, A&A, 365, 28
- Malizia et al. (2008) Malizia A. et al., 2008, MNRAS, 389, 1360
- Marconi & Hunt (2003) Marconi A., Hunt L. K., 2003, ApJ, 589, L21
- Murray et al. (2005) Murray N., Quataert E., Thompson T. A., 2005, ApJ, 618, 569
- Novak et al. (2006) Novak G. S., Faber S. M., Dekel A., 2006, ApJ, 637, 96
- Reeves et al. (2007) Reeves J. N. et al., 2007, PASJ, 59, 301
- Schödel et al. (2007) Schödel R. et al., 2007, A&A, 469, 125
- Scoville & Norman (1995) Scoville N., Norman C., 1995, ApJ, 451, 510
- Seth et al. (2008) Seth A., Agüeros M., Lee D., Basu-Zych A., 2008, ApJ, 678, 116
- Shemmer et al. (2006) Shemmer O., Brandt W. N., Netzer H., Maiolino R., Kaspi S., 2006, ApJ, 646, L29
- Shemmer et al. (2008) Shemmer O., Brandt W. N., Netzer H., Maiolino R., Kaspi S., 2008, ApJ, 682, 81
- Silk & Rees (1998) Silk J., Rees M. J., 1998, A&A, 331, L1
- Tremaine et al. (2002) Tremaine S. et al., 2002, ApJ, 574, 740
- Tueller et al. (2008) Tueller J., Mushotzky R. F., Barthelmy S., Cannizzo J. K., Gehrels N., Markwardt C. B., Skinner G. K., Winter L. M., 2008, ApJ, 681, 113
- Vasudevan & Fabian (2007) Vasudevan R. V., Fabian A. C., 2007, MNRAS, 381, 1235
- Winter et al. (2008a) Winter L. M., Mushotzky R. F., Reynolds C. S., Tueller J., 2008a, ApJ (accepted) arXiv:0808.0461v1
- Winter et al. (2008b) Winter L. M., Mushotzky R. F., Tueller J., Markwardt C., 2008b, ApJ, 674, 686