Identified hadron production at high transverse momenta in p+p collisions at = 200 GeV in STAR
Abstract
We report the transverse momentum () distributions for identified charged pions, protons and anti-protons using events triggered by high deposit energy in the Barrel Electro-Magnetic Calorimeter (BEMC) from + collisions at = 200 GeV. The spectra are measured around mid-rapidity ( y 0.5) over the range of 3 15 GeV/ with particle identification (PID) by the relativistic ionization energy loss () in the Time Projection Chamber (TPC) in the Solenoidal Tracker at RHIC (STAR). The charged pion, proton and anti-proton spectra at high are compared with published results from minimum bias triggered events and the Next-Leading-Order perturbative quantum chromodynamic (NLO pQCD) calculations (DSS, KKP and AKK 2008). In addition, we present the particle ratios of , , and in collisions.
pacs:
12.38.BxPertubative calculation and 13.85.NiInclusive production with identified hadrons1 Introduction
The study of identified hadron (, , )) spectra at high in p+p collisions provides a good test of perturbative quantum chromodynamics (pQCD) pQCD . In different NLO pQCD calculations, the inclusive production of single hadron is described by the convolution of parton distribution functions (PDFs), parton interaction cross-sections, and fragmentation functions (FFs) which are parameterized by measured hadron spectra. From the minimum-bias triggered collisions in the year 2003, the ) and charged pion spectra were measured at 7 GeV/ and 10 GeV/ with significant systematic errors due to the uncertainties in mean position for protons and kaons starppPID . In order to understand mechanism of hadron production, it is necessary to make a strict constraint on the quark and gluon FFs by comparing theory with experimental data. In addition, it’s also a good baseline for studying color charge effect of parton energy loss in heavy ion collisions, in which hadron spectra were measured up to 12 GeV/ starAuAuPID .
In this article, we present the spectra for identified charge pions, protons and anti-protons in p + p collisions at = 200 GeV by the STAR experiment at RHIC. The results will be compared with NLO pQCD calculations. The particle ratios of , , and in collisions will be presented and and compared with results in collisions starppPID ; stardAuPID .
2 Experiment and Analysis
The STAR main tracking detector, the TPC, covering full azimuthal angle (2) and 1.3 in pseudo-rapidity provides a way to identify charged hadrons by measuring momentum and information of charged particles. In addition, the BEMC covering 2 azimuthal angle and 0 1 in year 2005 provides deposited energy of electron, and electro-magnetic shower shape, size and position, which are used to enhance electron yields relative to other hadrons. This is helpful for re-calibrating reCalibrationMethod , which will be discussed later.
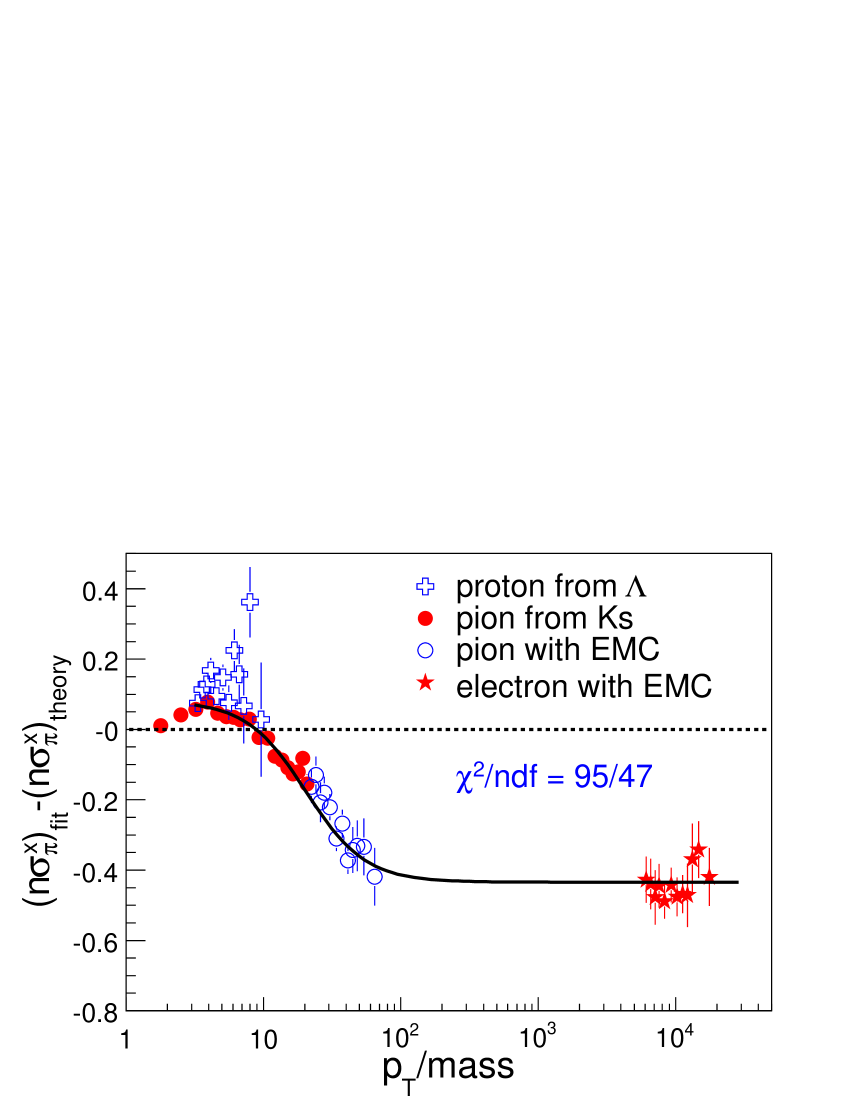
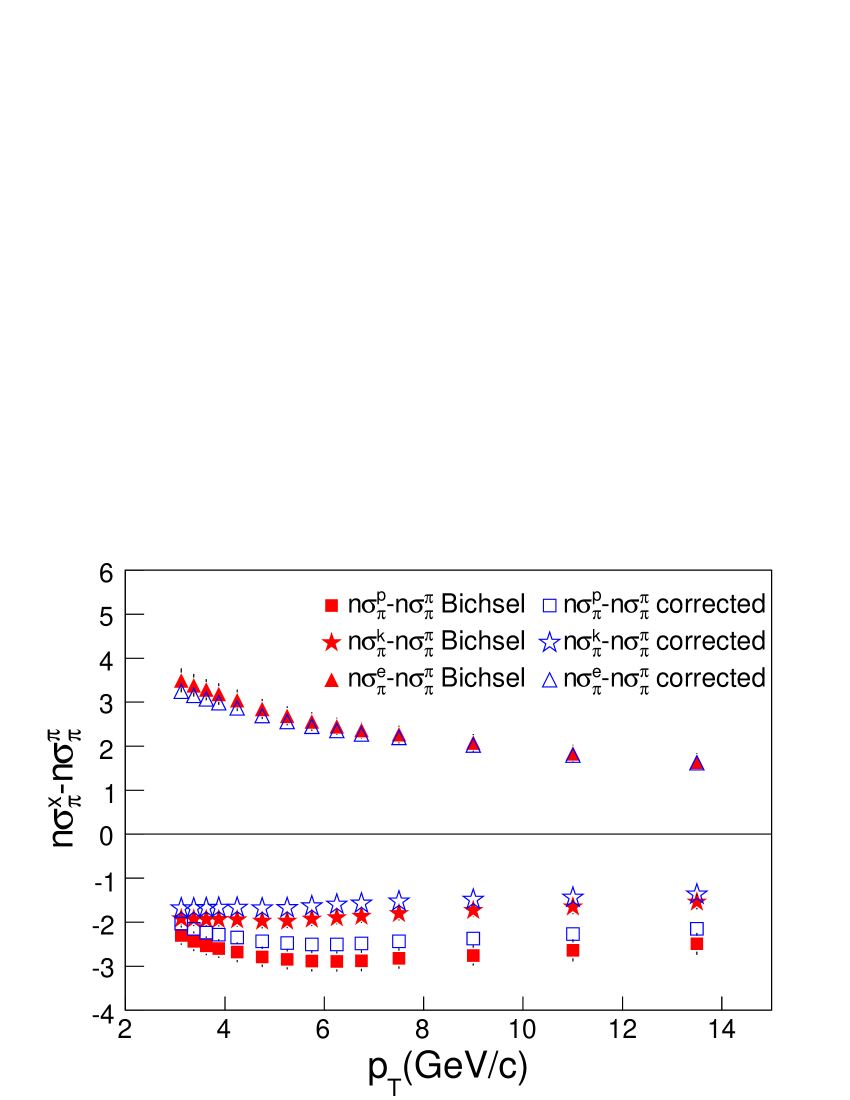
Due to empirical parameters in theory, gas multiplication gains and noise of the TPC electronics, and pileup in high luminosity environment, measured values are deviated from theoretical predictions. Dominant pion yields shadow kaons and protons in the distribution, although the separations among , , and p() are about 1-3. This results in large systematic errors due to the uncertainty of positions. Knowledge of the precise position for those hadrons is important to understand the efficiencies of particle identification (PID) selection and to reduce the systematic uncertainty in identified hadron yields. In order to improve the PID at high , the re-calibration method reCalibrationMethod is used to locate the positions for different charged particles with good precision. To separate pion and electron clearly and get of electron precisely, information of the BEMC is used to get electron enhancement data sample. Meanwhile, Strange hadrons () and are reconstructed by their decay topology to identify their decay daughters in the TPC. This provides peak position from samples of pure protons and charged pions reCalibrationMethod .
With these precise information, the left panel of Figure 1 shows the deviation of normalized by pion between data and theoretical values. This distribution is described by a function, . Meanwhile, the separation between identified hadrons and pions are derived from this fit function, as shown on the right panel of Figure 1.
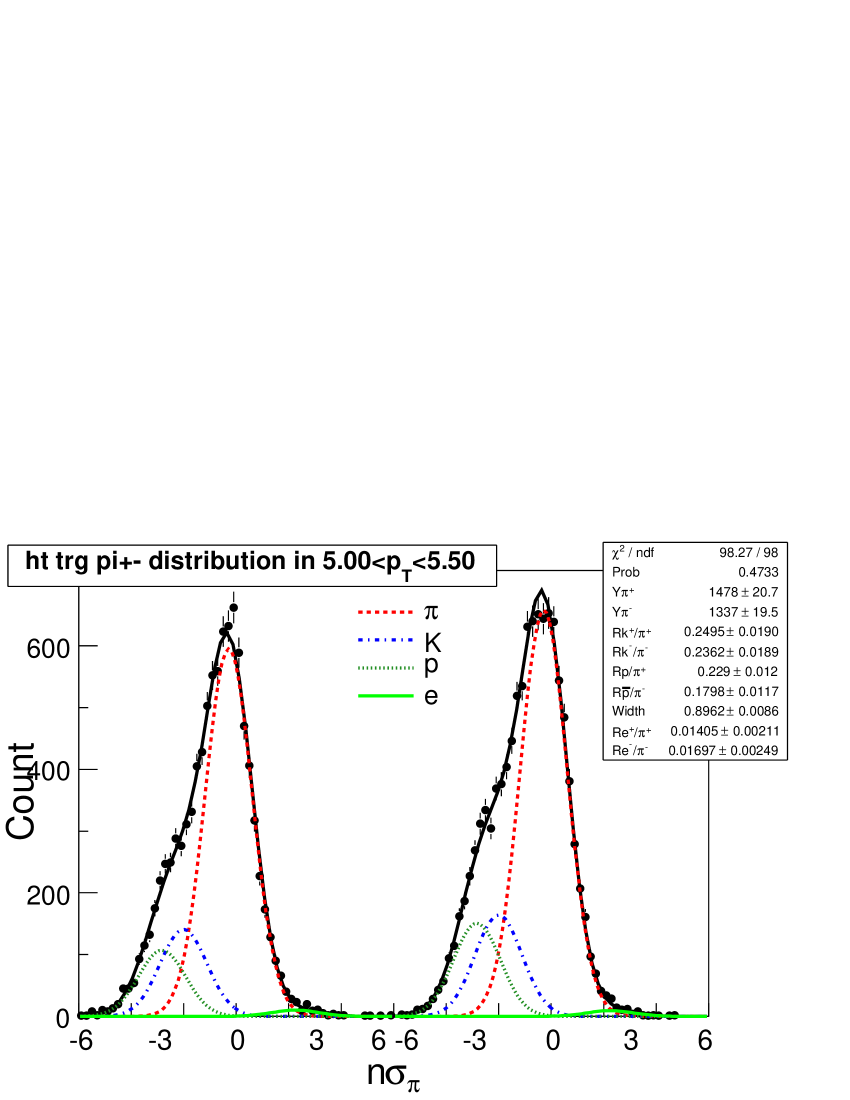
In order to extract charged pion and proton (anti-proton) yields, a total of 5.6 million BEMC triggered events in year 2005 (with transverse energy 6.4 GeV) have been analyzed. The details of BEMC trigger condition can be found in Ref. BEMC . Since pions are the dominant component of the hadrons, pion raw yields can be derived by fitting distribution using 8-Gaussian with four fixed re-calibrated parameters for peak positions. The left panel of Figure 2 shows the distribution at 5.0 5.5 GeV/c and 0.5. For proton yields, we used two methods. One method is based on track-by-track selection using a cut in . The other method is fitting distribution with fixed proton peak position. The final yields we used in this analysis are averaged from these two methods. Half of the difference ( 13) between them is included in systematic uncertainty.
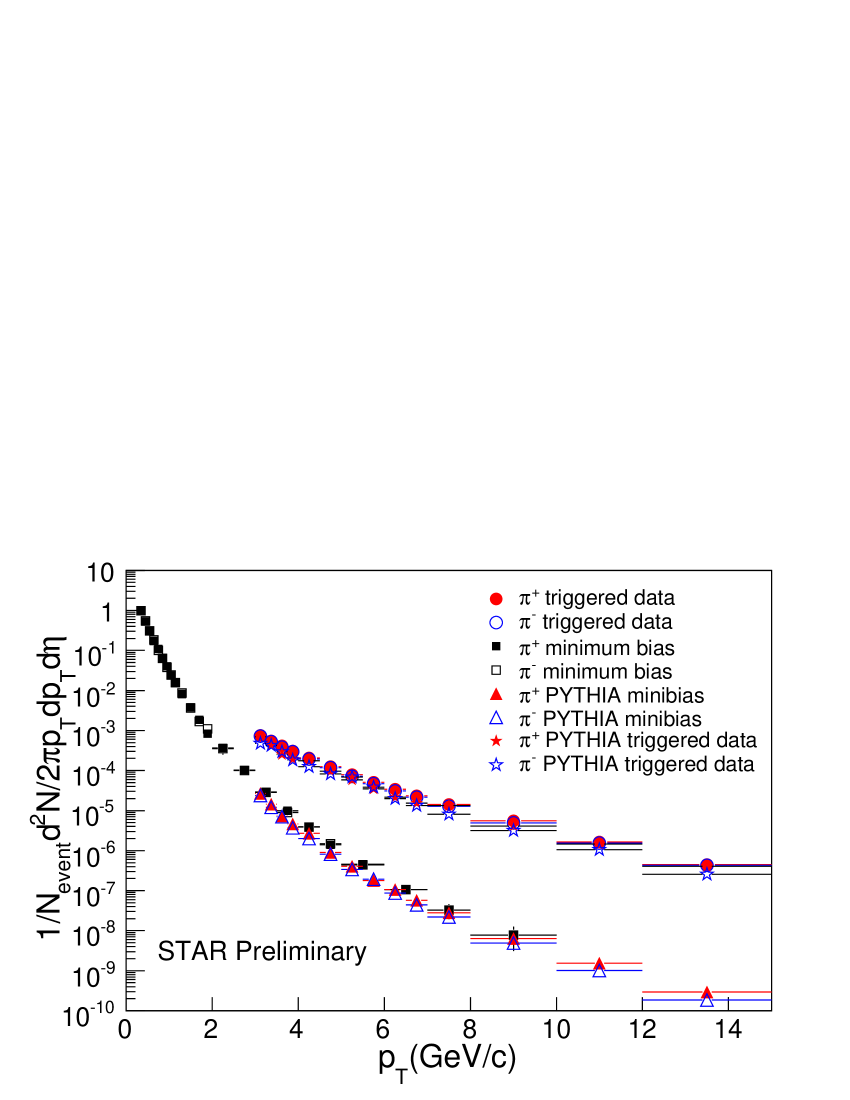
The right panel on Figure 2 shows that there is great difference between invariant yields of charged pions from BEMC triggered events (red and blue circles) and minimum bias events (black squares) because of trigger enhancement. In order to correct this effect, PYTHIA events are embedded in GEANT with STAR geometry, which can simulate the realistic response of the STAR detector in experiment, including signal of read-out and response of electronics, when tracks are propagated through detectors. With simulated signal, different triggered events are selected by passing different detector thresholds as real events in STAR experiment. On the right panel in Figure 2, stars and triangles represent charged pion spectra from simulated BEMC triggered and minimum bias events.
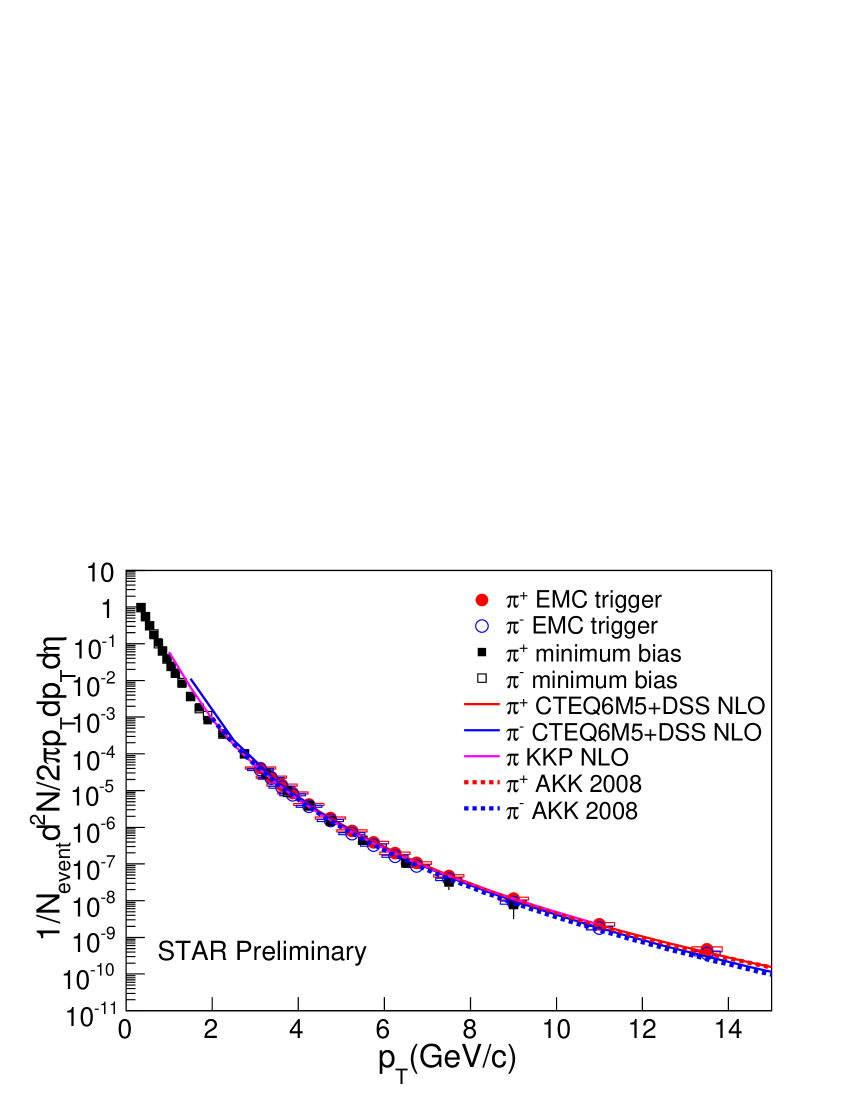
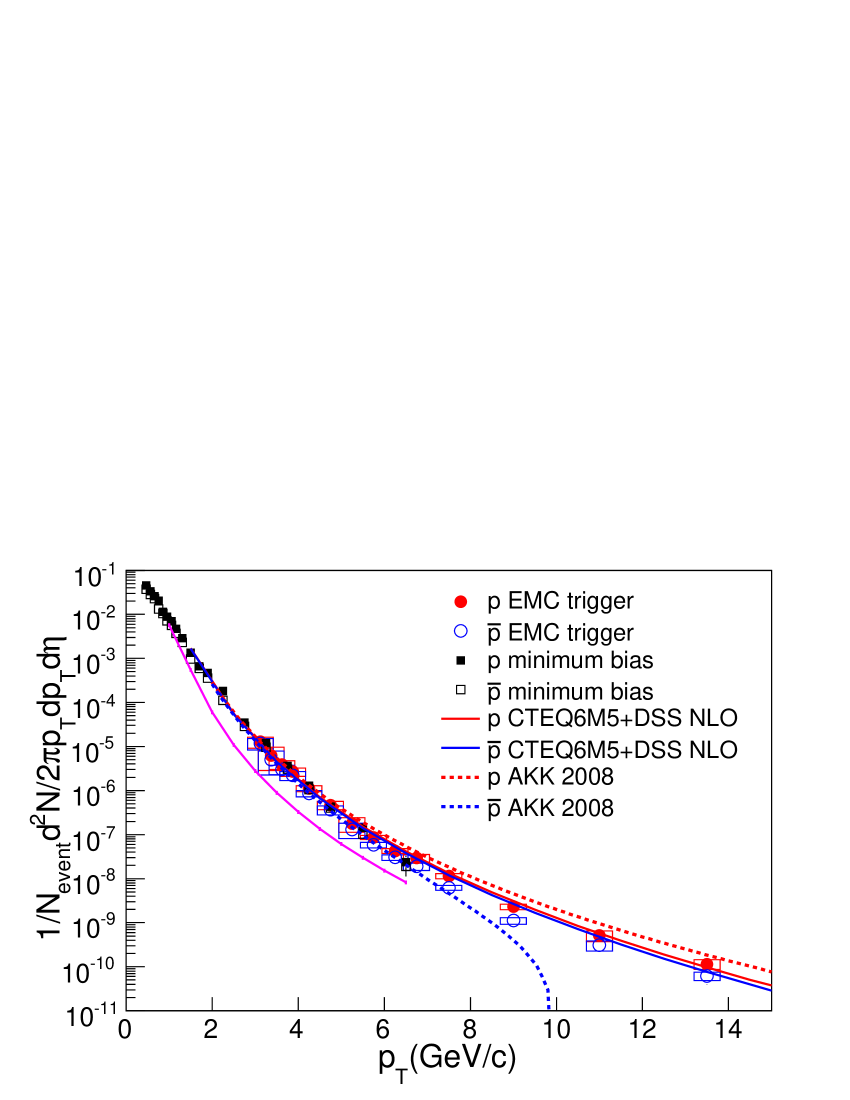
With the simulation, we can calculate the enhancement factors versus by dividing BEMC triggered spectra by minimum bias triggered spectra. With the trigger enhancement factors and tracking efficiencies (88 at 3 15 GeV/), the charged pion spectra are corrected and shown on the left panel of Figure 3. The corrected spectra of pions are consistent with minimum bias results at the overlapped range, and the NLO pQCD calculations. With and ratios, the invariant yields of proton (anti-proton) are calculated by pion spectra times ()ratios. The spectra of protons and anti-protons are shown on the right panel in Figure 3. Almost all these NLO pQCD predictions can not describe our proton and anti-proton spectra well at high , especially AKK 2008 for anti-proton, which is going down to zero at 9 GeV/ (from S. Albino private communication). The AKK 2008 AKK2008 includes BRAHMS data points at high rapidity (2.95 y 3.1) BRAHMS for parametrization. Our data will provide a good constraint for the NLO pQCD calculation.
The total systematic uncertainties associated with pion are estimated to be less than 15. The systematic uncertainty consists of uncertainty of peak position (4), charge distortion (12), momentum resolution (5) and efficiencies (5). Proton spectra have similar systematic uncertainty sources. In addition, two methods to getting proton yields results in 13 contribution.
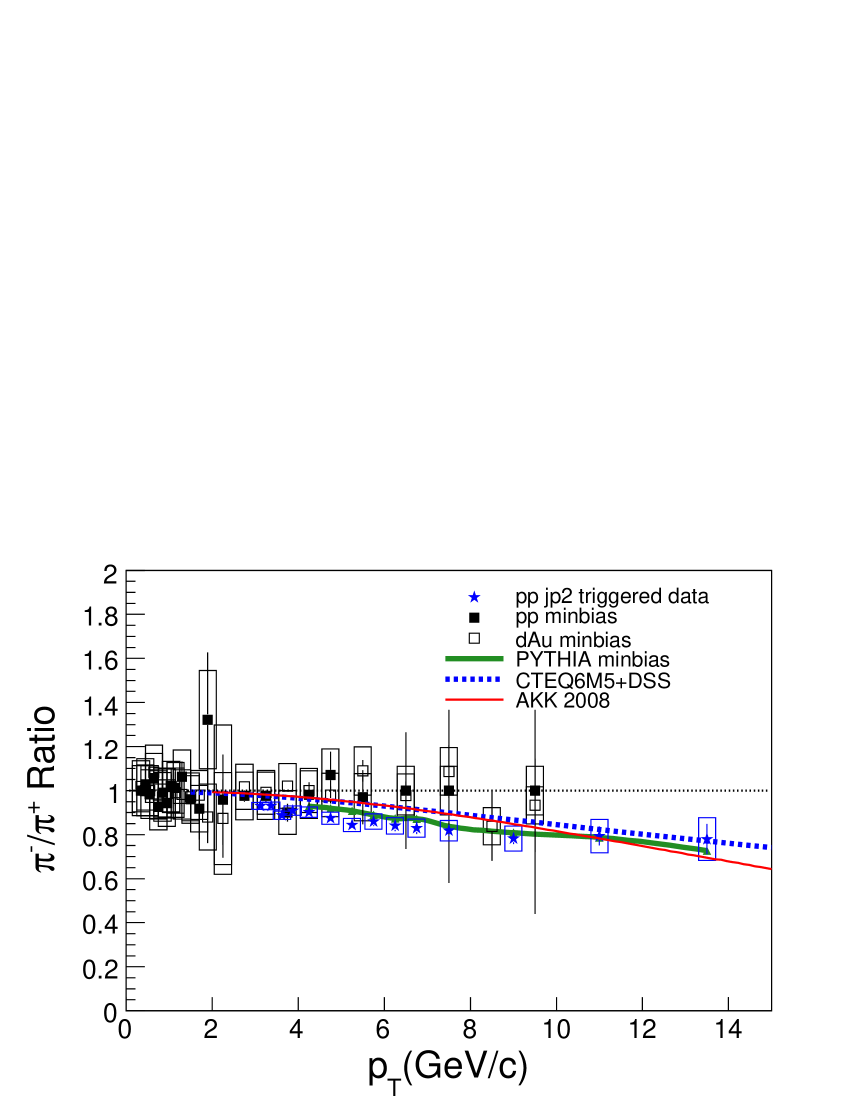
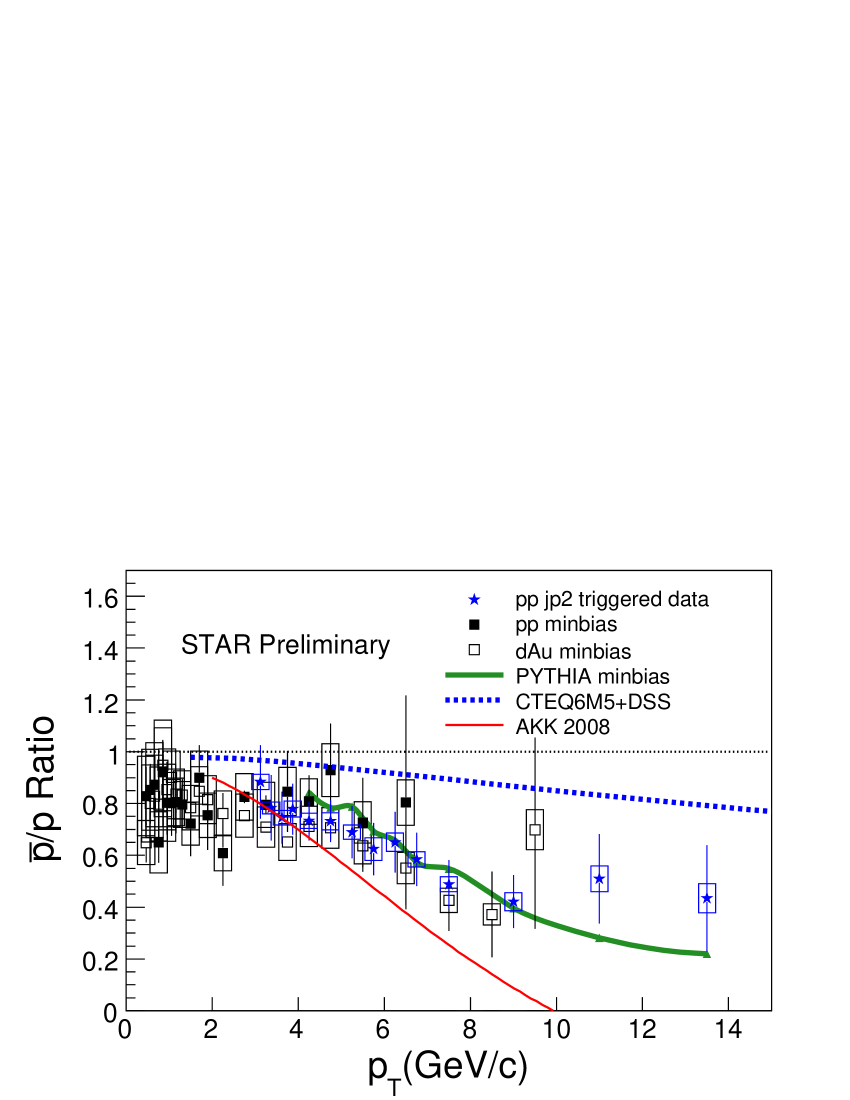
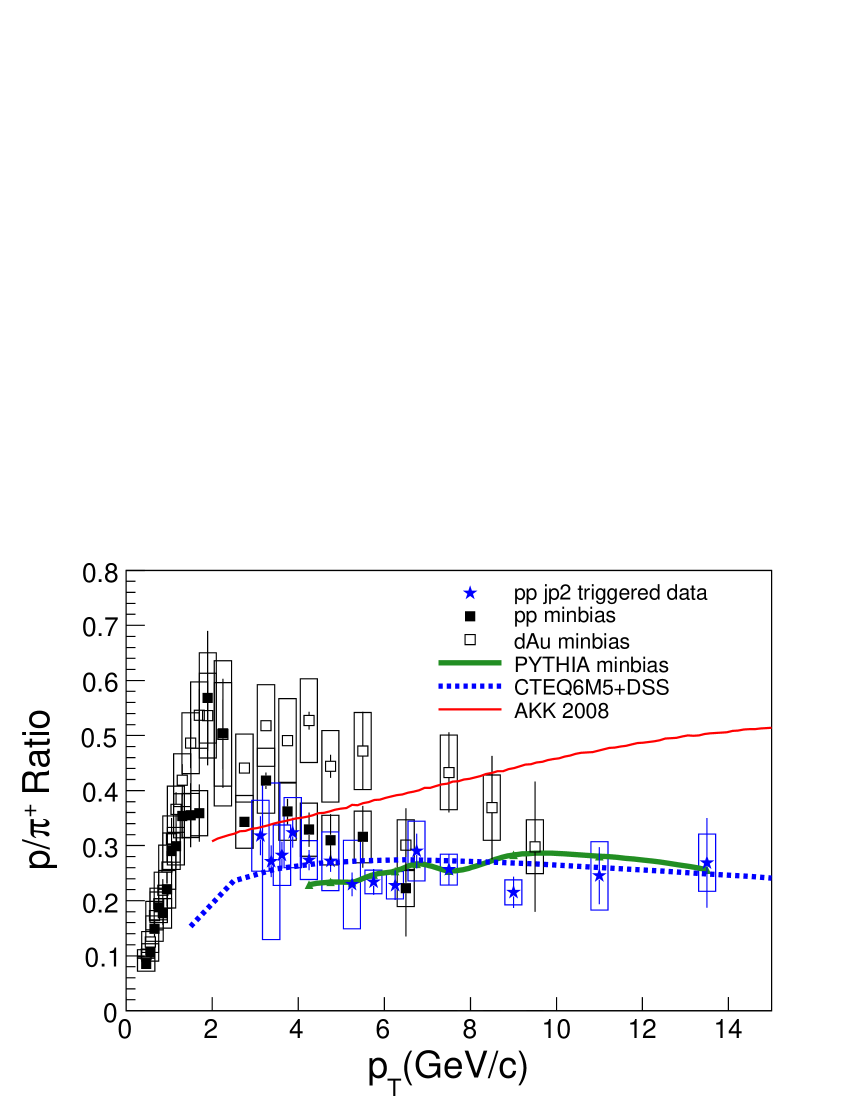
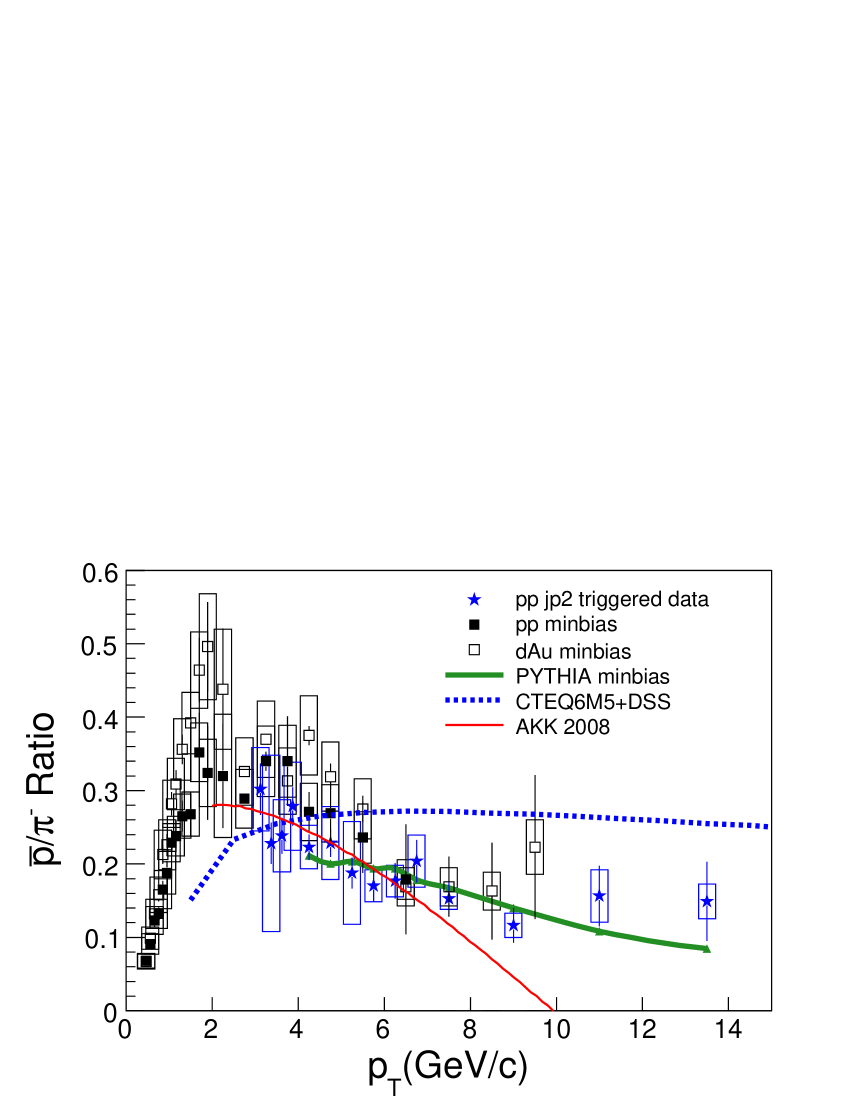
The particle ratios at mid-rapidity as a function of are shown on Figure 4, and compared with published results from minimum bias and collisions. The predictions from different model, such as PYTHIA, DSS, and AKK 2008 are also shown. All the boxes and bars represent systematical and statistical errors. Our results are consistent with those from minimum bias collisions. For the models, only PYTHIA can describe these ratios well, DSS over-predicts anti-proton, AKK 2008 over-predicts proton, and under-predicts anti-proton. The ratio from BEMC triggered events decreases with increasing , which indicates significant valence quark contribution to charge pion production. The decrease of /p ratio also indicates a significant quark contribution to baryon production. The and ratios decrease at intermediate range (2 6 GeV/) and approach constant at high , which are consistent with PYTHIA simulation. The ratio in collision is lower than that in collisions in the intermediate range.
3 Summary and discussion
We have presented transverse momentum spectra for identified charged pions, protons and anti-protons from collisions triggered by the BEMC at = 200 GeV. With PYTHIA and GEANT simulation, the transverse momentum spectra around mid-rapidity ( 0.5) are extended up to 15 GeV/ with PID by the in the TPC. Comparison of spectra to NLO pQCD predictions, DSS and AKK 2008 can describe pion spectra well, but poorly for proton and anti-proton spectra, especially AKK 2008 for anti-proton. Our data can provide a good constraint to the pQCD calculations, and furthermore, understand quark and gluon contributions. Ratios of /, , and / are consistent with PYTHIA, but inconsistent with NLO pQCD calculations, i.e. DSS over-predict anti-protons, AKK 2008 over-predict proton, and under-predict anti-proton. In addition, the decrease of / and indicate significant quark contribution to hadrons.
References
- (1) J.C. Collins, D.E. Soper, Annu. Rev. Nucl. Part. Sci. 37 (1987) 383; J.C. Collins, D.E. soper, G. Sterman, Adv. Ser. Direct. High Energy Phys. 5 (1988) 1; S. Albino et al., Nucl. Phys. B 725(2005) 181; B. A. Aniehl, G. Kramer and B. Potter, Nucl. Phys. B 597 (2001) 337; Daniel de Florian, Rodolfo Sassot and Marco Stratmann arXiv: 0707.1506; Phys. Rev. D 76(2007) 074033;
- (2) STAR collaboration, J. Adams et al., Physics Letters B 637 (2006) 161-169.
- (3) STAR collaboration, J. Adams et al., Phys. Rev. Lett. 97 (2006) 152301; STAR Collaboration, B.I. Abelev et al. Physics Letters B 655 (2007) 104
- (4) STAR collaboration, J. Adams et al., Physics Letters B 616 (2005) 8-16
- (5) Yichun Xu et al, arXiv:0807.4303.
- (6) M. Beddo et al. Nucl. Instr. Meth. A 499 (2003) 725-739.
- (7) S. Albino, B.A. Kniehl and G. Kramer, arXiv: 0803.2768[hep-ph].
- (8) BRAHMS collaboration, I. Arsene et al., Phys. Rev. Lett. 98 (2007) 252001.