Eta Carinae across the 2003.5 Minimum: Analysis in the visible and near infrared spectral region
Abstract
We present an analysis of the visible through near infrared spectrum of Car and its ejecta obtained during the ” Car Campaign with the Ultraviolet and Visual Echelle Spectrograph (UVES) at the ESO Very Large Telescope (VLT)”. This is a part of larger effort to present a complete Car spectrum, and extends the previously presented analyses with the Hubble Space Telescope/Space Telescope Imaging Spectrograph (HST/STIS) in the UV (12403159 Å) to 10,430 Å. The spectrum in the mid and near UV is characterized by the ejecta absorption. At longer wavelengths, stellar wind features from the central source and narrow emission lines from the Weigelt condensations dominate the spectrum. However, narrow absorption lines from the circumstellar shells are present. This paper provides a description of the spectrum between 3060 and 10,430 Å, including line identifications of the ejecta absorption spectrum, the emission spectrum from the Weigelt condensations and the P-Cygni stellar wind features. The high spectral resolving power of VLT/UVES enables equivalent width measurements of atomic and molecular absorption lines for elements with no transitions at the shorter wavelengths. However, the ground based seeing and contributions of nebular scattered radiation prevent direct comparison of measured equivalent widths in the VLT/UVES and HST/STIS spectra. Fortunately, HST/STIS and VLT/UVES have a small overlap in wavelength coverage which allows us to compare and adjust for the difference in scattered radiation entering the instruments’ apertures. This paper provides a complete online VLT/UVES spectrum with line identifications and a spectral comparison between HST/STIS and VLT/UVES between 3060 and 3160 Å.
Subject headings:
circumstellar matter – line identifications – stars: individual ( Car)1. Introduction
Eta Carinae ( Car) is a massive Luminous Blue Variable (LBV, Conti, 1984), that enriches the interstellar medium through major mass eruptions as it transitions from hydrogen burning to helium core nuclear energy production (Humphreys & Davidson, 1994). During the LBV phase, the star, for a relatively brief time interval, brightens as a consequence of a major lift-off of the stellar atmosphere’s outer layers. A 60 star may lose up to 10 while on the main sequence, but its pre-supernova mass is thought to be about 20 (Smith & Owocki, 2006). The LBV phase is likely an evolutionary stage which most massive stars encounter during their lifetime, before exploding as a supernova (Meynet & Maeder, 2003). Growing evidence supports that some core-collapse supernovae have LBV progenitors (e.g. Smith et al., 2007; Gal-Yam et al., 2007), enhancing the cosmological importance of the LBVs.
Eta Car has a past with LBV characteristic events. The ejecta, formed during the Great Eruption in the 1840s and the less dramatic event in the 1890s, modifies Car’s spectrum. In the 1840s more than 12 of material was ejected (Smith et al., 2003b) and formed the bipolar Homunculus with an intervening disk (Davidson et al., 2001). In the 1890s an ionized bipolar structure, the Little Homunculus, formed interior to the Homunculus with a total mass of 0.5 (Ishibashi et al., 2003). The Homunculus reflection nebula covered approximately 10″ 18″ on the sky in 2000 (Morse et al., 2001; Davidson et al., 2001), while the Little Homunculus is about 4″ in extent (Ishibashi et al., 2003). The Weigelt condensations (Weigelt & Ebersberger, 1986) are bright emission structures currently located 02 to 03 from the stellar system. They date back to the event in the 1890s based upon proper motion measurements (Davidson et al., 1995; Smith et al., 2004). A peculiar ionized region, the Strontium filament, lies within the disk (Zethson et al., 2001) and is excited by H I Balmer continuum radiation filtered by singly ionized iron (Hartman et al., 2004). The Strontium filament’s spectrum shows lines of allowed and forbidden Sr II lines but is dominated by Ti II, Ni II and Fe I. Neither H I nor He I, and only weak O I and C I emissions are observed. Outside the Homunculus, a larger nebula of thin filaments, the outer ejecta, is observed. The outer ejecta is expanding with velocities up to 2000 km s-1 (Weis et al., 2004) with a total mass of 24 (K. Weis, 2008, private communication).
Studies of the nebular emission revealed a nitrogen-enhanced but carbon- and oxygen-starved system (Davidson et al., 1986; Dufour et al., 1997). Smith & Morse (2004) observed depleted oxygen abundances but enhanced nitrogen in the ejecta located immediately outside the Homunculus, while the ejecta at larger distance has solar composition. Smith & Morse concluded that the ejecta further away from the central object was thrown long before the creation of the Homunculus and was less CNO processed. Verner et al. (2005b) suggested that oxygen and carbon are depleted by two orders of magnitude in the Weigelt condensations. The massive star that ejected this nitrogen-rich material was in its hydrogen burning evolutionary stage. Massive stars (40) are shown to have enhancements of nitrogen at the expense of carbon and oxygen. This is an abundance characteristic more pronounced due to mixing caused by stellar rotation (Meynet & Maeder, 2000, 2003). The remaining oxygen is tied up in corundum and simple molecules, leaving much of the metals in their gaseous atomic phase (Chesneau et al., 2005). The dust in the ejecta surrounding Car appears to be primarily in a dusty torus and in the outer Homunculus Smith et al. (2003b, and references therein); Smith (2002, and references therein). However, the evidence is sparse as to if carbon is bound in the dust in the system. Furthermore, the properties of dust formation in a nitrogen-rich chemistry is rarely addressed.
Eta Car has a spectroscopic period, initially discovered through variations in He I 10830 integrated flux (Damineli, 1996, and references within). The variation in excitation is accompanied by eclipse-like minima observed with UBV and BVR photometry (van Genderen et al., 2003), in near infrared JHKL photometry (Whitelock et al., 2004) and in X-ray brightness (Ishibashi et al., 1999; Corcoran, 2005). Corcoran (2005, and references therein) fine-tuned Car’s period to 20242 d (5.54 year) based on variability in the X-ray emission. Recently, Damineli et al. (2008) showed that the visible spectrophotometry and X-ray variability give consistent results. Most, if not all, observations can be explained by the presence of a companion star in a highly eccentric orbit with a 5.54 year period. A discussion about the binarity of the system can be found in several papers including Nielsen et al. (2007b), where the binary solution is compared to a single star model that attributes the spectroscopic variability from a latitudinal dependent stellar wind (Smith et al., 2003a). We adopted the binary solution for the spectral analysis presented in this paper, where the periastron passage represents the system’s spectroscopic low-state and the time outside the periastron passage is the spectroscopic high-state.
Much attention has been devoted to find direct spectral evidence for the companion star ( Car B) or signatures from the interacting winds. The X-radiation was demonstrated to originate from the wind-wind interface region (Ishibashi et al., 1999; Corcoran et al., 2001) and was modeled as interaction between a primary star ( Car A) with a dense wind (2.510-4 year-1, =500 km s-1) and a fast companion wind (10-5 year-1, =3000 km s-1; Pittard & Corcoran, 2002). Steiner & Damineli (2004); Stahl et al. (2005) detected He II in the spectrum of Car indicating the presence of a hot companion. The He II emission was demonstrated by Martin et al. (2006) to originate from the wind-wind interface where highly excited lines normally not observed in the wind spectrum of a 15,000 K star could form. Nielsen et al. (2007a) traced, with HST/STIS spectra, He I lines formed in the wind-wind interface over the 5.54 year spectroscopic period to further analyze the ionization structure of the wind and derive Car B’s orbital parameters. The spectrum of the Weigelt condensations during the broad maximum is consistent with the presence of a 37,000 K object, implying a companion star of O or WR-type (Verner et al., 2005b). Iping et al. (2005) found evidence for a hot companion by the far-UV flux behavior, but could not characterize it any further as the far-UV spectrum is modified by Car A’s extended wind and the circumstellar material. All evidence favor a scenario where Car is a massive binary.
VLTI/VINCI interferometry (van Boekel et al., 2003) infered that Car A is a prolate spheroid, extending along the polar axis of the Homunculus, consistent with a polar wind with variable velocity during the spectroscopic high-state that decreased during the 1998.0 low-state (Smith et al., 2003a). The results from van Boekel et al. agree well with more recent VLTI/AMBER interferometry, using visibility functions of He I at 2.059 m and H I Br (Weigelt et al., 2007).
Multiple HST programs monitored the spectroscopic variations in the wavelength range 117510,300 Å from 1998.0 to 2004.3. The HST/STIS data provides invaluable information about the character and geometry of Car and its ejecta, including the geometry of the Homunculus (Davidson et al., 2001) and the Little Homunculus (Ishibashi et al., 2003). The initial spectral analysis using data obtained with HST/STIS resulted in atlases for the complete medium (R30,000, 12402360 Å; Nielsen et al., 2005) and high (R110,000, 23803159 Å; Gull et al., 2006) resolution STIS MAMA wavelength region in the sightline towards the star. The high resolution modes were exclusively used for the analysis of the circumstellar absorption shells, since the narrow line absorptions not are observable in the low resolution (R8000) STIS CCD spectrum. Spectral atlases, using the HST/STIS CCD spectrum (R8000), for the Strontium filament and the Weigelt condensations are found in Hartman et al. (2004) and Zethson (2001), respectively. The Weigelt D UV spectrum was, with limited wavelength coverage, investigated with high resolution STIS MAMA spectra (Nielsen et al., 2007a). These atlases serve as a platform for further studies of Car’s ejecta and circumstellar material around other objects such as gamma ray burst progenitors (Prochaska et al., 2006; Vreeswijk et al., 2007) or other LBVs (Nielsen et al., in prep).
Weis et al. (2005); Bomans et al. (2005) did the initial analysis of Car’s VLT/UVES spectra and noted ejecta absorption lines including the Na I, K I and Ca II doublets. The VLT/UVES data were obtained during the ” Car Campaign with UVES at the ESO VLT” which is a long term project for spectroscopic monitoring of Car with VLT/UVES in two slit positions. The first slit position is centered on the star itself and provided the data used by Weis et al. (2005); Bomans et al. (2005) and is the base for the investigation presented in this paper. The second slit position is offset towards the south-east lobe of the Homunculus nebula. Stahl et al. (2005) used the scattered light spectrum at the center of this slit position in their analysis of the He II 4686 line profiles.
VLT/UVES provides the necessary spectral resolving power for spectral investigations of the ejecta at longer wavelengths. The extended wavelength coverage includes species with transitions outside the HST/STIS echelle spectral range, such as Sr II, Sc II, NH and CH+. However, the VLT/UVES spectrum is not easily compared to the HST/STIS spectra, because of the added complication of ground-based seeing coupled with nebular emission and spatially extended wind features from Car A and B that enter the larger aperture.
This paper presents the UVES spectrum between 3060 and 10,430 Å, with line identifications of the nebular emission features, the P-Cygni wind lines and the ejecta absorption. The paper provides the necessary tools for further investigations of Car’s spectrum, including an atlas with line identifications in addition to an analysis of the scattered contribution to the UVES continuum. Section 2 presents the observational data used in the analysis. Section 3 discusses the spectra of the Weigelt condensations, the circumstellar material and the stellar wind. In Section 4 we compare the column density measurements in the 513 km s-1 absorption component to understand the scattered light properties that strongly influence the VLT/UVES spectrum. The wavelength overlap between VLT/UVES and HST/STIS provides the means to investigate the UVES spectrum with respect to the scattered radiation from the central source and is invaluable for further investigations of the UVES spectrum. We discuss the wavelength region between 3060 and 3159 Å, and derive a correction factor for the added scattered stellar radiation in the UVES spectrum. The correction factor will be used in an abundance analysis of the ejecta, including all observed species in absorption, that currently is being prepared by Kober et al. The online edition of this paper includes the entire VLT/UVES spectrum with over 1500 line identifications. All wavelengths throughout the paper are in vacuum.
| HST/STISaaHST/STIS MAMA spectrum is from HST GO program 9973 (PI: K. Davidson) and is available at http://archive.stsci.edu/prepds/etacar/ or http://etacar.umn.edu/. | VLT/UVESbbVLT/UVES spectra are obtained during program IDs: 070.D-0607, 071.D-0168, 072.D-0524, 074.D-0141, 077.D-0618, 380.D-0036; PI: K. Weis. | |
|---|---|---|
| -coverage (Å) | 2380 3159 | 3060 10,430ccComplete wavelength range for these observations. Small gaps in wavelength coverage due to spacing between the CCDs. |
| 3060 4900 (blue)ddUsed wavelength range. | ||
| 4900 10,430 (red)ddUsed wavelength range. | ||
| Aperture (″) | 0.3 0.2 | 0.4 7.6 (blue) |
| 0.3 11.8 (red) | ||
| Resolving Power: | ||
| Spectral (/) | 110,000 | 80,000 (blue) |
| 100,000 (red) | ||
| Angular (″) | 0.07 | 0.391.67eeSeeing-limited. |
| Instrument | Observation Date | JDaaJD2,450,000 | Phase, bbPhase relative to X-ray minimum 1997.9604, JD2,450,799.792+2024; Corcoran (2005). |
|---|---|---|---|
| VLT/UVESccThe spectra used in this analysis is an extraction to include 85% of the flux from the central source. | 1999 Dec 21 | 1534 | 0.363 |
| 2002 Dec 7 | 2616 | 0.897 | |
| 2002 Dec 12 | 2621 | 0.900 | |
| 2003 Feb 14 | 2685 | 0.931 | |
| 2003 May 29 | 2789 | 0.983 | |
| 2003 Jun 3 | 2794 | 0.985 | |
| 2003 Jul 5 | 2826 | 1.001 | |
| 2004 Feb 20 | 3056 | 1.115 | |
| 2005 Feb 12 | 3414 | 1.292 | |
| 2005 Mar 19 | 3449 | 1.309 | |
| 2006 Apr 9 | 3835 | 1.500 | |
| 2006 Jun 8 | 3895 | 1.529 | |
| HST/STIS ddThe spectrum used in this analysis is a 00145 extraction centered on Car. | 2004 Mar 6 | 3071 | 1.122 |
2. Observations
Coordinated, highly complementary, observations were made with the HST/STIS and the VLT/UVES before, during, and after the spectroscopic low-state centered on 2003.5. The STIS spectra were obtained at critical intervals and cover the UV spectral range with high spatial and spectral resolving power. The STIS echelle observation, used in this analysis, was obtained in 2004 March with the E230H grating setting, providing a 0070 spatial resolution with 00145 spatial sampling and a spectral resolving power of 110,000 in the wavelength region 23803159 Å. The area that is covered by the STIS slit changes as a function of the spacecraft roll-angle. For this particular observation, the HST orientation angle permitted positioning of the 0302 aperture to include Weigelt B and D in addition to Car. The spectrum, used in this analysis, is an extraction of seven 00145 wide high-resolution rows (700145=0102) from the HST/STIS MAMA echelle image centered on Car. The 0102 extraction minimizes contamination from the surrounding nebula and maximized the amount of information of the stellar spectrum. To avoid potential flux modulation, we used a spectral extraction that is slightly larger than what is needed based on the instrument’s spatial resolving power. The HST/STIS data was acquired from the MAST data archive and reduced with a non-standard IDL reduction software from the STIS instrumental development team (Lindler, 1999; Valenti et al., 2002).
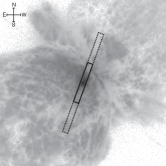
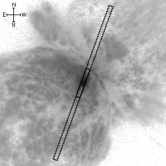
The UVES spectra cover 306010,430 Å, with small breaks due to physical gaps between the CCD detectors, with 80,000 and 100,000 spectral resolving power in the blue (c=3460 Å) and red (c=8600 Å), respectively. Spectra were obtained frequently across the 2003.5 low-state and with annual visits during the recovery period through 2006.4. All UVES high dispersion spectra were obtained with the same position angle (PA=160∘) as shown in Figure 1. While seeing was recorded by the observers to range between 039 to 167, the recorded line by line spectra have significantly larger FWHM, likely due to the extended geometry of Car. The recorded VLT/UVES spectra indicated significant larger stellar profiles along the slit compared to the observer-recoreded seeing measures. Therefore, we used a slit extraction with variable spatial width to all stellar flux down to 15 percent that of the peak flux. For the spectrum obtained in 2002 December 12 we used a 300 and 204 extraction of the blue and red aperture, respectively. For observations obtained at the other phases, extractions as large as 375 were necessary to include the bulk of the flux from the star. The UVES data were reduced with pipeline methods. The resultant spatially resolved line-by-line spectra were produced by one of the authors (O. Stahl) with tailor made software to optimize the signal-to-noise in the overlap regions. The UVES spectra are not flux-calibrated. Comparisons between different spectra were done with the continuum normalized to unity.
The UVES and STIS characteristics are summarized in Table 1 and the observational phase coverage of Car’s 5.54 year spectroscopic period is presented in Table 2. Figure 1 shows HST/Advanced Camera for Surveys optical images (GO program 9420; PI: K. Davidson) with the UVES apertures overlaid, including the portions of the apertures for which spectra were extracted for the 2002 December 12 observation.
We compare the VLT/UVES spectrum with the HST/STIS E230H in the overlap region between 3060 and 3159 Å to gain insight of what is included in the UVES aperture. We extend the analysis to the entire covered UVES spectrum. The complete spectrum is presented as an atlas with line identifications in the online edition of the paper.
3. The Car Spectrum
The Car spectrum is modulated by the 5.54 year spectroscopic period. During the greater part of the period the system is influenced by radiation from the hotter Car B and is referred to as the spectroscopic high-state. The spectroscopic high-state is characterized by a higher level of ionization particularly in the Weigelt condensations and the circumstellar material. Across Car B’s periastron passage, the system is dominated by radiation from Car A and exhibits lower ionization. The periastron passage lasts for a few months and is often called the spectroscopic minimum or low-state.
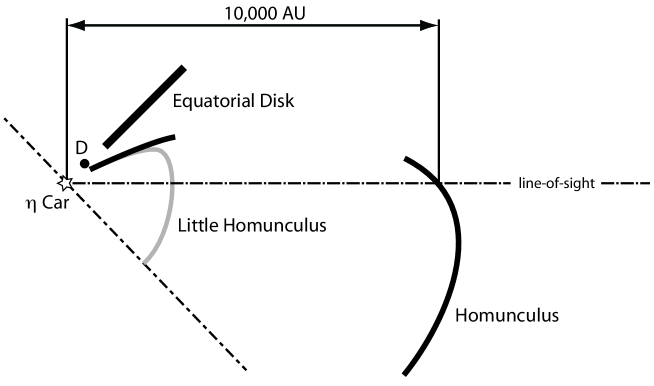
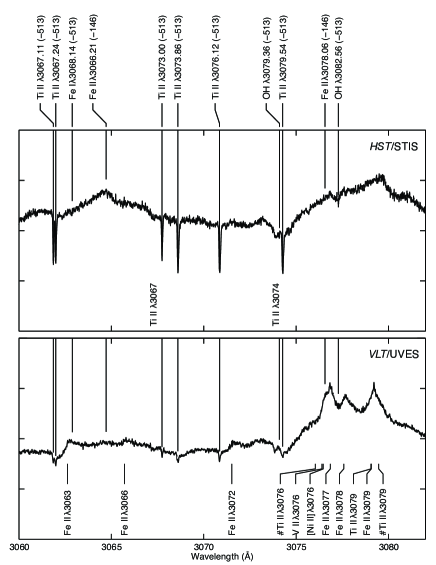
The spectra observed with VLT/UVES are seeing-limited and include extended stellar wind lines plus narrow line emission from the surrounding nebula, from the Weigelt condensations in particular. At wavelengths longward of 6250 Å, the Telluric O2 and H2O bands heavily contaminate the spectrum and significantly impair the analysis of the velocity variability and the changes in integrated flux of the stellar wind lines. In the following sections we discuss the origins of the identified lines in the spectrum, including the Weigelt condensations, the stellar wind and the circumstellar material. Figure 2 shows the current view of the system including how our sightline intersects the ejecta. Figure 3 shows an example of the UVES spectrum with identifications. It is a sample of the full spectrum that appears in the online edition of the paper. More information about the identified transitions in Figure 3 is presented in Table 3. The complete figure set, available online, is a comparison between a spectrum obtained during the spectroscopic high-state (2002 December 12, =0.90) and one recorded during the low-state (2003 July 5). The two spectra are compared over the entire VLT/UVES wavelength region (3060 10,430 Å). A reference key for the online atlas is provided in the end of the paper (Figure 11)
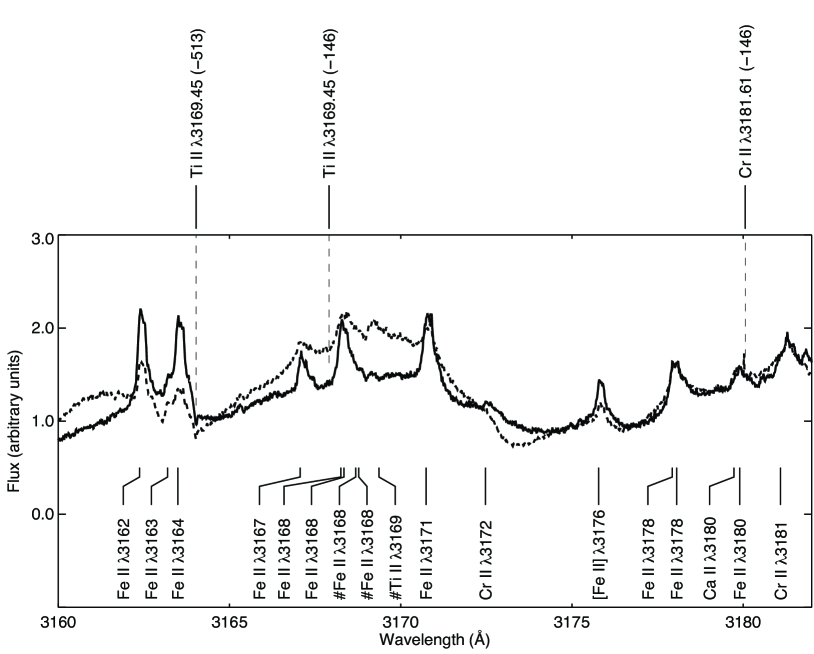
| aaCalculated observed vacuum wavelength based on the heliocentric velocity. | bbVacuum rest wavelength. | VelocityccHeliocentric velocity. | ElowddEnergy for the transitions lower state. | ||||
|---|---|---|---|---|---|---|---|
| (Å) | Line ID | (Å) | Comment | (km s-1) | (cm-1) | log | ReferenceeeReference for log . |
| 3162.37 | Fe ii | 3162.89 | em | 49 | 13905 | 2.84 | R98a |
| 3163.19 | Fe ii | 3163.71 | em | 49 | 33501 | 1.18 | R98a |
| 3163.49 | Fe ii | 3164.01 | em | 49 | 13474 | 2.85 | R98a |
| 3164.03 | Ti ii | 3169.45 | cs | 513 | 1216 | 0.14 | P01b |
| 3167.06 | Fe ii | 3167.58 | em | 49 | 13474 | 3.08 | R98a |
| 3167.91 | Ti ii | 3169.45 | cs | 146 | 1216 | 0.14 | P01b |
| 3168.25 | Fe ii | 3168.77 | em | 49 | 30764 | 0.72 | R98a |
| 3168.34 | Fe ii | 3168.86 | em | 49 | 31388 | 2.66 | R98a |
| 3168.69 | Fe ii | 3168.77 | wind | 8 | 30764 | 0.72 | R98a |
| 3168.78 | Fe ii | 3168.86 | wind | 8 | 31388 | 2.66 | R98a |
| 3169.37 | Ti ii | 3169.45 | wind | 8 | 1216 | 0.14 | P01b |
| 3170.74 | Fe ii | 3171.26 | em | 49 | 13676 | 2.61 | R98a |
| 3172.47 | Cr ii | 3172.99 | em | 49 | 35356 | 0.53 | K88 |
| 3175.78 | [Fe ii] | 3176.30 | em | 49 | 0 | 8.57 | G62 |
| 3177.93 | Fe ii | 3178.45 | em | 49 | 31483 | 0.90 | R98a |
| 3178.06 | Fe ii | 3178.58 | em | 49 | 31368 | 2.92 | R98a |
| 3179.73 | Ca ii | 3180.25 | em | 49 | 25414 | 0.51 | B72 |
| 3179.90 | Fe ii | 3180.42 | em | 49 | 38164 | 0.87 | R98a |
| 3180.06 | Cr ii | 3181.61 | cs | 146 | 20512 | 0.20 | N06 |
| 3181.09 | Cr ii | 3181.61 | em | 49 | 20512 | 0.20 | N06 |
Note. — CS, EM, WIND denotes the nature of the spectral line in the atlas, accordingly. CS is for circumstellar absorption lines, EM is emission from Weigelt D and WIND is stellar wind emission. Non-referenced data are from R. Kurucz’s Atomic Line Database (http://cfa-www.harvard.edu/amdata/ampdata/kurucz23/sekur.html). A portion of the online table is shown here for guidance regarding its content.
3.1. The Weigelt Condensations
Zethson (2001) analyzed the Weigelt D emission spectrum for the wavelength region covered by HST/STIS CCD (160010,300 Å, R8,000). We used the work by Zethson as a guide to identify the narrow emission lines from the Weigelt condensations in the UVES spectrum. The majority of the narrow lines observed with HST/STIS are also observed in the UVES spectrum. However, weak lines are overpowered by the much strong stellar radiation in the VLT/UVES spectrum. We note that the narrow component of the emission lines recorded with high-resolution (80,000) VLT/UVES are narrower than seen in the high-spatial, but lower spectral, resolution HST/STIS spectra.
The most prominent nebular features from the Weigelt condensations during Car’s spectroscopic high-state are the H I Ly-pumped fluorescent lines in Fe II, especially Fe II 2507, 2509 (Johansson & Letokhov, 2003). Transitions from higher ionization stages, such as Fe2+, Fe3+, Ne2+, were also identified in the spectrum. The radial velocities for the spectral lines in the spectrum of the Weigelt D condensation were determined by Nielsen et al. (2007b) to be 47 km s-1 for the H I Ly-pumped lines and 49 km s-1 for the allowed transitions. These derived radial velocities are consistent with previous results from Zethson (2001) and are used to identify the emission features in the VLT/UVES spectrum.
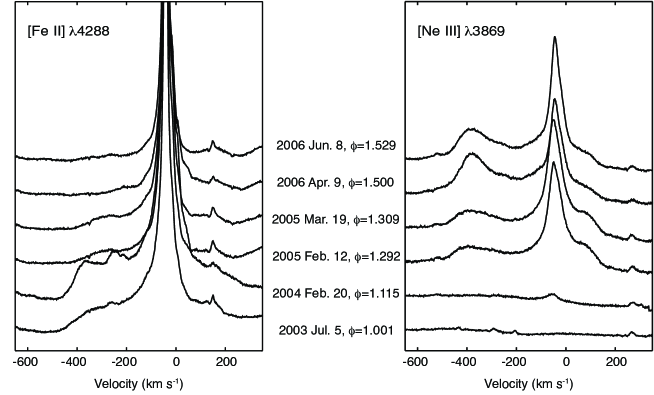
The H I Ly-pumped fluorescent lines and the forbidden lines of the highly ionized species are present during most of the 5.54 year cycle but disappear for several months during Car’s low-state, coinciding with Car B’s periastron passage. The spectral variability is attributed to the UV radiation field from the hot Car B (Verner et al., 2005b). During the periastron passage, the dense wind of Car A traps the FUV radiation from Car B in all directions. Figure 4 shows the differences in variability for the moderately ionized species, represented by [Fe II] 4288 (Fe I IP 7.9 eV), and the highly ionized [Ne III] 3869 (Ne II IP 40.9 eV) during the spectroscopic low-state and the recovery period. The highly ionized species are excited with radiation from Car B and, consequently, the most dramatic difference, as shown in the figure, is the absence of the [Ne III] 3869 at 47 km s-1 beginning at phase111phase relative to X-ray minimum 1997.9604, JD2,450,799.792+2024; Corcoran (2005)., = 1, when the far-UV radiation from Car B is cut off. The [Fe II] 4288 depends upon mid-UV radiation and can be excited in the dense wind of Car A. The narrow nebular emission shows little correlation with Car’s spectroscopic period. However, after the periastron passage (=1.115), a broad blue shifted emission feature appears at 400 km s-1. By contrast the [Ne III] 3869 is absent at =1.0 with only a weak narrow component at =1.115. As the blue shifted component for [Fe II] 4288 fades, the [Ne III] 3869 grows stronger through =1.529. The blue shifted condensation that is responsible for the emission component, is again being ionized by the far-UV radiation from Car B.
Zanella et al. (1984) noticed broad shoulders, blue-shifted up to 600 km s-1, of emission lines in their observed spectrum between 1981 and 1983. They concluded the components originated from a dense shells excited by the UV radiation from the hot core. The HST/STIS CCD spectrum, with 01 resolution, do not always show these broad shoulders since the STIS aperture, with orientation, samples a only thin slice of the wind structure. By comparing HST/STIS observations observed with different position angle and phase, we get indications of the origin of the broad emission components. A simple explanation for this emission is that it originates from the outer regions of the wind-wind interface. This would lead to a spatially resolved blue-shifted emission in highly excited lines, such as [Ne III] 3869, in a symmetric shell that is photo-ionized by Car B. In contrast, the less excited lines, for example [Fe II] 4288, are predominantly excited by the radiation from Car A.
3.2. The Ejecta Absorption
The ejecta, the Homunculus and the Little Homunculus, are oriented such that their walls intersect our sightline towards Car, leading to a major portion of the stellar radiation being absorbed (see Figure 2). Consequently, Car’s spectrum in line-of-sight is defined by the broad wind lines from Car A with nebular emission and circumstellar absorption superimposed. Gull et al. (2006) identified over 30 velocity components in the near-UV spectrum where two components, at 146 and 513 km s-1, are isolated and distinguishable from other velocity components. The Little Homunculus (146 km s-1) is observed in absorption from metastable energy levels in mainly singly-ionized iron-group elements (Gull et al., 2005, 2006). Their energy levels are populated by photo-excitation and thermal collisions. The Homunculus (513 km s-1) spectrum is abundant in narrow absorption lines in neutral and singly-ionized metals plus several diatomic molecules (Verner et al., 2005a). The 513 km s-1 spectrum is strong in the H2 Lyman bands located short-ward of 1650 Å (Nielsen et al., 2005). These transitions are from states high up in the H2 energy level system not normally populated in a cold gas. With a strong background UV source, the H2 molecules can be excited followed by de-excitation to high vibrational and rotational states in the ground electronic state. The H2 lines vary in absorption depth with spectroscopic phase, which is in agreement with changing UV radiation from the binary system. Other molecules, for example, CH and OH are present in the HST/STIS spectrum, but no CO is observed. Additional molecules are observed in the VLT/UVES spectrum at longer wavelengths, such as NH and CH+
Gull et al. (2005) presented preliminary results for the abundance analysis of the Car ejecta, based on Fe II and Ti II column densities in the 146 and 513 km s-1 velocity components, respectively. They derived column densities using a standard curve-of-growth method, where the results were used as input data for cloudy modeling. cloudy is a photo-ionization code where the energy level populations are calculated with a statistical equilibrium approach (Ferland et al., 1998). A Kurucz model atmosphere (Kurucz, 1988) with =15,000 K and =1040 ergs s-1, with carbon and oxygen 100 times depleted and nitrogen and helium 10 times enhanced, was used to mimic the radiative flux from Car A. All other metals were assumed to have solar abundances. The absorption at 146 km s-1 was determined to originate in a gas located 1300 AU from the radiative source, with a variable excitation temperature, =47005750 K, dependent on the spectroscopic phase. The absorption at 513 km s-1 is located at 10,000 AU from the stellar system and is much cooler, =760 K. However, modeling of transitions in CH and OH yield a much lower temperature (30 K, Verner et al., 2005a), indicating formation of atomic and molecular absorption in two spatially separated regions. No measurable difference in velocity between the molecular and atomic absorption lines is observed. The absorption at 513 km s-1 does not show any significant variability in atomic absorptions with phase. However, the strongly phase dependent H2 fluorescent spectrum nearly disappears during the periastron passage when the UV radiation from the central source is cut off. A more comprehensive study covering all observed species in the HST/STIS and the VLT/UVES spectra is underway (Kober et al. in prep). The results from the modeling by Gull et al. (2005) are summarized in Table 4.
The larger VLT/UVES aperture includes contributions from additional nebular structures besides the radiation from the extended, dust scattering stellar wind lines and the narrow emission from the Weigelt condensations. The narrow line nebular absorptions as seen in the HST/STIS UV spectrum extends into the VLT/UVES spectral regions. Many absorption lines at 513 km s-1 and some at 146 km s-1 are still identified and measured. VLT/UVES provides high dispersion spectra to 10,430 Åand thus the opportunity to investigate additional atomic and molecular species which are not accessible with the high spectral resolution HST/STIS MAMA. The HST/STIS CCD spectrum with low spectral resolution, extends beyond 10,000 Å but does not show any signs of absorption features from the circumstellar shells. For the 513 km s-1 component associated with the Homunculus, UVES provides information about atomic absorption lines in Sr II, Sc II, K I, Ca I, Ca II, Na I, Cr I, Ti II, V II, Ni I, Fe I and molecular lines in CH, CH+ and NH. The absorption spectrum is characterized by allowed transitions which are easier to interpret, regarding populations of the energy levels. Abundance analysis using absorption spectra provide more accurate results due to better known atomic/molecular data.
| 513 km s-1 | 146 km s-1 | |
|---|---|---|
| 760 | 6400bbThe temperatures have been revised with oscillator strengths from Raassen et al. (1998) yielding =4700 K and =5750 K. | |
| 760ccThe temperature may change between the high and low states, but the difference is within the measurement error. The accuracy of the is affected by blends due to additional velocity components that appear during the spectroscopic low-state. | 5000bbThe temperatures have been revised with oscillator strengths from Raassen et al. (1998) yielding =4700 K and =5750 K. | |
| Ionization | Neutral, Singly | Singly |
| Distance (AU) | 10,000 | 1300 |
| (cm-3) | 107 | 107108 |
| (km s-1) | 2.12.5 | 5.58.0 |
| aaThe -value is the Doppler width of the spectral line. In this definition of , is the one-dimensional rms value for a gaussian spectrum of internal trubulent velocities, the full three dimensional turbulent velocity is thus . (km s-1) | 1.41.7 | 3.85.6 |
3.3. Eta Car’s Wind spectrum
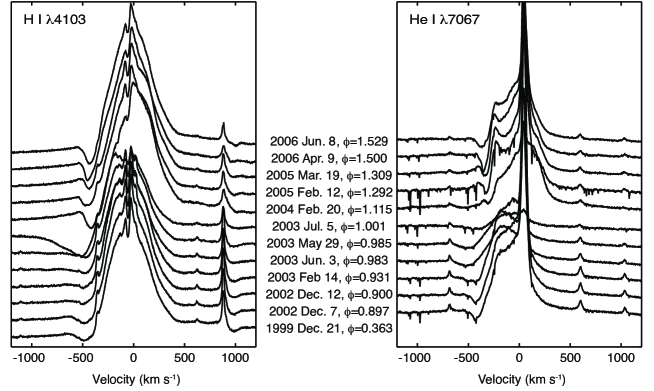
The spectral crowding of absorption features complicates observations of the wind lines in the UV. The ejecta absorption, especially by the iron-group elements, blanket the spectrum and impairs the measurements of the wind lines and their time variability. At wavelengths longward of 3000 Å the line density decreases and the wind lines, primarily from Car A, are observable. Most wind line profiles appear with a broad (550 km s-1) profile, often with P-Cygni absorption, plus a narrow (15 km s-1 centered at 47 km s-1) emission component, originating from the Weigelt condensations. The presence of the narrow emission from the Weigelt condensations impairs the analysis of the velocity variation and the variability of the emission and absorption components of the wind lines. Many wind lines show significant variations in velocity and integrated flux over the 5.54 year spectroscopic period. The line variability is dependent on where the line is formed in the stellar wind. By investigating the phase dependence, information regarding the wind ionization structure and the influence of the companion star can be extracted. The wind spectrum between 3060 and 10,430 Å is dominated by the hydrogen Balmer and Paschen series. The hydrogen lines are predominantly formed in Car A’s wind with terminal velocity of 550 km s-1. Their absorption profiles show small velocity variations, which likely are tied to the orbital motion of Car A. The weaker He I line profiles show more pronounced velocity variations as observed by Nielsen et al. (2007a). The He I lines originate from states high up in the energy level system (150,000 cm-1) and are normally not present in a 15,000 K stellar spectrum. In the HST/STIS spectrum the He I lines show complex line profiles with multiple emission and absorption components. The lines were, based on their presence, velocity variation and line profile, determined to be formed in the wind-wind interface region between the two massive objects. With a lower spatial resolving power the multi-component structure is damped in the UVES spectrum leading to a smooth line profile. Nielsen et al. (2007a) used the HST/STIS observed P-Cygni absorption to derive a radial velocity curve. However, the relation between the derived velocity and the motion of the companion star is difficult to understand. The changes in the UVES observed line profiles and their variability over the spectroscopic period are shown in Figure 5 for the H I 4103 and He I 7065. Other species with strong prominent wind spectrum are Si+ and Fe+, which due to their ionization potentials, have lines primarily formed Car A’s extended stellar wind.
4. Column Density Measurements
The abundance analysis is dependent on accurately measured elemental column densities. While the majority of the ejecta absorption lines useable for equivalent width measurements are in the HST/STIS spectrum (23803159 Å), some species are uniquely observed in the VLT/UVES spectral region (315910,430 Å). Meaningful comparisons of column densities require correcting the measured equivalent widths for all observational effects. The HST/STIS spectrum was obtained with near diffraction spatial resolution excluding emission from the surrounding nebula and the extended stellar wind. The seeing-limited spatial resolution of VLT/UVES required a larger aperture that includes the emission from the Weigelt condensations and most of Car A’s extended wind. Hence, the stellar scattered by the ejecta and the extended wind contribute to the overall stellar continuum recorded by UVES. To compare the observed spectra and equivalent widths for lines that are recorded with HST/STIS and VLT/UVES, respectively, we used the small overlap in wavelength coverage between the two instruments (3060 to 3159 Å).
The wavelength region 30603159 Å has many Ti II and V II absorption lines. A subset of the overlap wavelength region is presented in Figure 6. Ti II was used by Gull et al. (2005) to derive the physical parameters for the Homunculus. The column density is derived from a standard curve-of-growth, i.e. the equivalent width as function of the transition strength. To accurately calculate the column density for an energy state, the transitions from this energy level must be unblended, have accurately determined atomic data, and be located in a wavelength region where the continuum can be properly set. At 3000 Å the absorption line density is significantly lower, compared to the mid and far UV. The probability for blends decreases at longer wavelengths and makes the continuum placement easier, especially in the HST/STIS high-resolution spectrum that is unaffected by the strong emission from the surrounding nebula. The continuum placement for the UVES spectrum is affected by the scattered emission features from the nebula and, at longer wavelengths, the atmospheric absorption bands. In the wavelength region between 3060 and 3159 Å, the contribution from the narrow line atmospheric absorption is negligible and only a few lines are affected by the narrow emission from the Weigelt condensations. Our analysis does not include absorption lines that are obviously blended or where the continuum level could not be set with a satisfactory accuracy. Our confidence in setting the continuum is comparable for both the STIS and the UVES spectra in the wavelength region, 30603159 Å, and is helped by the narrow width of the ejecta absorption lines (2.5 km s-1). The overlap region allows us to make a direct comparison of the equivalent widths for a few Ti II lines measured in the UVES and STIS spectra. However, while using spectral lines in the overlap region to calculate a correction factor, additional Ti II lines at wavelengths outside the overlap region are included to derive and compare column densities. The Ti II transition probabilities are, with a few exceptions, derived from measured branching fractions and lifetimes (Pickering et al., 2001), complemented with data from Fuhr et al. (1988).
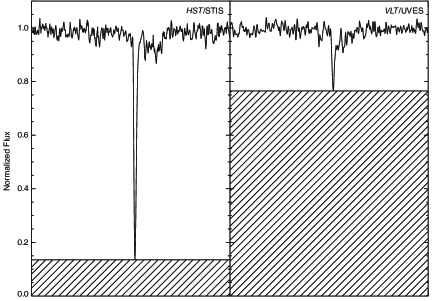
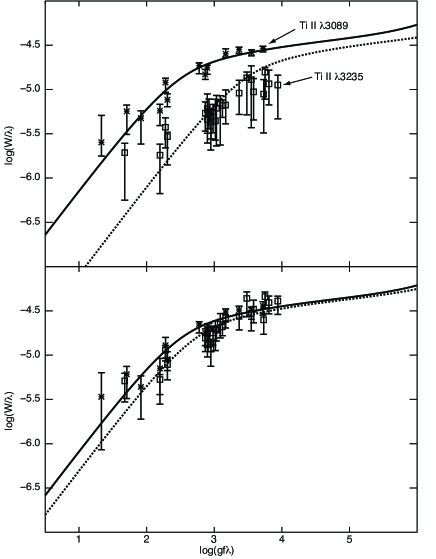
The absorption features recorded by HST/STIS are systematically deeper than identical features recorded with VLT/UVES. Hence, column densities derived from STIS spectra are larger than those from the UVES spectra. The Ti II 3089, shown in Figure 7, is nearly saturated and falls close to the flat part of the curve-of-growth (see Figure 8). However, it does not reach zero flux. The line profiles in the UVES spectrum do not show the same absorption depth, indicating a difference in detected continuum for UVES and STIS. The altered flux level may be caused by additional radiation entering the line-of-sight or instrumental effects. The latter is a combination of inter-order radiation and instrumental resolving power. The inter-order characteristics of the echelle spectrograph with a cross-dispersion grating can be examined using spectral cross-cuts of the detector image. For both instruments the inter-order contribution is small and corrected during the raw-data reduction process.
The modification of line profiles by limited spectral resolving power’s was investigated through convolving a saturated test spectral feature with a point-spread-function of desired line width to observe how the spectral line depth changes. We estimated that HST/STIS, with a spectral resolving power of R100,000, changes the depth of the spectral feature by 5-10%. This is in agreement with observations of the almost saturated Ti II 3089 in the HST/STIS spectrum. We conclude that the instrumental effects for STIS and UVES spectra are comparable in nature and do not explain the observed difference in absorption line depth.
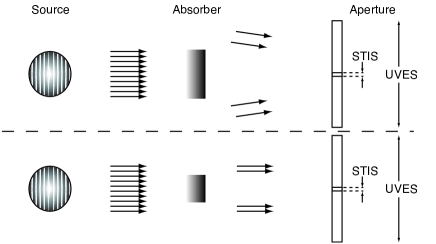
Saturated absorption lines, not reaching zero flux level, are observed in, for example, Seyfert galaxy spectra (Kraemer et al., 2002), where the absorber does not cover the entire radiative source. A similar effect is seen even if the absorbing cloud does cover the entire radiative source, but there is an added contribution to the continuum through reflected or scattered radiation (see Figure 9). With a contribution to the continuum between the absorber and the observer, the additional radiation will cancel parts of the observed absorption and a saturated line would not reach zero flux at any wavelength.
In the case of Car and its ejecta, the extended wind and the ejecta contribute scattered radiation to the stellar continuum in the VLT/UVES. The 513 km s-1 absorption is, however, originates in the Homunculus located far from the radiative source. If the scattered radiation from the extended wind and the ejecta enters the light path before being absorbed in the Homunculus, the additional radiation will not alter the spectral line depth relative to the continuum.
The correction for the altered continuum is performed by estimating the offset using saturated lines in the spectrum. If the radiative source is entirely covered by the absorbing gas, then a saturated line is expected to reach zero flux at its line center. A few Ti II lines in the spectral overlap region are close to the flat part of the curve-of-growth and, consequently, are assumed to be saturated. The Ti II 3089 is the best example of a saturated line in the overlap spectrum and is used to estimate the contribution of scattered radiation in the HST/STIS spectrum. However, a few other lines appear to be better candidates in the UVES spectrum. We have chosen Ti II 3235 to correct for scattered radiation in the UVES spectra. Ti II 3235 is clearly on the flat part of the curve-of-growth (see Figure 8) and has a well defined continuum. This spectral line is slightly blended by additional velocity component from the same transition. The contribution from the blending components to the line depth is small and the contribution to the correction factor is assumed to be negligible. Only a few lines are close to being saturated in the observed spectral region. Rather than calculate an average contribution factor from all nearly saturated lines, which would add a systematic error to the analysis, we have chosen to use one single line to calculate the correction. By adjusting the continuum in the UVES and STIS spectra, it is possible to compare column densities measured in the different wavelength regions observed by different instruments. We calculate a correction factor for the scattered radiation by subtracting the flux between zero flux and the measured line depth for a saturated line, according to Equation 1.
| (1) |
Where is the pre-normalization flux level, is the defined continuum level and is the correction factor. If the correction factor is applied to the column density measurement made in the UVES and STIS spectra, respectively, then the results are in good agreement. Figure 8 shows how we have applied the correction factor for spectral lines in the STIS and UVES region for the term in Ti II. The correction proved very effective in bringing the measured equivalent widths and derived column densities into agreement within the measurements errors. Note, to accurately calculate the influence from scattered nebular light, saturated spectral lines must be used. Otherwise, it is difficult to distinguish between contribution from scattered light and lack of absorbing material in the gas. An analysis using V II at 513 km s-1 produced similar results.
Correction of nebular, wavelength dependent, scattering properties would require a distribution of saturated spectral features throughout the wavelengths region. We do have that luxury, but must depend on lines in the blue portion of the spectrum. However, most absorption features are located in the near-UV wavelength region. For the absorption features at longer wavelength, the use of saturated Ti II lines in the near UV only provides an estimate of the amount of scattered radiation entering the VLT/UVES aperture at longer wavelengths.
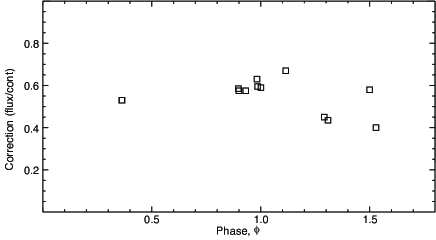
The difference in scattered radiation observed in the STIS and UVES spectra, i.e. the contribution to the UVES continuum, varies with time. We find no correlation between added radiation with seeing conditions or zenith angle, but the continuum offset may change with Car’s spectroscopic 5.54 year period, as shown in Figure 10. During the periastron passage the contribution from the scattered radiation appears to be greater compared with the rest of the spectroscopic period. This phase coincides with the phase (=1.0) when the radiation from the hot Car B is increasingly obscured and the wind opacity is higher, indicating a more efficient scatterer. While the Homunculus is time independent in atomic absorption, exciting radiation from the central source is dependent on the orbital position of Car B. Consequently, the variability in the continuum offset in the UVES spectrum is more likely associated with the scattered radiation from the extended primary wind than photons scattered by the Homunculus. If the radiation that modifies the continuum originates from the inner part of the nebula, then the absorber needs to be smaller than the radiative source. This is not fully in agreement with a Homunculus being a continuous absorber. For example, Smith (2006) depicted the emission from the Homunculus as a thin smooth skin in H2. A clumpy Homunculus is in many ways in better agreement with previous studies. The presence of molecules and singly ionized metals in the same gas observed at the same velocity, can be explained with temperature and density stratification along the Homunculus surface.
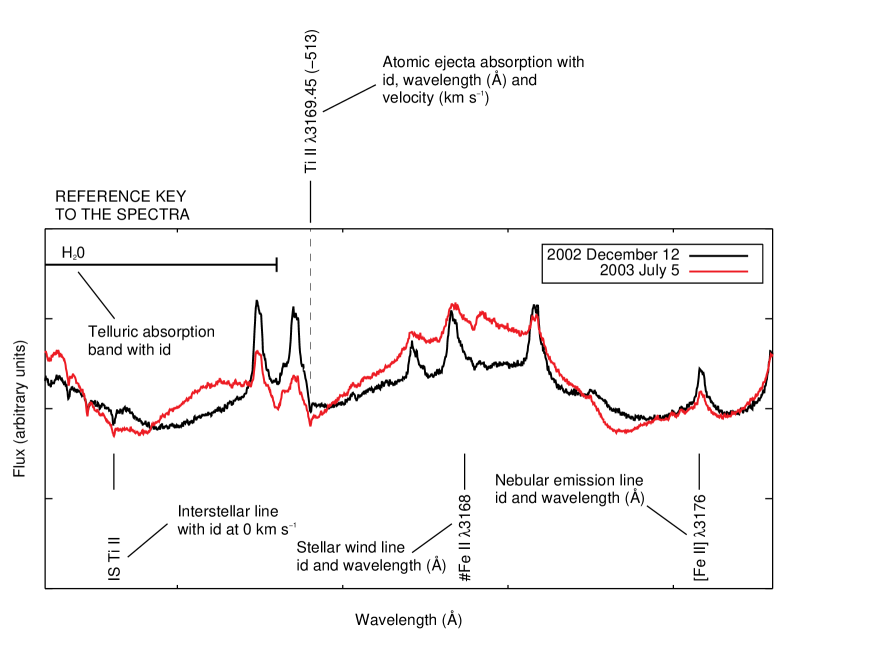
fig. set 11. The VLT/UVES spectra. [See the electronic edition of the Supplement for Figs. 11.111.347]
5. Summary
We have investigated the VLT/UVES spectrum between 3060 and 10,430 Å and identified most spectral features. The spectrum is a composite of spectral lines from Car A’s wind, emission from the surrounding nebula and the Weigelt condensations in particular, and absorption in the Homunculus and Little Homunculus. The VLT/UVES spectra, from epochs =0.900 and 1.001, are presented with over 1500 line identifications in the online edition of this paper.
The HST/STIS and VLT/UVES instruments have differences in spatial resolution and aperture size. We face the challenge to correct for the contribution of the nebular-scattered light entering the aperture. The scattered light will offset the continuum, which is a problem more pronounced for VLT/UVES than for HST/STIS spectra due to seeing and the larger aperture size.
The HST/STIS spectrum is obtained with the 03 02 aperture, but to minimize the contribution from the surrounding nebula a 7 pixel extraction (0102) was used in the analysis, providing critical separation of the stellar emission from dust scattered stellar radiation and nebular emission originating within the Homunculus. The UVES aperture is 04 76 for the blue spectrum, but we have used a subsection of the echelle image including flux from the central source down to a 15% level. The limited spatial resolution in the, seeing dependent, ground-based UV spectra explains why the curves-of-growth from these two data sets appear to show different results. The chaotic natures of the expanding ejecta within the Homunculus, the extended wind of the central source, and the many emission nebulosities lead to a velocity-smeared spectrum.
The additional flux in the HST/STIS can be explained either by the absorbing material in the Homunculus (at 513 km s-1) being smaller than the radiative source in the center of the nebula, or by additional flux enters the aperture between the Homunculus and the observer.
At the inferred distance of the Homunculus, 10,000 AU, the clumpy structure of the ejecta does not completely cover Car’s extended wind, based upon the differences in ejecta absorption profiles, yet the clumps in the Homunculus must be significantly larger than the 01 that is covered by the HST/STIS aperture, but smaller than the portion covered by VLT/UVES. The structure of the Homunculus has significance for its gas-to-dust ratio and implications for its mass. The current gas-to-dust ratio in the Homunculus is very uncertain and an improved value would increase the derived value of the Homunculus mass.
The amount of nebular/scattered light contribution, caused by scattered radiation, may change with orbital phase. This would make the correction even more problematic. Phase dependence of the scattered radiation would suggest changes with in dust properties in the central region, likely due to new grain formation/destruction or modification by the UV radiation. A possible drop in the scattered light occurs about 1.7 years (=0.3) after the spectroscopic low-states both in late 1999 and in 2005, however, the observed changes are on the same scale as the measurement errors.
We have corrected for the additional flux in the UVES spectrum with saturated Ti II lines in the blue and have shown that the correction puts the measurements from the HST/STIS and the VLT/UVES spectra in agreement within the measurement errors. The correction of scattered radiation in UVES spectrum will be used to describe the abundance characteristics of Car’s ejecta. That analysis is currently underway.
References
- Black et al. (1972) Black, J. H., Weisheit, J. C., & Laviana, E. 1972, ApJ, 177, 567
- Bomans et al. (2005) Bomans, D. J., Weis, K., Stahl, O., Davidson, K., Humphreys, R. M., & Gull, T. R. 2005, in Astronomical Society of the Pacific Conference Series, Vol. 332, The Fate of the Most Massive Stars, ed. R. Humphreys & K. Stanek, 163
- Chesneau et al. (2005) Chesneau, O., Min, M., Herbst, T., Waters, L. B. F. M., Hillier, D. J., Leinert, C., de Koter, A., Pascucci, I., Jaffe, W., Köhler, R., Alvarez, C., van Boekel, R., Brandner, W., Graser, U., Lagrange, A. M., Lenzen, R., Morel, S., & Schöller, M. 2005, A&A, 435, 1043
- Conti (1984) Conti, P. S. 1984, in IAU Symposium, Vol. 105, Observational Tests of the Stellar Evolution Theory, ed. A. Maeder & A. Renzini, 233
- Corcoran (2005) Corcoran, M. F. 2005, AJ, 129, 2018
- Corcoran et al. (2001) Corcoran, M. F., Ishibashi, K., Swank, J. H., & Petre, R. 2001, ApJ, 547, 1034
- Damineli (1996) Damineli, A. 1996, ApJL, 460, L49
- Damineli et al. (2008) Damineli, A., Hillier, D. J., Corcoran, M. F., Stahl, O., Levenhagen, R. S., Leister, N. V., Groh, J. H., Teodoro, M., Albacete Colombo, J. F., Gonzalez, F., Arias, J., Levato, H., Grosso, M., Morrell, N., Gamen, R., Wallerstein, G., & Niemela, V. 2008, MNRAS, 384, 1649
- Davidson et al. (1986) Davidson, K., Dufour, R. J., Walborn, N. R., & Gull, T. R. 1986, ApJ, 305, 867
- Davidson et al. (1995) Davidson, K., Ebbets, D., Weigelt, G., Humphreys, R. M., Hajian, A. R., Walborn, N. R., & Rosa, M. 1995, AJ, 109, 1784
- Davidson et al. (2001) Davidson, K., Smith, N., Gull, T. R., Ishibashi, K., & Hillier, D. J. 2001, AJ, 121, 1569
- Dufour et al. (1997) Dufour, R. J., Glover, T. W., Hester, J. J., Curie, D. G., van Orsow, D., & Walter, D. K. 1997, in Astronomical Society of the Pacific Conference Series, Vol. 120, Luminous Blue Variables: Massive Stars in Transition, ed. A. Nota & H. Lamers, 255
- Ferland et al. (1998) Ferland, G. J., Korista, K. T., Verner, D. A., Ferguson, J. W., Kingdon, J. B., & Verner, E. M. 1998, PASP, 110, 761
- Fuhr et al. (1988) Fuhr, J. R., Martin, G. A., & Wiese, W. L. 1988, Atomic transition probabilities. Scandium through Manganese, Vol. 17, Suppl 4
- Gal-Yam et al. (2007) Gal-Yam, A., Leonard, D. C., Fox, D. B., Cenko, S. B., Soderberg, A. M., Moon, D.-S., Sand, D. J., Li, W., Filippenko, A. V., Aldering, G., & Copin, Y. 2007, ApJ, 656, 372
- Garstang (1962) Garstang, R. H. 1962, MNRAS, 124, 321
- Gull et al. (2006) Gull, T. R., Kober, G. V., & Nielsen, K. E. 2006, ApJS, 163, 173
- Gull et al. (2005) Gull, T. R., Vieira, G., Bruhweiler, F., Nielsen, K. E., Verner, E., & Danks, A. 2005, ApJ, 620, 442
- Hartman et al. (2004) Hartman, H., Gull, T., Johansson, S., Smith, N., & HST Eta Carinae Treasury Project Team. 2004, A&A, 419, 215
- Humphreys & Davidson (1994) Humphreys, R. M. & Davidson, K. 1994, PASP, 106, 1025
- Iping et al. (2005) Iping, R. C., Sonneborn, G., Gull, T. R., Massa, D. L., & Hillier, D. J. 2005, ApJ, 633, L37
- Ishibashi et al. (1999) Ishibashi, K., Corcoran, M. F., Davidson, K., Swank, J. H., Petre, R., Drake, S. A., Damineli, A., & White, S. 1999, ApJ, 524, 983
- Ishibashi et al. (2003) Ishibashi, K., Gull, T. R., Davidson, K., Smith, N., Lanz, T., Lindler, D., Feggans, K., Verner, E., Woodgate, B. E., Kimble, R. A., Bowers, C. W., Kraemer, S., Heap, S. R., Danks, A. C., Maran, S. P., Joseph, C. L., Kaiser, M. E., Linsky, J. L., Roesler, F., & Weistrop, D. 2003, AJ, 125, 3222
- Johansson & Letokhov (2003) Johansson, S. & Letokhov, V. S. 2003, A&A, 412, 771
- Kraemer et al. (2002) Kraemer, S. B., Crenshaw, D. M., George, I. M., Netzer, H., Turner, T. J., & Gabel, J. R. 2002, ApJ, 577, 98
- Kurucz (1988) Kurucz, R. L. 1988, in Trans. IAU (Kluwer: Dordrecht), ed. M. McNally, Vol. 20B (Kluwer Academic Publishers), 168–172
- Lindler (1999) Lindler, D. 1999, CALSTIS Reference Guide http://hires.gsfc.nasa.gov/stis/software
- Martin et al. (2006) Martin, J. C., Davidson, K., Humphreys, R. M., Hillier, D. J., & Ishibashi, K. 2006, ApJ
- Meynet & Maeder (2000) Meynet, G. & Maeder, A. 2000, A&A, 361, 101
- Meynet & Maeder (2003) —. 2003, A&A, 404, 975
- Morse et al. (2001) Morse, J. A., Kellogg, J. R., Bally, J., Davidson, K., Balick, B., & Ebbets, D. 2001, ApJ, 548, L207
- Nielsen et al. (2007a) Nielsen, K. E., Corcoran, M. F., Gull, T. R., Hillier, D. J., Hamaguchi, K., Ivarsson, S., & Lindler, D. J. 2007a, ApJ, 660, 669
- Nielsen et al. (2005) Nielsen, K. E., Gull, T. R., & Vieira Kober, G. 2005, ApJS, 157, 138
- Nielsen et al. (2007b) Nielsen, K. E., Ivarsson, S., & Gull, T. R. 2007b, ApJs, 168, 289
- Nilsson et al. (2006) Nilsson, H., Ljung, G., Lundberg, H., & Nielsen, K. E. 2006, A&A, 445, 1165
- Pickering et al. (2001) Pickering, J. C., Thorne, A. P., & Perez, R. 2001, ApJs, 132, 403
- Pittard & Corcoran (2002) Pittard, J. M. & Corcoran, M. F. 2002, A&A, 383, 636
- Prochaska et al. (2006) Prochaska, J. X., Chen, H.-W., & Bloom, J. S. 2006, ApJ, 648, 95
- Raassen et al. (1998) Raassen, A. J. J., Pickering, J. C., & Uylings, P. H. M. 1998, A&AS, 130, 541
- Raassen & Uylings (1998) Raassen, A. J. J. & Uylings, P. H. M. 1998, A&A, 340, 300
- Smith (2002) Smith, N. 2002, MNRAS, 337, 1252
- Smith (2006) —. 2006, ApJ, 644, 1151
- Smith et al. (2003a) Smith, N., Davidson, K., Gull, T. R., Ishibashi, K., & Hillier, D. J. 2003a, ApJ, 586, 432
- Smith et al. (2003b) Smith, N., Gehrz, R. D., Hinz, P. M., Hoffmann, W. F., Hora, J. L., Mamajek, E. E., & Meyer, M. R. 2003b, AJ, 125, 1458
- Smith et al. (2007) Smith, N., Li, W., Foley, R. J., Wheeler, J. C., Pooley, D., Chornock, R., Filippenko, A. V., Silverman, J. M., Quimby, R., Bloom, J. S., & Hansen, C. 2007, ApJ, 666, 1116
- Smith & Morse (2004) Smith, N. & Morse, J. A. 2004, ApJ, 605, 854
- Smith et al. (2004) Smith, N., Morse, J. A., Gull, T. R., Hillier, D. J., Gehrz, R. D., Walborn, N. R., Bautista, M., Collins, N. R., Corcoran, M. F., Damineli, A., Hamann, F., Hartman, H., Johansson, S., Stahl, O., & Weis, K. 2004, ApJ, 605, 405
- Smith & Owocki (2006) Smith, N. & Owocki, S. P. 2006, ApJL, 645, L45
- Stahl et al. (2005) Stahl, O., Weis, K., Bomans, D. J., Davidson, K., Gull, T. R., & Humphreys, R. M. 2005, A&A, 435, 303
- Steiner & Damineli (2004) Steiner, J. E. & Damineli, A. 2004, ApJ, 612, L133
- Valenti et al. (2002) Valenti, J., Busko, I., Quijano, J. K., Lindler, D., & Bowers, C. W. 2002, in The 2002 HST Calibration Workshop : Hubble after the Installation of the ACS and the NICMOS Cooling System, Proceedings of a Workshop held at the Space Telescope Science Institute, Baltimore, Maryland, October 17 and 18, 2002. Edited by Santiago Arribas, Anton Koekemoer, and Brad Whitmore. Baltimore, MD: Space Telescope Science Institute, 2002., 210
- van Boekel et al. (2003) van Boekel, R., Kervella, P., Schöller, M., Herbst, T., Brandner, W., de Koter, A., Waters, L. B. F. M., Hillier, D. J., Paresce, F., Lenzen, R., & Lagrange, A.-M. 2003, A&A, 410, L37
- van Genderen et al. (2003) van Genderen, A. M., Sterken, C., Allen, W. H., & Liller, W. 2003, A&A, 412, L25
- Verner et al. (2005a) Verner, E., Bruhweiler, F., Nielsen, K. E., Gull, T. R., Vieira Kober, G., & Corcoran, M. 2005a, ApJ, 629, 1034
- Verner et al. (2005b) Verner, E. M., Bruhweiler, F., & Gull, T. R. 2005b, ApJ, 624, 973
- Vreeswijk et al. (2007) Vreeswijk, P. M., Ledoux, C., Smette, A., Ellison, S. L., Jaunsen, A. O., Andersen, M. I., Fruchter, A. S., Fynbo, J. P. U., Hjorth, J., Kaufer, A., Møller, P., Petitjean, P., Savaglio, S., & Wijers, R. A. M. J. 2007, A&A, 468, 83
- Weigelt & Ebersberger (1986) Weigelt, G. & Ebersberger, J. 1986, A&A, 163, L5
- Weigelt et al. (2007) Weigelt, G., Kraus, S., Driebe, T., Petrov, R. G., Hofmann, K.-H., Millour, F., Chesneau, O., Schertl, D., Malbet, F., Hillier, J. D., Gull, T., Davidson, K., Domiciano de Souza, A., Antonelli, P., Beckmann, U., Bresson, Y., Chelli, A., Dugué, M., Duvert, G., Gennari, S., Glück, L., Kern, P., Lagarde, S., Le Coarer, E., Lisi, F., Perraut, K., Puget, P., Rantakyrö, F., Robbe-Dubois, S., Roussel, A., Tatulli, E., Zins, G., Accardo, M., Acke, B., Agabi, K., Altariba, E., Arezki, B., Aristidi, E., Baffa, C., Behrend, J., Blöcker, T., Bonhomme, S., Busoni, S., Cassaing, F., Clausse, J.-M., Colin, J., Connot, C., Delboulbé, A., Feautrier, P., Ferruzzi, D., Forveille, T., Fossat, E., Foy, R., Fraix-Burnet, D., Gallardo, A., Giani, E., Gil, C., Glentzlin, A., Heiden, M., Heininger, M., Hernandez Utrera, O., Kamm, D., Kiekebusch, M., Le Contel, D., Le Contel, J.-M., Lesourd, T., Lopez, B., Lopez, M., Magnard, Y., Marconi, A., Mars, G., Martinot-Lagarde, G., Mathias, P., Mège, P., Monin, J.-L., Mouillet, D., Mourard, D., Nussbaum, E., Ohnaka, K., Pacheco, J., Perrier, C., Rabbia, Y., Rebattu, S., Reynaud, F., Richichi, A., Robini, A., Sacchettini, M., Schöller, M., Solscheid, W., Spang, A., Stee, P., Stefanini, P., Tallon, M., Tallon-Bosc, I., Tasso, D., Testi, L., Vakili, F., von der Lühe, O., Valtier, J.-C., Vannier, M., Ventura, N., Weis, K., & Wittkowski, M. 2007, A&A, 464, 87
- Weis et al. (2005) Weis, K., Bomans, D. J., Stahl, O., Davidson, K., Humphreys, R. M., & Gull, T. R. 2005, in Astronomical Society of the Pacific Conference Series, Vol. 332, The Fate of the Most Massive Stars, ed. R. Humphreys & K. Stanek, 160
- Weis et al. (2004) Weis, K., Corcoran, M. F., Bomans, D. J., & Davidson, K. 2004, A&A, 415, 595
- Whitelock et al. (2004) Whitelock, P. A., Feast, M. W., Marang, F., & Breedt, E. 2004, MNRAS, 352, 447
- Zanella et al. (1984) Zanella, R., Wolf, B., & Stahl, O. 1984, A&A, 137, 79
- Zethson (2001) Zethson, T. 2001, PhD thesis, Lund University
- Zethson et al. (2001) Zethson, T., Gull, T. R., Hartman, H., Johansson, S., Davidson, K., & Ishibashi, K. 2001, AJ, 122, 322