IPHAS A-type Stars with Mid-IR Excesses in Spitzer Surveys
Abstract
We have identified 17 A-type stars in the Galactic Plane that have mid-IR excesses at 8 m. From observed colors in the (r′-H)- plane, we first identified 23050 early A-type main sequence (MS) star candidates in the Isaac Newton Photometric H-Alpha Survey (IPHAS) point source database that are located in Spitzer GLIMPSE Galactic Plane fields. Imposing the requirement that they be detected in all seven 2MASS and IRAC bands led to a sample of 2692 candidate A-type stars with fully sampled 0.6 to 8 m SEDs. Optical classification spectra of 18 of the IPHAS candidate A-type MS stars showed that all but one could be well fitted using main sequence A-type templates, with the other being an A-type supergiant. Out of the 2692 A-type candidates 17 (0.6%) were found to have 8-m excesses above the expected photospheric values. Taking into account non-A-Type contamination estimates, the 8-m excess fraction is adjusted to 0.7%. The distances to these sources range from kpc. Only 10 out of the 17 excess stars had been covered by Spitzer MIPSGAL survey fields, of which 5 had detectable excesses at 24 m. For sources with excesses detected in at least two mid-IR wavelength bands, blackbody fits to the excess SEDs yielded temperatures ranging from to K, and bolometric luminosity ratios LIR/L⋆ from , with a mean value of (these bolometric luminosities are lower limits as cold dust is not detectable by this survey). Both the presence of mid-IR excesses and the derived bolometric luminosity ratios are consistent with many of these systems being in the planet-building transition phase between the early protoplanetary disk phase and the later debris disk phase.
1 Introduction
Multi-wavelength photometry remains the fundamental tool for detecting circumstellar (CS) dust around pre-main sequence and main sequence (MS) stars. Almost all MS stars known to be surrounded by dust disks have been discovered from the shapes of their spectral energy distributions (SEDs), which show excesses with respect to the stellar photospheres at infrared (IR) and longer wavelengths (Aumann et al., 1984). Since their discovery, great interest has arisen in these MS debris disk systems as they are thought to be signposts of planet formation (Zuckerman, 2001). While resolved imaging is crucial for studying the characteristics of individual systems, photometric surveys remain the key tool for inferring their statistical evolutionary properties (Meyer et al., 2007). Many surveys for dusty MS stars have used the Infrared Astronomical Satellite (IRAS) database (Aumann, 1985; Walker & Wolstencroft, 1988; Cheng et al., 1992; Oudmaijer et al., 1992; Mannings & Barlow, 1998; Sylvester & Mannings, 2000; Silverstone, 2000; Rhee et al., 2007). Cross-correlation with spectral catalogs allows a search for excess fluxes when compared to the expected photospheric emission.
The systems can be characterized by the amount of light absorbed and
re-emitted by the disk (the disk-to-star bolometric luminosity ratio
LIR/L⋆). Large values of LIR/L⋆
() are associated with massive ()
orbiting CS disks, typically found around young pre-MS systems (t
Myr), such as T Tauri and HAeBe stars. These, in addition,
often show spectroscopic signatures of material still falling
onto the central star (Waters & Waelkens, 1998). On the other hand, low LIR/L values correspond to MS stars surrounded by
older, more tenuous dusty disks (usually gas-depleted), likely to be
sustained by collisions between larger bodies (debris-disks).
CS disks can also be characterized by the wavelength at which the excess first appears. Excesses detected over a broad wavelength range (from near-infrared to millimeter wavelengths) are indicative of CS disks having dust belts located at a range of orbital radii (e.g., Dullemond et al., 2007). Short wavelength excesses ( m) indicate the presence of hot dust located in the innermost regions of the disk (r AU). Conversely, the lack of short wavelength excess flux can be modeled as due to disks with cleared inner regions, that could be caused by the presence of shepherding planets (e.g., Calvet et al., 2002; D’Alessio et al., 2005). Among disks with cleared inner region two categories are distinguishable: young gas-rich systems transitioning between their pre-MS and MS stages (e.g. 49 Cet; Hughes et al., 2008), and older debris systems that lack gas as well as planetesimal belts in the innermost regions of the disk.
The IRAS samples showed that the number of objects with 12-m excesses (but no near-IR excesses, e.g. Pictoris) was significantly lower than those with excesses at longer wavelengths, versus for excesses at m (Aumann & Probst, 1991; Cheng et al., 1992; Plets & Vynckier, 1999; Fajardo-Acosta et al., 2000; Lagrange et al., 2000; Song et al., 2001). The ubiquity of cold disks is consistent with evolutionary scenarios in which disk clearing occurs in an in-out way; material occupying the inner region of a protoplanetary disk, and its observational signatures, disappears before material in the outer disk (Backman & Paresce, 1993; Wuchterl et al., 2000; Meyer et al., 2007; Cieza et al., 2007).
With notably improved sensitivity compared to its predecessors, Spitzer Space Telescope observations have confirmed that not only do the occurrence and magnitude of infrared excesses decay with time, but that in the case of MS systems, cool dust excesses ( m, K) are systematically more frequent than hot or warm ones (detected between 2-24 m). The results of Beichman et al. (2005), Bryden et al. (2006) and Su et al. (2006) clearly indicate that 70-m excesses are more common than 24-m excesses for MS stars of a given age, but the different incidence fractions quoted appear to be dominated by the varying volumes and targeted spectral types of each sample (FGK stars in the first two cases, and A-type stars in the work of Su et al., 2006). Systems with excesses at mid-IR wavelengths (but without near-IR excesses or other signs of ongoing accretion) are far less common (Silverstone et al., 2006; Sicilia-Aguilar et al., 2006; Meyer et al., 2007; Uzpen et al., 2007). Silverstone et al. (2006) carried out m observations of 74 young (t Myr), Sun-like stars (), in order to investigate the presence of hot (220-1000 K) dust in the inner regions of CS disks and found evidence for only 5 optically thick disks, which were more likely to be pre-MS T Tauri stars and not transition- or Pictoris-like systems. Uzpen et al. (2007) cross-correlated the MSX (Egan et al., 1997) and Spitzer GLIMPSE (Churchwell et al., 2005) catalogs with the Tycho 2 Spectral Catalog (Wright et al., 2003) and inferred the incidence of 8-m excesses to be as low as for Galactic MS systems of spectral type B8 or later. A large fraction of the GLIMPSE catalog is still unexplored, as most cataloged sources lack spectral classifications.
In this work we exploit several Galactic Plane surveys in order to search a very large sample of A-type MS stars for 8-m excesses. One of the main aims of this work was to investigate the incidence of mid-IR excesses around a large unbiased sample of early A-type stars. This sample covers previously unexplored magnitude and distance ranges, allowing us to detect the optical, near-IR and mid-IR photospheric emission from A-type dwarfs out to distances of 2.5 kpc. Being abundant, luminous and devoid of circumstellar free-free emission (which can lead to false excesses as in the case of B-stars, e.g. Clarke et al., 2005), A-type dwarfs are excellent targets to search for CS dust emission. A large fraction (50%) of the debris-disks systems known to date orbit A-type dwarf stars (Silverstone, 2000; Rhee et al., 2007). Our MS A-type sample, drawn from the INT/WFS Photometric H-alpha Survey of the Northern Galactic plane (IPHAS, Drew et al., 2005; Gonzalez-Solares et al., 2008), is selected from their observed optical and IPHAS colors. This color selection scheme ensures most selected objects are near or on the MS, excluding pre-MS (such as Herbig Ae stars) and post-MS objects with prominent emission. Cross-correlating with near- and mid-IR sources from the 2MASS and GLIMPSE surveys enables their dereddened m to m SEDs to be constructed, in order to search for warm (T K) mid-IR excesses. In addition, early-release post basic-calibration -m images from the Spitzer MIPSGAL survey (Carey et al., 2005) were used to search for -m confirmation of the mid-IR excesses.
Section 2 describes our method of selecting A-type MS stars from the IPHAS database and their cross-correlation with the Spitzer data. In Section 3 we identify those sources with detectable mid-IR excesses and fit black-bodies to their excesses. The properties of the sample are discussed in Section 4, with Section 5 summarising our conclusions.
2 Observations and data processing
2.1 IPHAS
2.1.1 IPHAS Data
The INT/WFS Photometric H-alpha Survey of the Northern Galactic plane (IPHAS; Drew et al., 2005; Gonzalez-Solares et al., 2008) is a multi-national observing programme dedicated to surveying the northern galactic plane. The northern galactic latitude range of represents a total sky area of 1800 square degrees.
Two broad-band Sloan r′ and Sloan i′ filters, in
conjunction with a narrow band H filter, provide sufficient
photometric information to identify approximate spectral types for
most stars detected by the survey (Drew et al., 2008; Sale et al., 2008). The limiting
magnitude of the IPHAS survey is r. By the end
of data-taking in 2008-9, over 200 million objects are expected to be
cataloged in terms of their positions and r′, i′
and H magnitudes.
IPHAS observations are made using the Wide Field Camera (WFC) at the
2.5-m Isaac Newton Telescope (INT), La Palma, Spain. The WFC, an
imager made of four 4kk EEV CCDs arranged in an L shape,
provides a field of view of arcmins. The pixel size of
0.3333 arcsec is sufficient to provide high quality sampling of the
1 arcsecond seeing encountered at the Observatorio del Roque de
los Muchachos. The r′ filter has a central wavelength of
Å. The H filter has a FWHM transmission of Å,
centered at Å, towards the red end of the r′
filter. The i′ filter has a central wavelength of
Å. In order to account for the gaps between CCDs on the WFC,
observations for a given field of view are paired with a second
observation offset arcmin-West and arcmin-South. These are
usually referred to as the on and off exposures of a given
field. The total number of pointings required to cover the survey area
is 7635, with most sources being imaged at least twice. The exposure
time in the H filter was s, while for the r′
filter the exposure time was s and for the r′ filter it
was s. The saturation limits (r mag) are
discussed by Drew et al. (2005) and Gonzalez-Solares et al. (2008).
The data are processed at the Cambridge Astronomical Survey Unit (CASU111http://apm2.ast.cam.ac.uk/cgi-bin/wfs/dqc.cgi) as described by Irwin (1985) and Gonzalez-Solares et al. (2008). Sources are classified following their extraction characteristics, e.g., 0 = noise like, 1 = non-stellar, -1 = stellar, -2 = probably stellar, -9 = saturated. Photometric standards observed during the night are used for flux calibration in each passband. Astrometric solutions are initially derived based on the known telescope and camera characteristics, and then refined using the 2MASS catalogue (Gonzalez-Solares et al., 2008). The distribution of position discrepancies between IPHAS and 2MASS is roughly Gaussian, with a peak at 0.0 arcsec, and has a standard deviation of 0.1 arcsec. Hence, the astrometric precision of IPHAS with respect to 2MASS is assumed to be better than 0.1 arcsec (Gonzalez-Solares et al., 2008).
In recent processing (Gonzalez-Solares et al., 2008), the nightly H zeropoint is set at a constant offset of 3.14 with respect to the zeropoint, defined by the flux difference between the narrowband and transmission profiles convolved with Vega’s spectrum (Bohlin, 2007). This assures that is brought to zero for unreddened Vega-like stars. At the time the work was carried out for this paper an earlier method of H calibration was in use that meant the was not anchored in this way (see, Drew et al., 2005). This had implications for the extraction of A-dwarf candidates which we discuss below. After processing, a final catalog for a single pointing can contain from ten to fifty thousand objects (stellar and non-stellar).
2.1.2 A-dwarfs in the versus plane
The equivalent width of the photospheric H absorption feature
peaks at early A-types. As a consequence, for a given r′
magnitude and reddening, the (r′- H) color of an
A-type star will be a minimum compared to that of other stellar
types. Drew et al. (2005) computed the synthetic IPHAS
and colors for
stars of various luminosity classes and spectral types present in the
catalog of stellar SEDs by Pickles (1998), and investigated their
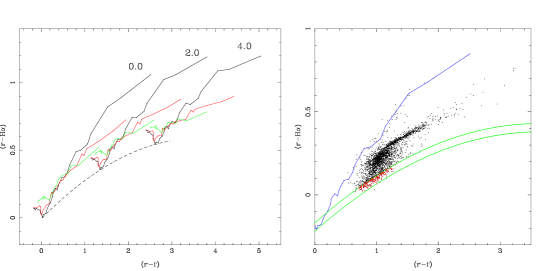
variations for different amounts of interstellar reddening. Figure
1 (left-panel, adapted from Drew et al. (2005)), shows a
synthetic IPHAS color-color diagram. The positions of main sequence,
giant and supergiant stars are mapped for three different values of
. It can be seen that, as the reddening increases, the minima
of the loci of MS stars trace out an approximately parabolic line. Due
to their strong H absorption, this line traces the positions
of MS early A-type stars in the ,
plane as a function of reddening.
Consequently it has been named the early-A reddening line.
Objects near this line will mostly be A0-5 near-MS stars. How this is
so and how these stars may be extracted and exploited has been
presented Drew et al. (2008).
2.1.3 Selection of A-dwarf stars
In order to obtain a sample of early A-type stars that can be
cross-correlated with the GLIMPSE point-source catalog, all the
available IPHAS data for regions that overlapped with the GLIMPSE
survey were downloaded ( l and ). To ensure the
quality of the sample, we restricted the search to objects having
magnitudes between and to
fields that had seeing better than arcsec. In addition,
objects had to be flagged as stellar or probably stellar by CASU in
all 6 IPHAS exposures to be selected (, i′ and
H in both on- and off- observations). Only 44% (134 of 298)
of the IPHAS fields for this region had been obtained at the time that
this investigation commenced. A complete list of the relevant
processed IPHAS catalogs is presented in Table 1. The
central coordinates of each pointing are listed in both Equatorial
J2000 and Galactic coordinates, arranged in order of increasing
galactic longitude. Column 6 gives the average seeing measured at the
Observatorio del
Roque de los Muchachos during the on and off
integrations for each field. Field numbers (column 1) correspond to
internal IPHAS field names.
In each IPHAS field, the lower edge of the main stellar locus in the plane will always follow the aforementioned early-A reddening line. Therefore, this line can be used as the cut line for selecting A-type stars (Drew et al., 2008). First, the position of the early-A reddening line had to be defined interactively, allowing for an empirical shift to deal with the floating zero-point magnitude, then in use (in principle the early-A reddening line should originate close to = (0,0), but the variable zero-point magnitude requires that the origin of the A-type reddening line has to be placed interactively for each IPHAS field).
Once a good alignment between the A-type reddening line and the lower edge of the loci of MS stars has been achieved, all stars located between the fitted early-A reddening line and a second cutoff line will be selected as A-type candidates. This defines an early-A reddening strip, starting from the location of the fitted early A-type reddening line upward (e.g. as in Figure 1, right-hand panel). The choice of width for each field was made after inspection of the color-color diagram for each field individually. The guiding principle was to make this width large enough to be inclusive of the great majority of A dwarfs. This approach inevitably admits some interlopers, mainly of somewhat later spectral type, but these can be eliminated at the later SED-fitting stage of the analysis. The width of the strip was required to never exceed 0.07 mag and was typically 0.05 mag (cf. the detailed discussion by Drew et al. (2005) of this point). Once the early-A reddening strip had been defined, the programme identified all stars lying within the strip and extracted the corresponding stellar coordinates, together with their photometric information (ri H magnitudes, associated uncertainties, extraction parameters, and 2MASS JHK photometry, if available).
Table 1, column 7, summarizes the numbers of objects cataloged in each field, which provide the input for A-type star extractions. Column 8 shows the number of A-type dwarfs extracted for each IPHAS field. Of a total of 260,223 input stars, 23,050 were selected as early A-type dwarfs on the basis of their IPHAS colors, corresponding to of the total field stars.
2.2 GLIMPSE
GLIMPSE - the Galactic Legacy Infrared Mid-Plane Survey Extraordinaire (Churchwell et al., 2005) - is a fully sampled, confusion limited, 4-band near- to mid-infrared survey of the inner third of the Galactic disk, with a spatial resolution of 2 arcseconds at the shortest wavelengths (Benjamin et al., 2003). Using the Infrared Array Camera (IRAC, Fazio et al., 2004), GLIMPSE imaged 220 square degrees at wavelengths centred on 3.6, 4.5, 5.8, and 8.0 m in the Galactic longitude range 10 to 65 degrees on both sides of the Galactic Centre, over a Galactic latitude range of +/- 1 degrees. The photometric sensitivity of 0.3 mJy achieved by GLIMPSE at 8 m in lower background areas (see Table 2) can allow the unreddened photospheres of early A-type dwarfs to be detected out to nearly 2 kpc, and is the deepest mid-IR survey of the Galactic plane carried out to date. GLIMPSE data products come as point-source catalogs and flux-calibrated mosaic images for each IRAC band, available at the Spitzer Science Centre (SSC222http://ssc.spitzer.caltech.edu/) server. The nominal 8 m flux-limit of the GLIMPSE Highly-Reliable Catalog of 10 mJy would imply that bare photospheres of A-type stars can be detected out to distances of pc.
The GLIMPSE Highly-Reliable Catalog contains point-like sources
whose selection requirements meet a reliability criterion,
determined by the fact that a source must be detected twice in one
band and at least once in an adjacent band. This is called the
2+1 criterion. The fluxes in the two bands satisfying the
2+1 criterion must be higher than the flux limits listed in
Table 2 and are required to have signal-to-noise
ratios (S/N) greater than 5. For the other two bands, the fluxes may
be lower than the survey flux limits, provided they have S/N.
Therefore, the GLIMPSE catalog can contain sources significantly fainter
at 8 m than the nominal 10 mJy limit. For the 4 s integrations used
by GLIMPSE, the estimated 8 m 5 point-source sensitivity for
low backgrounds is 0.4 mJy, equivalent to 13th magnitude
333http://www.astro.wisc.edu/sirtf/. The catalog
contains million sources.
The IPHAS A-type sample was correlated with the GLIMPSE catalog,
imposing a maximal radial separation of 1 arcsec. No multiple
associations were found at this matching radius. Column 9 in
Table 1 summarizes the results from the IPHAS-GLIMPSE
A-type star correlation procedure. Of the 23050 IPHAS-selected A-type
stars, 15312 have reliable detections in at least 2 IRAC bands. Of
these 15312 objects, 11198 have positive detections in all 2MASS
near-IR bands. Source counts in the GLIMPSE catalog drop by a factor
of three from IRAC 3.6 and 4.5 m to IRAC 5.8 and 8 m
(Benjamin et al., 2005). This is reflected in the number of correlated
sources detected at 5.8 and 8 m (5111 and 2751 stars
respectively, as shown in Table 3). Imposing the
requirement that the selected stars must be detected in all 2MASS and
IRAC bands led to a sub-sample of 2692 A-type stars with fully sampled
to -m SEDs. These 2692 stars obtained from the
IPHAS/GLIMPSE correlation will be referred as the GLIPHAS sample
hereafter.
The distribution of positional discrepancies between the GLIMPSE positions versus the 2MASS positions for the GLIPHAS sample peaks at 0.23 arcsec, with typical dispersions of 0.07 arcsec (as described in both the GLIMPSE Data Release and in the GLIMPSE Quality Assurance documentation available in the Team’s website). Therefore, there is an average systematic offset of 0.2-0.3 arcsec between the GLIMPSE and 2MASS positions which should reflect in the IPHAS-GLIMPSE correlation (since the IPHAS positions are tied to 2MASS). The distribution of radial distances between the IPHAS and GLIMPSE positions is shown in Figure 2. The distribution is approximately Gaussian, peaks at 0.36 arcsec and has a standard deviation of 0.11 arcsec. The mean IPHAS-GLIMPSE offset of 0.36 arcsec is slightly larger than the 0.2-0.3 arcsec expected by assuming the IPHAS-2MASS mean offset is zero and the GLIMPSE-2MASS mean offset is 0.23 arcsec. However, as stated in the GLIMPSE Data Release documentation, the offsets between GLIMPSE and 2MASS sources can be larger for fainter sources due to poor centroiding. As we are tackling the faint end of the GLIMPSE dataset, we believe this may be responsible for the small increase between the GLIMPSE-2MASS and IPHAS-GLIMPSE mean offsets.
The probability of possible confusing sources can be estimated by considering the average source density of the two catalogues over the surveyed area, multiplied by the area of each cross-correlation (). There are 7 million GLIMPSE sources within the surveyed region ( l and ). However, most IPHAS A-type stars will have 3.6-m magnitudes brighter than 14 (based on reddening estimates from the colors and assuming A-type colors; Section 3 for details). After removing stars with [3.6], there are GLIMPSE stars that could possibly contaminate the IPHAS cross-correlation (corresponding to a source density of arcsec-2 over the 70 deg2 surveyed area). Therefore there is a 2% chance of false positives in the search for positional coincidences, implying that amongst the 2692 GLIPHAS A-type stars there could be up to 56 contaminating objects ().
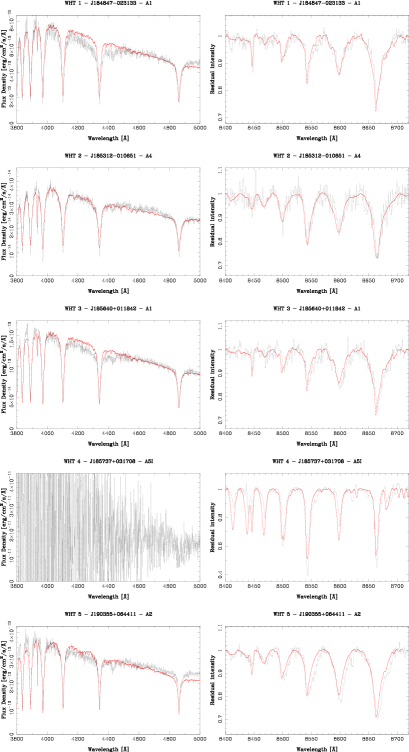
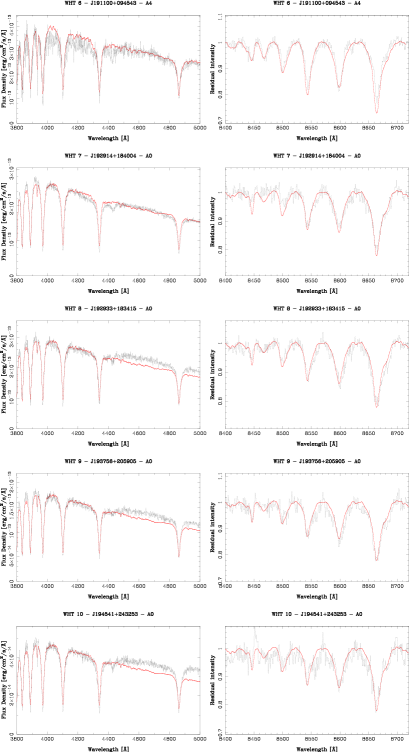
2.3 WHT optical spectra of IPHAS-selected A-type stars
Optical spectra of 18 IPHAS A-type star candidates, 10 of which are in the GLIPHAS sample, have been acquired in order to test the reliability of our photometric spectral-type selection method. The data were acquired using the Intermediate dispersion Spectrograph Imaging System (ISIS) on the 4.2-m William Herschel Telescope (WHT) during the nights of 2006 August 23 and 24, using two different gratings to simultaneously cover the blue (central wavelength 4249 ) and red (7506 ) regions. Seeing conditions ranged between 1.2 to 2 arcsec on both nights.
Standard data-reduction procedures were performed using the FIGARO Starlink444http://www.starlink.rl.ac.uk/ application. These included bias-subtraction, flat-fielding, sky-subtraction, extraction, wavelength calibration and relative flux calibration. The red exposures showed strong fringing (typically on scales of the order of 10 to 20 pixels). This, along with other pixel-to-pixel variations, was removed during the flat-fielding process. No attempt was made to correct for the grating efficiency using the flat-field exposures; it was instead removed during the flux calibration. The spectral resolution as measured from the FWHM of arc lines was found to be 4.25 in the blue and 3.32 in the red. The dispersion solution was estimated to be good to 0.01 in the red region, while in the blue it was found to be accurate to 0.04 . Flux calibration was performed using the optimal extraction method (Horne, 1986) using BD+28o4211 (Oke, 1990) as a relative flux calibrator.
Spectral classification was performed by comparing the WHT spectra with early-type template spectra from the Indo-US Library of Coudé Feed Stellar Spectra ( resolution, Valdes et al., 2004), after degrading the library spectra to match the spectral resolution of the data. The observed spectra were dereddened using the visual extinction estimates from the IPHAS colors (Table 7, see Section 3.1 for details), and then matched by eye to the closest spectral type using a spectral type grid ranging from B6V to F5V. The Ca ii K line (3933.66 ) is a crucial spectral type diagnostic for early-type stars, but can potentially be affected by interstellar Ca ii absorption over 1-2 kpc sight-lines. The Ca ii IR triplet (8498.02, 8542.09, and 8662.14 ) does not suffer from this problem and due to the lower reddening in this spectral region the lines are observed with good S/N. We therefore carried out two different spectral type assignments for each star, one based on the blue spectrum, in which the Balmer lines and Ca ii K-line of target and template stars were compared, and one based on the red spectrum, where the Paschen and Ca ii IR-triplet lines of target and templates were compared. The comparison between the template spectrum and the 10 GLIPHAS spectra is shown in Figure 3. With the exception of WHT 4 (see below), all 18 stars that were observed were classified as near main sequence A-type. The blue- and red-based spectral type assignments for the 10 GLIPHAS stars are presented in Table 4, together with the measured equivalent widths of the Ca ii K-line and the IR-triplet lines. The red-based spectral types range from A0V to A5V, and are systematically earlier than the blue subtypes, by at least a sub-type. This is as would be expected if the blue-based classifications suffer from interstellar Ca ii-K contamination, leading to an apparently later spectral type. In section 3 the dereddened SEDs of all stars with WHT spectra are shown against a reference A3V stellar SED. In all cases the SED of the observed star is confirmed to follow the SED of an A-type star. The optical spectra and the overall SEDs both demonstrate the reliability of our method of selecting A-type stars based on their IPHAS colors.
No blue flux was detected from WHT 4, so no blue-based spectral classification was possible. In addition, its IR-triplet lines were too deep to be fitted by any A-dwarf spectra. This could be explained by WHT 4 being a giant or a supergiant, since a lower surface gravity leads to deeper and narrower lines. A higher luminosity star would be consistent with the lack of blue flux, since it would be located much further away and more highly reddened. Comparison of its spectrum with those of the giant and supergiant templates from the Indo-US library showed that it could be well matched to the spectrum of an A5 supergiant (A5Ia). For an Mv of –7.4 (Schmidt-Kaler, 1982) this would correspond to a spectrophotometric distance of 4.6 kpc, close to the location of the Scutum-Crux Arm (Bronfman, 1992; Russeil, 2003) and much more in keeping with its large reddening (A = 9.3) than the distance of 100 pc that would be derived assuming the object is a dwarf (see Table 5).
2.4 MIPSGAL
MIPSGAL (Carey et al., 2005) is a Spitzer legacy survey that covers 220 square degrees of the inner Galactic plane ( and l for b) at 24 and 70 m with the Multiband Imaging Photometer for Spitzer (MIPS, Rieke et al., 2004). It has significantly better resolution and sensitivity than previous infrared surveys covering the plane at these wavelengths. MIPSGAL complements the Galactic Disk area covered by GLIMPSE. The MIPSGAL survey was not complete at the time this investigation was begun, with only post basic-calibration (PBCD) mosaic images of a few sky regions being available.
In Section 3, we searched for GLIPHAS stars with excess 8 m fluxes with respect to the expected photospheric emission. For the 17 GLIPHAS stars found to have 8 m excesses (presented in Section 3.1), we inspected mosaic images from the MIPSGAL survey in order to search for possible 24-m detections. The availability of 24-m data-points can be used as confirmation of a mid-IR excess and to provide better constraints when modelling the properties of the emitting dust.
Since only the 24-m PBCD images could be used for science
analysis555see the MIPS data-handbook, at
http://ssc.spitzer.caltech.edu/mips/dh/, only the 24-m
images were downloaded. The images are calibrated in units of MJy/sr
and so can be used for flux estimation purposes. The zeropoint used by
us to convert 24-m fluxes to magnitudes was 7.14 Jy, as computed
from an extrapolation of a model spectrum of Vega (provided by the
SSC). Based on preliminary analysis of mosaic images for
low-background regions, sources with fluxes down to 1 mJy could be
extracted. This corresponds to a 24 m magnitude of approximately
9.6.
The MIPS images were visually inspected at the positions of each of the 17 GLIPHAS stars with 8 m excesses (presented in Section 3.1, Tables 6 and 7). 5 of the 17 stars had point-like counterparts located within 1 pixel (2.45 arcseconds) of the registered IPHAS position, and were selected for flux extraction. Upper-limits for 5 other stars were also derived, while the positions of the remaining 7 stars had not been covered by the currently available MIPSGAL images. 5 24-m upper limits for the 5 non-detected sources were computed using the formula given by Uzpen et al. (2007), assuming a diffraction-limited aperture size and a rms flux limit computed within a pixel box centered at the position of the star.
The 24 m fluxes of the detected stars were measured in the
following way: an average Point Response Function (PRF) was
constructed for each image by selecting a few stars of similar
brightness to the candidate star. PRF reference stars located close to
the candidate were preferred in order to avoid known PRF variations
across the mosaic images. The Image Reduction and Analysis Facility
(IRAF666http://iraf.noao.edu/ ) package DAOPHOT was used
to create the PRF and to extract the candidate object flux.
Once created, this PRF was used to fit the image of the candidate star
and to extract its flux, using an aperture of 5 pixels
(12.45 arcseconds). The sky background was defined as the mode value
within an annular region of pixels in width and located pixels
in radius away from star. This background estimation was subtracted
when calculating the star’s flux. Photometric uncertainties are the
statistical errors. Residual images were produced and inspected for
possible extraction artifacts or over/under-subtraction. An aperture
correction of 1.17 was applied to the derived fluxes, taken from the
MIPS Data Handbook.
For all 5 detected sources the fitted positions agreed to within less
than 0.5 arcseconds with the cataloged IPHAS sky coordinates,
suggesting that they are indeed associated with the A-type stars from
our IPHAS-GLIMPSE sample. The 24-m fluxes and upper limits are
presented and discussed in Section 3.
3 A-type Stars with Mid-infrared Excesses
3.1 IPHAS-GLIMPSE A-stars with 8-m excesses
We searched for stars with 8-m excesses amongst the 2692 A-type stars from the GLIPHAS sample, initially by looking for unusually large colors (e.g., Aumann & Probst, 1991; Uzpen et al., 2005, 2007). Since the stars of our sample should be mostly early A-type stars, their dereddened colors correspond closely to their color excesses. Our IPHAS color-color selection criterion is expected to extract stars with spectral types mainly in the range A0V to A5V. Consistent with the discussion presented by Drew et al. (2008), we adopt , and intrinsic as representative of the target early-A dwarfs (cf. Houk et al. (1997) Hipparcos absolute magnitudes, and Kenyon & Hartmann (1995) colors).
The observed magnitudes were dereddened using the optical and near-IR reddening laws of Schlegel et al. (1998) (after converting the 2MASS magnitudes to UKIRT magnitudes using the solutions from Carpenter (2001), as the Schlegel et al. (1998) extinction coefficients are in the UKIRT system). For the IRAC bands, the extinction coefficients derived by Indebetouw et al. (2005) were used.
As outlined by Drew et al. (2008), the color excess due to extinction, E(B-V), can be derived by subtracting the intrinsic color (0.05) from the observed () color to give E(), which is then multiplied by 1.55. To obtain the visual extinction, Av, E() should be multiplied by 4.901 (Schlegel et al., 1998).
However, given the long sightlines addressed in this work, it makes more sense to refer all reddenings to either the r’ or the i’ band, rather than to V in view of the fact that atypical laws vary away from the norm most strongly in the blue-to-visual part of the optical spectrum (Cardelli et al., 1989). Specifically, the following relations were applied: A=4.13 E(), and A=3.13 E() (using tabulated data from Schlegel et al., 1998).
Color excesses were calculated by taking the differences between the dereddened magnitudes, since the intrinsic colors are expected to be close to 0.0 for early A-type stars. Figure 4 shows the dereddened color-color diagram for the 2692 stars with measured fluxes in all IPHAS, 2MASS and IRAC bands. The dereddened colors of the sample cluster around a mean of , consistent with most of them being A stars (recalling that mean for unreddened A0-5 stars ranges from 0.0 to 0.06; Kenyon & Hartmann, 1995). The standard deviation, mags, will be mainly due to photometric errors, which are amplified in the dereddening process, and perhaps partially due to contamination of the sample by stars that are not A type. Indeed there is a modest redward skew of the dereddened distribution that could be induced by contaminant objects, being more commonly of later spectral type than A0-5, than earlier: specifically 36 stars (1.3 % of the total sample) are present with , 3 more red than the mean, while only 1 star (0.04 %) lies in the blue tail with . Furthermore, whilst it is likely that the majority of the sample are near the main sequence, it is important to bear in mind also that this color selection on its own does not exclude more luminous evolved objects. We can place a figure on the likely level of contamination after examining the excess objects.
color excesses were calculated by taking the differences between the dereddened and 8-m magnitudes, since the intrinsic color is expected to be close to 0.0 for A0-5 stars. The distribution of is not Gaussian, as shown in Figure 5, right-hand panel (the Shapiro-Wilk test for normality was performed and the null hypothesis of normality was rejected at 99% confidence level). It has a mean of 0.05, a standard deviation of 0.29, and a median of 0.00. 34 objects with larger than 3 times the standard deviation from the mean (i.e. ) were removed and statistics recomputed for the main sample. This procedure was repeated until the statistics converged to a mean and standard deviation of 0.22. The Shapiro-Wilk test was recomputed but again argued against normality of the sigma-clipped sample. The width of the distribution for the sigma-clipped sample cannot be attributed purely to photometric errors, as the distribution of errors peaks at the mean value and has a dispersion of . From this comparison one can estimate the additional source of errors introduced to the color excesses from the dereddening procedure. Assuming , the above numbers imply .
Given that the distribution is not Normal (not even after convergence of the iterative sigma-clipping of a total of 58 outliers with larger than 3 times the standard deviation from the mean), we searched for excess objects by comparing the difference between the observed color for every source and the mean of the sigma-clipped sample, divided by the quadratic sum of each’s star photometric uncertainty and the standard deviation of the clipped sample. In this manner, we define the signal-to-noise (SN) ratio of an excess as . The distribution of SN for the entire sample of 2692 stars is shown in the left-hand panel of Figure 5. The distribution is approximately Gaussian, peaks at 0.0, and has a positive tail due to the presence of possible excess sources. There are no sources with SN and conversely, we adopt SN as the threshold for considering an excess to be present. A total of 20 stars are found to have SN, and are highlighted by diamond symbols in the color-color diagram in Figure 4.
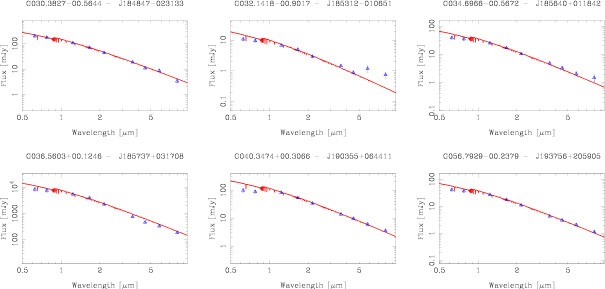
Assuming that the K-band flux is photospheric and that the color excess is due purely to an 8 micron flux excess, one could conclude these 20 stars with 8-m excesses correspond to a real population of objects with continuum excesses. The SEDs of the twenty 8-m excess stars have been constructed and inspected to check whether they conform to those of A0-5 stars. In this step we found that three had SEDs deviating significantly from this expectation, in that they more strongly resembled cooler spectral types. Since the selection should not bias in favour of an A spectral type, this failure rate provides us with a rough estimate of the non-A-type contamination of the IPHAS-selected sample as a whole: 3 interlopers out of 20 implies of the full sample may not be A stars. All three stars are excluded from further analysis. Follow-up spectroscopy of a subsample of 4 of the 17 excess stars that passed the SED test confirms that all give a good match to main sequence A-dwarf template spectra (J191100+094543, J192914+184004, J192933+183415 and J194541+243253, as listed in Table 4). Comparison of the SEDs of the other 14 IPHAS candidate A-stars having follow-up WHT spectra (and that do not have an 8-m excess) also indicate they match well an A3V SED, as shown in Figure 6 for the six that are in the GLIPHAS sample.
Table 5 lists the optical to mid-IR photometry for the 6 GLIPHAS stars with no distinguishable IR-excess for which WHT spectra were obtained, while Table 6 lists the photometry for the 17 GLIPHAS A-type stars selected as having 8-m excesses. In the 5 cases where a 24-m flux was detected and extracted according to the procedure described in Section 2.4, the recovered 24m magnitudes are also listed. The 24-m fluxes were not dereddened, as extinction is expected to be negligible at this wavelength.
3.2 Modeling the mid-IR excesses
In order to characterise the strength of the mid-IR excesses, we
employed a solar-metallicity Kurucz model atmosphere (Kurucz, 1979)
with K, to extrapolate the observed
-band flux to longer wavelengths. On normalising the model SED
flux to the observed fluxes in the band, we obtain a good fit to
the optical and near-IR datapoints, confirming the reliability of the
IPHAS A-type selection method. The mid-IR excesses (excess above
photosphere, in mJy) were calculated by taking the difference between
the observed flux and the model SED flux (the latter corresponding
to the in-band stellar flux, computed by convolving the model SED
with the 2MASS, IRAC and MIPS 24 filter responses respectively,
following the description outlined in Robitaille et al. (2007)). In this
case, the signal-to-noise ratio of the excesses is defined as the
ratio of the excess (in mJy) to the photometric uncertainty (in mJy)
of the overall flux measurement, (e.g, Rhee et al., 2007).
includes both the photometric uncertainty listed in the GLIMPSE
catalog and an absolute calibration uncertainty of 5 for all IRAC
bands. For the 24 m points we have assumed a
of - a rather conservative value given the absolute
calibration uncertainty listed in the MIPS Data Handbook Version
3.3.1 but similar to the value used by Uzpen et al. (2007).
Table 7 lists the derived infrared excess fluxes above the reference stellar photosphere for the seventeen 8 m excess stars, along with other quantities such as the r′ extinction, A, and spectrophotometric distances . These distances were derived from the observed r′ magnitudes, corrected for the r′ band extinction, A, assuming that the absolute r′ magnitude is M (Houk et al., 1997).
The choice of a representative A-type spectral type has a significant
effect on the derived distance and extinction, while it has little
effect on the derived excess flux and corresponding SNR (less than
change in the derived excess flux when assuming spectral types
ranging from A0V to A5V spectral). In order to account for this
effect, A and for each star were calculated
assuming all possible spectral types (A0-5) and the rms value added
quadratically to the 1- formal uncertainties to give the
errors listed in Table 6. The mid-IR excess fluxes
determined for the 17 stars are listed in Table 7, where
only excesses detected with a S/N higher than 3.0 are shown,
consistent with the selection criteria applied over the E[K-8]
distribution.
The observed SEDs are assumed to be the sum of the model stellar atmosphere SED (SED⋆) and a cooler black body of a given temperature (SEDdisk), i.e. . For each of the 17 stars in Table 7, we searched for the model that minimized the chi-squared () difference between the modelled SEDtot and the observed data-points. The search was performed using the variable-metric routine Migrad of the Minuit package from CERN777http://seal.web.cern.ch/seal/work-packages/mathlibs/minuit/home.html. The iterative process finds simultaneously the best fit temperature of the black body and its angular diameter in the sky (corresponding to the square-root of the flux normalisation constant). Errors on individual parameters are estimated by searching the parameter space for the = 1 contour.
Table 7 lists the best-fit black body temperature derived for each of the 17 stars. Figure 7 shows the results from our black-body fitting routine for the 12 stars with an 8-m excess but lacking 24-m detections. The SEDs of the 5 stars with excesses at both 8 m and 24 m are shown in Figure 8. The dereddened optical IPHAS, 2MASS and GLIMPSE data points are plotted in blue, with photometric error-bars. The solid line in red corresponds to the reference photospheric SED normalised to the K-band flux. The pink dotted line represents our best-fit black-body and the solid green line represents the resulting best-fitting . The optical data points were excluded from the fitting routine. For the stars lacking 24-m detections, the derived color temperatures provide upper limits to the maximum temperatures of the disks, as the lack of longer wavelength measurements provides no constraints on the presence of cooler material (allowing for the possibility that the parent planetesimal belts are extended over a range of radii). Nonetheless, the derived color temperatures can be used to estimate the fractional bolometric infrared fluxes due to the warm components, , where and represent the K-band normalisation factors and =9000 K. These correspond to distance-independent, best-fit values of LIR/L⋆, with uncertainties dependent only on the derivation of and . For stars where an excess is detected at more than one wavelength, the resulting LIR/L⋆ values are presented in the last column of Table 7.
4 Discussion
We have conducted a search for A-type dwarfs, selected from the IPHAS survey, that have mid-IR excesses in the GLIMPSE and/or MIPSGAL surveys. A sample of 2692 A-type stars was extracted by cross-correlating the optical IPHAS photometry with the mid-IR Spitzer GLIMPSE photometry. Follow-up optical spectroscopic observations of 18 IPHAS candidate A-type stars confirmed that all were of A-type, with only one object (6%) not fitting a main sequence star template. As expected from the IPHAS color selection criteria none of the spectra showed emission-line signatures, confirming that the selected A-stars are likely to be well-established MS stars. Figure 9, left-panel, shows the magnitude distribution of the sample at both r′ and 8 m, together with the dereddened magnitudes. After extinction corrections, both distributions overlap as expected if, as assumed, they are A-type stars. The right-panel of Figure 9, shows the derived distance distribution of the sample. Our GLIPHAS sample traces previously unexplored photometric ranges for debris disk systems, allowing one to study the incidence of mid-IR excesses at distances of 0.5–2 kpc in the Galactic Plane. IRAS searches for debris disks around MS A-type stars were restricted to 120 pc (Rhee et al., 2007), while MSX detection limits allowed A-type stars out to pc to be surveyed (Clarke et al., 2005; Uzpen et al., 2007).
For the GLIPHAS sample of 2692 IPHAS-selected candidate A stars, 17 (0.6%) were found to have 8-m excesses with . Taking into account the probable non-A-Type contamination level of % present in the whole sample, the excess fraction needs to be adjusted upward to 0.7%. The above fraction of stars showing warm dust excesses is notably smaller than the quoted by some pre-Spitzer surveys for dust excesses around MS stars (Plets & Vynckier, 1999; Lagrange et al., 2000) and the 13% occurrence fraction quoted by Song et al. (2001) for A-type stars with ages ranging from 50 Myr to 1 Gyr. These works, however, quantified the excess fractions at wavelengths beyond 24 m and therefore cannot be used for comparison. On the other hand, the dust excess fraction of 0.7% found by us at 8 m is similar to the fraction with dust excesses found at 12 m from IRAS searches, and coincides with MSX and GLIMPSE Galactic Plane results of Uzpen et al. (2007), who found that 4 out of 391 A-type stars in their sample (1.0%) showed 8-m excesses. Further, our derived fraction of warm excesses 0.7% is also consistent with the 1.2% frequency of warm excesses found in young clusters (Hernández et al., 2006; Currie et al., 2008; Uzpen et al., 2008), and with recent results from Uzpen et al. (2008) that report a 0.3% incidence fraction of warm excesses among 338 field stars.
We find that none of the 8-m excess sources show JHK excesses, which rules out the presence of very hot dust in the inner parts of their disks. Four objects (24%) show excesses at wavelengths shorter than 5.8 m, imposing strong constraints on the presence of hot dust. This supports the hypothesis that the objects in this sample are relatively evolved systems, older than T Tauri and Herbig Ae stars (as expected from the lack of H emission, given their colors). Table 7 lists and Figure 10 displays the blackbody dust temperatures and LIR/L⋆ values for both the 8 m and 24 m excess samples. Only one object has K within the errors. We find that the SEDs of the mid-IR excess sources can be fitted by blackbodies with temperatures ranging from K (for those with detected excesses at more than one wavelength) comparable to recent samples of warm (T K) excess candidates identified with Spitzer (Uzpen et al., 2005, 2007; Hernández et al., 2006; Currie et al., 2008).
The derived color temperatures provide only upper limits to the maximum temperatures of the disks, as the lack of longer wavelength measurements provides no constraints on the presence of cooler material (allowing for the possibility that the parent planetesimal belts are extended over a range of radii). Based on simple radiative equilibrium (e.g. Currie et al., 2008), the derived disk temperatures would imply parent planetesimal belts confined to disk regions of AU.
The mid-IR excess systems are found to have fractional disk-to-star luminosity ratios, LIR/L⋆, ranging from , with a mean of . But since cooler dust emitting at far-IR wavelengths may also be present around the above LIR/L⋆ values are strictly only lower limits. However, for systems with detectable mid-IR excesses for which longer wavelength data are also available (e.g. the sample of Sylvester et al. (1996)), most of the excess luminosity appears at the shorter wavelengths. The range of fractional luminosities found here are in between the values expected for luminous debris-disk and evolved T Tauri and Herbig Ae/Be systems with cleared inner regions.
The low incidence rate of mid-IR excesses found in our survey is consistent with previous inferences that the inner regions of CS disks are cleared faster than the outer regions, resulting in a greater persistence of long wavelength excesses (Hayashi et al., 1985; Backman & Paresce, 1993; Meyer et al., 2007; Cieza et al., 2007). Most prior examples of stars with 8-12 m excesses had H emission as well as near-IR excesses, e.g. as found by Dunkin et al. (1997) for the Sylvester et al. (1996) sample of A-stars with mid-IR excesses; our stars, with no net H emission and no noticeable near-IR excesses, are likely to be only a little older than those stars with H emission that show 8-12 m excesses. Our IPHAS color-selection method ensures the great preponderance of selected stars will be older than 10 Myr (as described by Drew et al., 2008), whilst stars in the age range 5-10 Myrs are admitted as their H emission becomes insignificant. The very small proportion (0.7%) of near-MS A stars found to exhibit disk emission at 8 m are most likely at the younger end of the entire sample of A stars that have debris disks. Currie et al. (2008) found that the fraction of true debris-disks ( LIR/L) peaks at 10-15 Myr, consistent with the low fraction of warm, Pictoris-like, debris-disks identified in this work.
The identification and detailed study of systems with intermediate values of LIR/L⋆ (10-3 - 10-2) is crucial in order to fully understand the disk-clearing and planet formation processes. Here we have exploited the current generation of photometric Galactic surveys to increase substantially the number of known mid-IR excess A-type MS systems, which are likely to be at this evolutionary stage. High-resolution spectroscopic follow-up observations of the sample should be carried out in order to refine the stellar properties (surface gravity, rotational velocities and metallicities), allowing them to be placed within the context of other known samples of debris disks.
5 Conclusions
Using results from the IPHAS, GLIMPSE and MIPSGAL Galactic Plane surveys, we have identified 17 new main sequence A-type systems with warm excesses at 8 m and/or 24 m. Optical classification spectra obtained of 10 of the systems confirmed that all but one were main sequence A-type stars, the exception being an A5Ia supergiant. The systems have bolometric excess ratios comparable to those of warm debris-disk systems, similar to Pictoris. The overall fraction of sources with 8 m excesses was found to be 0.7 . The identification of these new CS disk systems shows the potential of new surveys to increase substantially our knowledge of the occurrence and characteristics of CS disks in transition between their primordial and debris-disk phases. When both the IPHAS and MIPSGAL surveys are complete, an analysis of the full data-sets is planned in order to provide a more complete sample of Galactic Plane main sequence A-type debris disk stars.
Acknowledgments
This work was based partially on observations made with the Isaac Newton Telescope and the William Herschel Telescopes, which are operated by the Isaac Newton Group in the Observatorio del Roque de los Muchachos of the Instituto de Astrofísica de Canarias, La Palma, Spain. IPHAS observing time was made available by the time allocation committees of the UK, Spain and The Netherlands. The WHT ISIS spectra were obtained as part of the 2006/7 International Time Programme: ‘An IPHAS-based exploration of stellar populations in the northern Milky Way’. This work made use of data products from the GLIMPSE survey, which is a legacy science program of the Spitzer Space Telescope, funded by the National Aeronautics and Space Administration; of the SIMBAD database and other facilities operated at CDS, Strasbourg, France; and of the 2MASS point-source catalog available at the NASA/IPAC Infrared Science Archive, which is operated by the Jet Propulsion Laboratory, California Institute of Technology, under contract with the National Aeronautics and Space Administration. ASH carried out part of this work whilst being funded by the PPARC Gemini - Fundación Andes UK/Chile studentship programme. Parts of the analysis presented here made use of the Perl Data Language (PDL), which can be obtained from www.perl.org.
| Field ID | l | b | RA | DEC | Seeing | Total Stars | Total A-type | Total with |
|---|---|---|---|---|---|---|---|---|
| [deg] | [deg] | [arcsec] | dwarfs | GLIMPSE Correlations | ||||
| 4205 | 29.58 | -0.80 | 18:48:8.94 | -03:21:0.0 | 0.9 | 874 | 138 | 0 |
| 4188 | 29.73 | -0.30 | 18:46:40.25 | -02:59:0.0 | 1.5 | 0 | 179 | 3 |
| 4213 | 30.15 | -0.71 | 18:48:53.05 | -02:48:0.0 | 1.1 | 612 | 50 | 36 |
| 4196 | 30.31 | -0.21 | 18:47:24.49 | -02:26:0.0 | 1.1 | 942 | 175 | 158 |
| 4222 | 30.72 | -0.62 | 18:49:37.12 | -02:15:0.0 | 1.0 | 589 | 67 | 60 |
| 4189 | 31.04 | 0.37 | 18:46:40.62 | -01:31:0.0 | 1.5 | 1698 | 136 | 125 |
| 4254 | 31.14 | -1.03 | 18:51:49.68 | -02:04:0.0 | 1.3 | 1425 | 175 | 85 |
| 4232 | 31.30 | -0.53 | 18:50:21.29 | -01:42:0.0 | 1.0 | 2737 | 214 | 182 |
| 4214 | 31.45 | -0.04 | 18:48:53.12 | -01:20:0.0 | 1.0 | 2548 | 359 | 292 |
| 4197 | 31.61 | 0.45 | 18:47:25.01 | -00:58:0.0 | 1.0 | 2043 | 191 | 63 |
| 4265 | 31.71 | -0.94 | 18:52:33.68 | -01:31:0.0 | 1.5 | 4327 | 211 | 148 |
| 4242 | 31.87 | -0.45 | 18:51:05.41 | -01:09:0.0 | 1.3 | 4059 | 388 | 265 |
| 4223 | 32.03 | 0.05 | 18:49:37.33 | -00:47:0.0 | 1.3 | 3246 | 423 | 0 |
| 4206 | 32.19 | 0.54 | 18:48:09.30 | -00:25:0.0 | 1.0 | 1183 | 97 | 1 |
| 4275 | 32.28 | -0.85 | 18:53:17.65 | -00:58:0.0 | 1.3 | 5864 | 351 | 104 |
| 4190 | 32.35 | 1.03 | 18:46:41.45 | -00:03:0.0 | 1.3 | 1570 | 125 | 6 |
| 4253 | 32.44 | -0.36 | 18:51:49.47 | -00:36:0.0 | 1.3 | 4314 | 538 | 0 |
| 4233 | 32.60 | 0.13 | 18:50:21.48 | -00:14:0.0 | 1.1 | 2286 | 306 | 18 |
| 4215 | 32.76 | 0.63 | 18:48:53.54 | 00:08:0.0 | 1.1 | 1164 | 103 | 90 |
| 4285 | 32.86 | -0.77 | 18:54:01.56 | -00:25:0.0 | 1.5 | 7301 | 501 | 0 |
| 4263 | 33.02 | -0.27 | 18:52:33.49 | -00:03:0.0 | 1.4 | 3737 | 389 | 111 |
| 4243 | 33.17 | 0.22 | 18:51:05.58 | 00:19:0.0 | 1.3 | 1170 | 131 | 112 |
| 4297 | 33.43 | -0.68 | 18:54:45.46 | 00:08:0.0 | 1.3 | 4000 | 541 | 377 |
| 4274 | 33.59 | -0.18 | 18:53:17.57 | 00:30:0.0 | 1.3 | 1058 | 79 | 77 |
| 4255 | 33.75 | 0.31 | 18:51:49.73 | 00:52:0.0 | 1.3 | 885 | 62 | 53 |
| 4235 | 33.91 | 0.80 | 18:50:22.03 | 01:14:0.0 | 1.2 | 596 | 55 | 43 |
| 4309 | 34.00 | -0.59 | 18:55:29.42 | 00:41:0.0 | 1.1 | 935 | 75 | 66 |
| 4286 | 34.16 | -0.10 | 18:54:01.61 | 01:03:0.0 | 1.4 | 637 | 63 | 58 |
| 4266 | 34.32 | 0.40 | 18:52:33.84 | 01:25:0.0 | 1.5 | 837 | 82 | 67 |
| 4348 | 34.42 | -1.00 | 18:57:41.24 | 00:52:0.0 | 1.3 | 343 | 17 | 14 |
| 4246 | 34.48 | 0.89 | 18:51:06.18 | 01:47:0.0 | 1.2 | 549 | 34 | 33 |
| 4322 | 34.58 | -0.50 | 18:56:13.36 | 01:14:0.0 | 1.2 | 835 | 55 | 48 |
| 4298 | 34.73 | -0.01 | 18:54:45.60 | 01:36:0.0 | 1.3 | 961 | 94 | 86 |
| 4276 | 34.89 | 0.48 | 18:53:17.88 | 01:58:0.0 | 1.0 | 464 | 31 | 28 |
| 4361 | 34.99 | -0.91 | 18:58:25.07 | 01:25:0.0 | 1.3 | 903 | 27 | 17 |
| 4256 | 35.05 | 0.97 | 18:51:50.27 | 02:20:0.0 | 1.2 | 370 | 40 | 26 |
| 4334 | 35.15 | -0.41 | 18:56:57.25 | 01:47:0.0 | 1.3 | 779 | 41 | 30 |
| 4288 | 35.47 | 0.57 | 18:54:01.88 | 02:31:0.0 | 1.5 | 451 | 50 | 49 |
| 4299 | 36.04 | 0.66 | 18:54:45.84 | 03:04:0.0 | 1.6 | 717 | 85 | 81 |
| 4336 | 36.45 | 0.26 | 18:56:57.35 | 03:15:0.0 | 1.3 | 313 | 28 | 28 |
| 4401 | 36.71 | -0.64 | 19:00:36.45 | 03:04:0.0 | 1.3 | 706 | 72 | 69 |
| 4325 | 37.19 | 0.84 | 18:56:13.71 | 04:10:0.0 | 1.5 | 210 | 14 | 14 |
| 4415 | 37.28 | -0.55 | 19:01:20.27 | 03:37:0.0 | 1.6 | 362 | 44 | 43 |
| 4388 | 37.44 | -0.06 | 18:59:52.68 | 03:59:0.0 | 1.5 | 333 | 34 | 34 |
| 4402 | 38.01 | 0.03 | 19:00:36.50 | 04:32:0.0 | 1.5 | 278 | 16 | 15 |
| 4417 | 38.58 | 0.12 | 19:01:20.30 | 05:05:0.0 | 1.5 | 439 | 24 | 24 |
| 4389 | 38.74 | 0.61 | 18:59:52.75 | 05:27:0.0 | 1.5 | 325 | 24 | 23 |
| 4459 | 39.00 | -0.28 | 19:03:31.64 | 05:16:0.0 | 1.6 | 679 | 76 | 74 |
| 4403 | 39.32 | 0.70 | 19:00:36.52 | 06:00:0.0 | 1.4 | 565 | 36 | 33 |
| 4504 | 39.41 | -0.68 | 19:05:42.97 | 05:27:0.0 | 1.4 | 1073 | 102 | 99 |
| 4473 | 39.57 | -0.19 | 19:04:15.41 | 05:49:0.0 | 1.4 | 647 | 58 | 57 |
| 4416 | 39.89 | 0.79 | 19:01:20.28 | 06:33:0.0 | 1.5 | 817 | 50 | 40 |
| 4488 | 40.14 | -0.10 | 19:04:59.19 | 06:22:0.0 | 1.5 | 1008 | 129 | 92 |
| 4458 | 40.30 | 0.39 | 19:03:31.62 | 06:44:0.0 | 1.7 | 1310 | 154 | 147 |
| 4534 | 40.55 | -0.50 | 19:07:10.52 | 06:33:0.0 | 1.4 | 1059 | 97 | 91 |
| 4503 | 40.71 | -0.01 | 19:05:42.95 | 06:55:0.0 | 1.1 | 1176 | 104 | 100 |
| 4518 | 41.28 | 0.09 | 19:06:26.71 | 07:28:0.0 | 1.1 | 1213 | 82 | 80 |
| 4593 | 41.54 | -0.80 | 19:10:05.70 | 07:17:0.0 | 1.1 | 903 | 73 | 72 |
| 4533 | 41.85 | 0.18 | 19:07:10.48 | 08:01:0.0 | 1.6 | 986 | 78 | 70 |
| 4502 | 42.01 | 0.67 | 19:05:42.78 | 08:23:0.0 | 1.2 | 1010 | 111 | 109 |
| 4609 | 42.11 | -0.71 | 19:10:49.52 | 07:50:0.0 | 1.5 | 773 | 46 | 30 |
| 4517 | 42.59 | 0.76 | 19:06:26.46 | 08:56:0.0 | 1.2 | 1005 | 80 | 78 |
| 4624 | 42.68 | -0.61 | 19:11:33.34 | 08:23:0.0 | 1.5 | 1130 | 69 | 65 |
| 4592 | 42.84 | -0.12 | 19:10:05.66 | 08:45:0.0 | 1.2 | 880 | 46 | 40 |
| 4532 | 43.16 | 0.85 | 19:07:10.12 | 09:29:0.0 | 1.2 | 2106 | 248 | 210 |
| 4607 | 43.41 | -0.03 | 19:10:49.45 | 09:18:0.0 | 1.5 | 799 | 94 | 82 |
| 4682 | 43.66 | -0.91 | 19:14:28.73 | 09:07:0.0 | 1.5 | 2782 | 150 | 123 |
| 4623 | 43.98 | 0.07 | 19:11:33.25 | 09:51:0.0 | 1.3 | 1125 | 107 | 69 |
| 4590 | 44.14 | 0.55 | 19:10:05.41 | 10:13:0.0 | 1.1 | 2153 | 335 | 314 |
| 4699 | 44.24 | -0.82 | 19:15:12.66 | 09:40:0.0 | 1.6 | 1366 | 99 | 89 |
| 4605 | 44.71 | 0.65 | 19:10:49.07 | 10:46:0.0 | 1.5 | 3485 | 436 | 381 |
| 4714 | 44.81 | -0.72 | 19:15:56.63 | 10:13:0.0 | 1.5 | 1469 | 136 | 118 |
| 4683 | 44.96 | -0.23 | 19:14:28.75 | 10:35:0.0 | 1.6 | 1696 | 151 | 84 |
| 4620 | 45.28 | 0.75 | 19:11:32.73 | 11:19:0.0 | 1.2 | 4395 | 392 | 325 |
| 4665 | 45.69 | 0.35 | 19:13:44.59 | 11:30:0.0 | 1.5 | 1122 | 167 | 156 |
| 4635 | 45.85 | 0.84 | 19:12:16.41 | 11:52:0.0 | 1.2 | 4230 | 584 | 334 |
| 4679 | 46.26 | 0.45 | 19:14:28.38 | 12:03:0.0 | 1.2 | 1321 | 265 | 258 |
| 4649 | 46.42 | 0.94 | 19:12:59.97 | 12:25:0.0 | 1.7 | 2946 | 380 | 209 |
| 4802 | 46.93 | -0.82 | 19:20:20.63 | 12:03:0.0 | 1.7 | 1464 | 146 | 99 |
| 4663 | 46.99 | 1.04 | 19:13:43.53 | 12:58:0.0 | 1.6 | 1943 | 191 | 76 |
| 4817 | 47.50 | -0.72 | 19:21:04.70 | 12:36:0.0 | 1.8 | 1043 | 93 | 88 |
| 4831 | 48.07 | -0.62 | 19:21:48.80 | 13:09:0.0 | 1.8 | 1792 | 22 | 18 |
| 4801 | 48.23 | -0.13 | 19:20:20.42 | 13:31:0.0 | 1.8 | 1927 | 212 | 195 |
| 4816 | 48.80 | -0.03 | 19:21:04.48 | 14:04:0.0 | 1.8 | 2088 | 184 | 155 |
| 4859 | 49.21 | -0.42 | 19:23:17.20 | 14:15:0.0 | 1.6 | 1736 | 165 | 151 |
| 4830 | 49.36 | 0.07 | 19:21:48.57 | 14:37:0.0 | 1.8 | 1660 | 5 | 0 |
| 4902 | 49.63 | -0.80 | 19:25:30.00 | 14:26:0.0 | 1.8 | 2419 | 199 | 184 |
| 4916 | 50.19 | -0.70 | 19:26:14.31 | 14:59:0.0 | 0.9 | 2174 | 233 | 218 |
| 4857 | 50.50 | 0.28 | 19:23:16.58 | 15:43:0.0 | 1.6 | 1983 | 143 | 133 |
| 4930 | 50.76 | -0.59 | 19:26:58.69 | 15:32:0.0 | 0.9 | 2331 | 92 | 80 |
| 4901 | 50.92 | -0.10 | 19:25:29.72 | 15:54:0.0 | 1.6 | 1983 | 120 | 112 |
| 4973 | 51.18 | -0.97 | 19:29:11.95 | 15:43:0.0 | 0.9 | 1460 | 142 | 93 |
| 4944 | 51.33 | -0.49 | 19:27:43.14 | 16:05:0.0 | 1.1 | 1946 | 118 | 109 |
| 4915 | 51.48 | 0.00 | 19:26:14.02 | 16:27:0.0 | 0.9 | 2384 | 236 | 228 |
| 4986 | 51.75 | -0.87 | 19:29:56.62 | 16:16:0.0 | 0.9 | 1695 | 59 | 55 |
| 4928 | 52.05 | 0.11 | 19:26:58.16 | 17:00:0.0 | 0.9 | 1984 | 255 | 139 |
| 4899 | 52.20 | 0.60 | 19:25:28.54 | 17:22:0.0 | 1.7 | 1995 | 156 | 139 |
| 5000 | 52.32 | -0.76 | 19:30:41.19 | 16:49:0.0 | 1.3 | 2357 | 207 | 196 |
| 4972 | 52.47 | -0.27 | 19:29:11.83 | 17:11:0.0 | 1.2 | 1283 | 86 | 82 |
| 4942 | 52.62 | 0.22 | 19:27:42.38 | 17:33:0.0 | 0.9 | 1687 | 118 | 112 |
| 4912 | 52.77 | 0.70 | 19:26:12.55 | 17:55:0.0 | 0.9 | 2044 | 190 | 162 |
| 5015 | 52.88 | -0.65 | 19:31:25.81 | 17:22:0.0 | 1.2 | 2380 | 174 | 124 |
| 4985 | 53.03 | -0.16 | 19:29:56.29 | 17:44:0.0 | 0.9 | 1008 | 35 | 35 |
| 4926 | 53.34 | 0.81 | 19:26:56.63 | 18:27:59.9 | 0.9 | 2075 | 147 | 130 |
| 4999 | 53.60 | -0.05 | 19:30:40.82 | 18:17:0.0 | 1.3 | 1364 | 118 | 111 |
| 4970 | 53.75 | 0.43 | 19:29:10.98 | 18:38:59.9 | 1.6 | 1694 | 171 | 138 |
| 4939 | 53.90 | 0.92 | 19:27:40.50 | 19:00:59.9 | 1.1 | 3148 | 402 | 299 |
| 5014 | 54.17 | 0.06 | 19:31:25.45 | 18:49:59.9 | 1.3 | 3285 | 324 | 219 |
| 4983 | 54.32 | 0.54 | 19:29:55.14 | 19:11:59.9 | 0.9 | 5067 | 188 | 88 |
| 4997 | 54.89 | 0.66 | 19:30:39.36 | 19:44:59.9 | 1.3 | 5019 | 436 | 192 |
| 5098 | 55.00 | -0.70 | 19:35:54.90 | 19:11:59.9 | 0.9 | 3108 | 287 | 108 |
| 5069 | 55.15 | -0.21 | 19:34:24.73 | 19:33:59.9 | 0.8 | 4650 | 400 | 224 |
| 5041 | 55.30 | 0.28 | 19:32:54.41 | 19:55:59.9 | 0.9 | 4928 | 183 | 98 |
| 5112 | 55.57 | -0.58 | 19:36:39.94 | 19:44:59.9 | 1.1 | 4229 | 619 | 397 |
| 5083 | 55.72 | -0.09 | 19:35:09.55 | 20:06:59.9 | 0.9 | 4422 | 561 | 379 |
| 5025 | 56.02 | 0.88 | 19:32:08.01 | 20:50:59.9 | 1.1 | 2828 | 60 | 30 |
| 5126 | 56.14 | -0.47 | 19:37:25.09 | 20:17:59.9 | 0.9 | 4457 | 399 | 240 |
| 5097 | 56.28 | 0.02 | 19:35:54.46 | 20:39:59.9 | 0.9 | 2286 | 139 | 131 |
| 5039 | 56.58 | 1.00 | 19:32:52.14 | 21:23:59.9 | 0.9 | 2723 | 190 | 112 |
| 5140 | 56.70 | -0.35 | 19:38:10.34 | 20:50:59.9 | 1.6 | 2467 | 198 | 186 |
| 5111 | 56.85 | 0.14 | 19:36:39.48 | 21:12:59.9 | 1.0 | 1207 | 70 | 67 |
| 5080 | 57.00 | 0.62 | 19:35:08.16 | 21:34:59.9 | 0.8 | 1734 | 168 | 53 |
| 5124 | 57.41 | 0.25 | 19:37:24.30 | 21:45:59.9 | 1.0 | 689 | 79 | 78 |
| 5095 | 57.56 | 0.74 | 19:35:52.71 | 22:07:59.9 | 0.9 | 1645 | 102 | 97 |
| 5138 | 57.98 | 0.37 | 19:38:09.21 | 22:18:59.9 | 1.5 | 1558 | 85 | 47 |
| 5108 | 58.13 | 0.86 | 19:36:37.36 | 22:40:59.9 | 0.9 | 2288 | 178 | 106 |
| 5152 | 58.54 | 0.49 | 19:38:54.23 | 22:51:59.9 | 1.5 | 1867 | 133 | 106 |
| 5262 | 59.24 | -0.73 | 19:45:00.13 | 22:51:59.9 | 1.1 | 3095 | 240 | 221 |
| 5277 | 59.80 | -0.61 | 19:45:45.96 | 23:24:59.9 | 1.1 | 2592 | 207 | 195 |
| 5261 | 60.51 | 0.01 | 19:44:59.57 | 24:19:59.9 | 1.3 | 4143 | 413 | 341 |
| 5275 | 61.07 | 0.13 | 19:45:45.38 | 24:52:59.9 | 1.1 | 3989 | 387 | 261 |
| 5273 | 62.33 | 0.88 | 19:45:42.67 | 26:20:59.8 | 1.1 | 2978 | 246 | 194 |
| 5285 | 62.89 | 1.01 | 19:46:27.69 | 26:53:59.8 | 1.0 | 4273 | 288 | 116 |
| 5489 | 65.02 | -0.76 | 19:58:11.41 | 27:48:59.8 | 1.5 | 2900 | 196 | 74 |
| TOTAL | 260223 | 23050 | 15312 |
| Filter | Central wavelength | Zeropoint | FWHM | Lower flux limits |
|---|---|---|---|---|
| [m] | [Jy] | [arcseconds] | [mJy/mag] | |
| IPHAS r′ | 0.624 | 3173.3 | 0.2/18 | |
| IPHAS i′ | 0.774 | 2515.7 | 0.02/20.5 | |
| IPHAS H | 0.656 | 2974.4 | 0.02/20.5 | |
| 2MASS J | 1.235 | 1594.5 | 3.1 | 0.7/15.8 |
| 2MASS H | 1.662 | 1024.5 | 3.0 | 0.9/15.1 |
| 2MASS K | 2.159 | 666.7 | 3.1 | 1.2/14.3 |
| GLIMPSE IRAC 1 | 3.550 | 277.5 | 1.6 | 0.6/14.2 |
| GLIMPSE IRAC 2 | 4.493 | 179.5 | 1.7 | 0.4/14 |
| GLIMPSE IRAC 3 | 5.731 | 116.5 | 1.8 | 2/11.9 |
| GLIMPSE IRAC 4 | 7.872 | 63.1 | 1.9 | 10/9.5 |
| MIPSGAL MIPS 1 | 23.670 | 7.13 | 5.5 | 1/9.6 |
Note. — Filter characteristics, spatial resolution and photometric sensitivities of the IPHAS, 2MASS, GLIMPSE and MIPSGAL 24-m surveys. Note that the GLIMPSE catalog includes sources with fluxes smaller than these sensitivities, provided they have a SN and that they meet the criterion in the other bands. The zeropoint (luminosity of a 0th magnitude star) in each band is given for conversion from fluxes to magnitudes. From Drew et al. (2005), Cutri et al. (2003), the Spitzer Observer Manual Version 7.1, the GLIMPSE Legacy Data Products Notes version 2.0 and the Infrared Processing and Analysis Center (IPAC).
| Band | Number of stars | Mean observed magnitude |
|---|---|---|
| r′ | 15312 | 16.179 |
| i′ | 15312 | 14.892 |
| J | 12748 | 14.045 |
| H | 12485 | 13.546 |
| K | 11198 | 13.281 |
| 3.6 | 11175 | 12.982 |
| 4.5 | 11037 | 12.969 |
| 5.8 | 5111 | 12.385 |
| 8 | 2751 | 12.097 |


| Ca ii EW’s (Å) | ||||||
|---|---|---|---|---|---|---|
| Star | Red-based | Blue-Based | 8498.02 Å | 8542.09 Å | 8662.14 Å | 3933.663 Å |
| WHT1 - J184847-023133 | A1V | A1V | 0.64(0.21) | 1.71(0.27) | 3.65(0.32) | 1.36(0.31) |
| WHT2 - J185312-010651 | A4V | A6V | 0.91(0.32) | 1.83(0.39) | 4.39(0.31) | 1.44(0.42) |
| WHT3 - J185640+011842 | A1V | A2V | 0.52(0.25) | 3.02(0.29) | 4.87(0.39) | 0.87(0.21) |
| WHT4 - J185737+031708 | A5Ia | - | 2.76(0.32) | 5.48(0.41) | 4.41(0.37) | - |
| WHT5 - J190355+064411 | A2V | A3V | 1.33(0.19) | 2.95(0.22) | 6.17(0.29) | 1.08(0.21) |
| WHT6 - J191100+094543 | A4V | A7V | 1.15(0.34) | 2.36(0.31) | 4.09(0.32) | 3.34(0.37) |
| WHT7 - J192914+184004 | A0V | A0V | 0.36(0.17) | 1.44(0.21) | 4.41(0.27) | 0.61(0.19) |
| WHT8 - J192933+183415 | A0V | A0V | 0.33(0.17) | 1.72(0.23) | 4.55(0.28) | 0.44(0.24) |
| WHT9 - J193756+205905 | A0V | A2V | 0.49(0.19) | 1.68(0.24) | 4.31(0.33) | 1.05(0.25) |
| WHT10 - J194541+243253 | A0V | A2V | 0.25(0.19) | 1.51(0.34) | 3.36(0.41) | 1.08(0.33) |
Note. — Blue- (Ca ii K) and red-based (Ca ii IR-triplet) spectral classifications for stars observed with the WHT. The red-based spectral types are 0.9 sub-types earlier on average than the blue-based ones (see text). The measured equivalent widths of the Ca ii-K and IR-triplet lines are given in , with the numbers in brackets denoting the 2 uncertainties.
| WHT | IPHAS | r′ | r′-i′ | J | J-H | J-K | J-[3.6] | [3.6] | [3.6]-[4.5] | [3.6]-[5.8] | [3.6]-[8.0] | Ar | d |
|---|---|---|---|---|---|---|---|---|---|---|---|---|---|
| No. | ID | (mag) | (mag) | (mag) | (mag) | (mag) | (mag) | (mag) | (mag) | (mag) | (mag) | (mag) | (kpc) |
| 1 | J184847-023133 | 14.48(0.02) | 1.09(0.03) | 11.69(0.02) | 0.44(0.03) | 0.70(0.03) | 0.97(0.05) | 10.72 | -0.05(0.08) | 0.18(0.09) | 0.79(0.08) | 4.1 (0.3) | 0.6 (0.1) |
| 2 | J185312-010651 | 15.70(0.01) | 0.57(0.01) | 14.00(0.05) | 0.32(0.08) | 0.35(0.09) | 0.65(0.09) | 13.35 | -0.05(0.16) | 0.75(0.26) | 0.90(0.24) | 2.0 (0.2) | 2.6 (0.5) |
| 3 | J185640+011842 | 14.71(0.02) | 0.76(0.03) | 12.85(0.02) | 0.33(0.03) | 0.47(0.04) | 0.75(0.06) | 12.10 | 0.10(0.12) | 0.45(0.13) | 0.93(0.20) | 2.8 (0.3) | 1.2 (0.2) |
| 4 | J185737+031708 | 15.19(0.01) | 2.38(0.01) | 9.18(0.02) | 1.13(0.05) | 1.70(0.03) | 2.05(0.04) | 7.13 | 0.10(0.05) | 0.21(0.05) | 0.24(0.04) | 9.1 (0.2) | 0.1 (0.0) |
| 5 | J190355+064411 | 14.24(0.04) | 0.90(0.06) | 11.74(0.02) | 0.34(0.04) | 0.57(0.03) | 0.74(0.07) | 11.00 | 0.14(0.09) | 0.11(0.10) | 0.53(0.09) | 3.3 (0.3) | 0.7 (0.2) |
| 9 | J193756+205905 | 14.46(0.02) | 0.71(0.03) | 12.70(0.02) | 0.27(0.03) | 0.42(0.03) | 0.49(0.05) | 12.21 | 0.15(0.10) | 0.19(0.12) | 0.78(0.09) | 2.6 (0.3) | 1.1 (0.2) |
Note. — Observed magnitudes and colors in the different IPHAS, 2MASS and IRAC bands, together with visual extinctions, A, and spectrophotometric distances derived from the IPHAS colors. The figures in brackets denote the 1 uncertainties. For each star, extinctions and distances were computed assuming all possible spectral types (A0-5), and the rms value of each quantity was added quadratically to the photometric errors to derive the final uncertainties quoted here.
| GLIPHAS | IPHAS | r′ | r′-i′ | r′-J | J | J-H | J-K | J-[3.6] | [3.6] | [3.6]-[4.5] | [3.6]-[5.8] | [3.6]-[8.0] | [24] |
|---|---|---|---|---|---|---|---|---|---|---|---|---|---|
| No. | ID | (mag) | (mag) | (mag) | (mag) | (mag) | (mag) | (mag) | (mag) | (mag) | (mag) | (mag) | (mag) |
| 1 | J190602+073418 | 15.20(0.02) | 1.07(0.03) | 2.16(0.03) | 13.04(0.02) | 0.40(0.04) | 0.57(0.04) | 0.73(0.06) | 12.31 | 0.10(0.12) | 0.10(0.14) | 1.30(0.11) | 7.93 0.11 |
| 2 | J190650+090108 | 16.89(0.01) | 1.60(0.01) | 3.44(0.03) | 13.45(0.03) | 0.57(0.04) | 0.91(0.05) | 1.18(0.11) | 12.27 | 0.46(0.17) | 0.27(0.16) | 2.84(0.18) | |
| 3 | J190952+070514 | 17.41(0.02) | 1.45(0.02) | 3.80(0.03) | 13.61(0.02) | 0.62(0.03) | 0.93(0.03) | 1.33(0.06) | 12.28 | -0.37(0.14) | 0.06(0.17) | 1.94(0.29) | |
| 4 | J191100+094543 | 15.18(0.01) | 1.18(0.02) | 3.00(0.02) | 12.18(0.02) | 0.57(0.03) | 1.04(0.03) | 1.98(0.04) | 10.20 | 0.55(0.07) | 1.05(0.06) | 1.82(0.05) | 7.06 0.11 |
| 5 | J191512+120907 | 17.54(0.04) | 1.19(0.05) | 2.89(0.06) | 14.65(0.05) | 0.58(0.07) | 0.82(0.08) | 0.89(0.08) | 13.76 | 0.07(0.17) | 1.13(0.25) | 2.06(0.14) | |
| 6 | J191947+132707 | 17.82(0.00) | 1.30(0.01) | 3.33(0.03) | 14.49(0.03) | 0.62(0.07) | 0.95(0.09) | 0.97(0.08) | 13.52 | 0.23(0.18) | 2.28(0.18) | 2.76(0.15) | |
| 7 | J192227+141309 | 14.83(0.04) | 0.95(0.05) | 2.35(0.04) | 12.48(0.02) | 0.34(0.04) | 0.55(0.03) | 0.82(0.06) | 11.66 | 0.02(0.09) | 0.65(0.18) | 1.52(0.33) | |
| 8 | J192612+163544 | 16.87(0.03) | 0.94(0.04) | 2.44(0.04) | 14.43(0.03) | 0.37(0.05) | 0.72(0.06) | 0.82(0.10) | 13.61 | 0.08(0.17) | 0.62(0.32) | 1.31(0.24) | |
| 9 | J192914+184004 | 14.53(0.02) | 0.85(0.03) | 2.12(0.03) | 12.41(0.02) | 0.36(0.03) | 0.52(0.03) | 0.68(0.05) | 11.73 | 0.33(0.09) | 0.66(0.10) | 2.06(0.07) | 6.40 0.11 |
| 10 | J192933+183415 | 14.15(0.01) | 0.68(0.01) | 1.81(0.02) | 12.34(0.02) | 0.42(0.03) | 0.77(0.03) | 1.28(0.06) | 11.06 | 0.19(0.07) | 0.38(0.08) | 1.29(0.06) | 7.61 0.10 |
| 11 | J193110+164225 | 17.54(0.00) | 1.35(0.01) | 3.22(0.03) | 14.32(0.03) | 0.45(0.05) | 0.79(0.04) | 0.95(0.07) | 13.37 | 0.14(0.14) | 0.98(0.27) | 1.67(0.19) | |
| 12 | J193117+185048 | 17.34(0.03) | 1.13(0.04) | 2.79(0.04) | 14.55(0.03) | 0.46(0.05) | 0.57(0.06) | 1.04(0.08) | 13.51 | 0.24(0.15) | 1.22(0.16) | 1.59(0.17) | |
| 13 | J193126+184131 | 15.74(0.00) | 0.99(0.01) | 2.48(0.02) | 13.26(0.02) | 0.47(0.03) | 0.79(0.03) | 0.82(0.06) | 12.44 | 0.05(0.11) | 0.56(0.14) | 1.53(0.18) | |
| 14 | J193259+195709 | 16.77(0.02) | 1.08(0.03) | 2.65(0.03) | 14.12(0.02) | 0.59(0.03) | 0.95(0.03) | 1.55(0.09) | 12.57 | 0.22(0.15) | 1.12(0.14) | 2.78(0.12) | |
| 15 | J193516+195803 | 15.97(0.00) | 0.77(0.01) | 1.94(0.02) | 14.03(0.02) | 0.34(0.04) | 0.49(0.05) | 0.58(0.07) | 13.45 | 0.04(0.13) | 0.51(0.32) | 1.58(0.22) | |
| 16 | J193555+194654 | 17.42(0.01) | 1.03(0.02) | 2.78(0.03) | 14.64(0.03) | 0.42(0.05) | 0.56(0.07) | 0.87(0.08) | 13.77 | 0.03(0.17) | 1.10(0.29) | 1.33(0.28) | |
| 17 | J194541+243253 | 15.20(0.10) | 0.54(0.14) | 1.53(0.11) | 13.67(0.03) | 0.23(0.05) | 0.38(0.05) | 0.69(0.07) | 12.98 | 0.44(0.12) | 1.11(0.14) | 1.57(0.09) | 8.36 0.15 |
Note. — Observed magnitudes and colors in the different IPHAS, 2MASS and IRAC bands, together with our measured 24-m fluxes from MIPSGAL images. The figures in brackets denote the 1 uncertainties.
| GLIPHAS | IPHAS | GLIMPSE | Ar | d | 3.6m | 4.5m | 5.8m | 8m | 24m | T | LIR/L⋆ |
|---|---|---|---|---|---|---|---|---|---|---|---|
| No. | ID | ID | (mag) | (kpc) | (mJy) | (mJy) | (mJy) | (mJy) | (mJy) | (K) | |
| 1 | J190602+073418 | G041.3305+00.2230 | 4.0 (0.2) | (0.8 0.2) | - | - | - | 2.0 (7.0 ) | 4.8 (9.0) | 283 (24) | 2.2e-03 |
| 2 | J190650+090108 | G042.7075+00.7117 | 6.0 (0.2) | (0.7 0.1) | - | - | - | 13.7 (6.0 ) | - | 211 | - |
| 3 | J190952+070514 | G041.3387-00.8442 | 5.5 (0.2) | (1.2 0.2) | - | - | - | 5.3 (3.1 ) | - | 194 | - |
| 4 | J191100+094543 | G043.8401+00.1431 | 4.4 (0.2) | (0.7 0.1) | 14.3 (10.3) | 20.1(11.8) | 25.7 (18.5) | 32.4 (33.5) | 10.4(8.9) | 654 (33) | 8.5e-03 |
| 5 | J191512+120907 | G046.4350+00.3389 | 4.5 (0.3) | (2.0 0.4) | - | - | - | 1.4 (7.1 ) | - | 243 ( | - |
| 6 | J191947+132707 | G048.1073-00.0432 | 4.9 (0.2) | (1.9 0.4) | - | - | 4.0 (5.3) | 3.7 (7.1 ) | - | 271 (63) | 1.9e-02 |
| 7 | J192227+141309 | G049.0889-00.2538 | 3.5 (0.3) | (0.9 0.2) | - | - | - | 5.1 (3.0 ) | 87.3 | 299 | - |
| 8 | J192612+163544 | G051.6091+00.0765 | 3.5 (0.3) | (2.3 0.5) | - | - | - | 0.6 (3.2 ) | - | 257 | - |
| 9 | J192914+184004 | G053.7744+00.4315 | 3.1 (0.2) | (0.9 0.2) | - | 2.1 (4.4) | 8.6 (14.9) | 19.9(9.2) | 298 (20) | 6.6e-03 | |
| 10 | J192933+183415 | G053.7251+00.3191 | 2.5 (0.2) | (1.0 0.2) | 3.3 (5.0) | 3.1 (7.4) | 3.4 (7.8) | 7.0 (20.7) | 15.6(9.6) | 497 (57) | 3.0e-03 |
| 11 | J193110+164225 | G052.2752-00.9138 | 5.1 (0.2) | (1.5 0.3) | - | - | - | 1.3 (4.3 ) | 5.4 | 245 | - |
| 12 | J193117+185048 | G054.1653+00.0894 | 4.2 (0.3) | (2.0 0.4) | - | - | 1.3 (5.2) | 1.1 (5.7 ) | 22.8 | 455 (20) | 4.3e-03 |
| 13 | J193126+184131 | G054.0455-00.0137 | 3.7 (0.2) | (1.2 0.3) | - | - | - | 2.3 (4.4 ) | - | 183 | - |
| 14 | J193259+195709 | G055.3273+00.2720 | 4.0 (0.3) | (1.7 0.4) | 0.9 (3.2) | 0.9 (3.0) | 2.8 (6.8) | 8.9 (11.3) | 46.9 | 342 (43) | 1.6e-02 |
| 15 | J193516+195803 | G055.6008-00.1905 | 2.9 (0.2) | (2.0 0.4) | - | - | - | 1.0 (3.7 ) | - | 168 | - |
| 16 | J193555+194654 | G055.5133-00.4151 | 3.8 (0.2) | (2.5 0.5) | - | - | - | 0.7 (3.0 ) | 0.8 | 367 | - |
| 17 | J194541+243253 | G060.7727-00.0227 | 1.9 (0.6) | (2.2 0.7) | - | 0.8 (4.1) | 1.6 (6.1) | 1.5 (14.0) | 3.3 (6.3) | 482 (15) | 3.8e-03 |
Note. — Derived parameters for stars with mid-IR excesses with respect to the SED of an A3V star normalised to the dereddened K-band fluxes. The excess fluxes listed for each wavelength are in mJy. The numbers in brackets denote the signal-to-noise ratios of the excess flux detections, except for the last column, where they represent 1 uncertainties. Only detections with S/N ratios larger than 3.0 are shown. For each star, extinctions and distances were computed assuming all possible spectral types (A0-5), and the RMS value of each quantity was added quadratically to the photometric errors to derive the final uncertainties quoted here. For sources that show excess fluxes at more than one wavelength the infrared excess LIR/L⋆ are shown.


References
- Aumann (1985) Aumann, H. H. 1985, PASP, 97, 885
- Aumann et al. (1984) Aumann, H. H., Beichman, C. A., Gillett, F. C., de Jong, T., Houck, J. R., Low, F. J., Neugebauer, G., Walker, R. G., & Wesselius, P. R. 1984, ApJ, 278, L23
- Aumann & Probst (1991) Aumann, H. H., & Probst, R. G. 1991, ApJ, 368, 264
- Backman & Paresce (1993) Backman, D. E., & Paresce, F. 1993, in Protostars and Planets III, ed. E. H. Levy & J. I. Lunine, 1253–1304
- Beichman et al. (2005) Beichman, C. A., Bryden, G., Rieke, G. H., Stansberry, J. A., Trilling, D. E., Stapelfeldt, K. R., Werner, M. W., Engelbracht, C. W., Blaylock, M., Gordon, K. D., Chen, C. H., Su, K. Y. L., & Hines, D. C. 2005, ApJ, 622, 1160
- Benjamin et al. (2003) Benjamin, R. A., Churchwell, E., Babler, B. L., Bania, T. M., Clemens, D. P., Cohen, M., Dickey, J. M., Indebetouw, R., Jackson, J. M., Kobulnicky, H. A., Lazarian, A., Marston, A. P., Mathis, J. S., Meade, M. R., Seager, S., Stolovy, S. R., Watson, C., Whitney, B. A., Wolff, M. J., & Wolfire, M. G. 2003, PASP, 115, 953
- Benjamin et al. (2005) Benjamin, R. A., Churchwell, E., Babler, B. L., Indebetouw, R., Meade, M. R., Whitney, B. A., Watson, C., Wolfire, M. G., Wolff, M. J., Ignace, R., Bania, T. M., Bracker, S., Clemens, D. P., Chomiuk, L., Cohen, M., Dickey, J. M., Jackson, J. M., Kobulnicky, H. A., Mercer, E. P., Mathis, J. S., Stolovy, S. R., & Uzpen, B. 2005, ApJ, 630, L149
- Bohlin (2007) Bohlin, R. C. 2007, in Astronomical Society of the Pacific Conference Series, Vol. 364, The Future of Photometric, Spectrophotometric and Polarimetric Standardization, ed. C. Sterken, 315
- Bronfman (1992) Bronfman, L. 1992, in Astrophysics and Space Science Library, Vol. 180, The Center, Bulge, and Disk of the Milky Way, ed. L. Blitz, 131
- Bryden et al. (2006) Bryden, G., Beichman, C. A., Trilling, D. E., Rieke, G. H., Holmes, E. K., Lawler, S. M., Stapelfeldt, K. R., Werner, M. W., Gautier, T. N., Blaylock, M., Gordon, K. D., Stansberry, J. A., & Su, K. Y. L. 2006, ApJ, 636, 1098
- Calvet et al. (2002) Calvet, N., D’Alessio, P., Hartmann, L., Wilner, D., Walsh, A., & Sitko, M. 2002, ApJ, 568, 1008
- Cardelli et al. (1989) Cardelli, J. A., Clayton, G. C., & Mathis, J. S. 1989, ApJ, 345, 245
- Carey et al. (2005) Carey, S. J., Noriega-Crespo, A., Price, S. D., Padgett, D. L., Kraemer, K. E., Indebetouw, R., Mizuno, D. R., Ali, B., Berriman, G. B., Boulanger, F., Cutri, R. M., Ingalls, J. G., Kuchar, T. A., Latter, W. B., Marleau, F. R., Miville-Deschenes, M. A., Molinari, S., Rebull, L. M., & Testi, L. 2005, in Bulletin of the American Astronomical Society, 1252
- Carpenter (2001) Carpenter, J. M. 2001, AJ, 121, 2851
- Cheng et al. (1992) Cheng, K.-P., Bruhweiler, F. C., Kondo, Y., & Grady, C. A. 1992, ApJ, 396, L83
- Churchwell et al. (2005) Churchwell, E. B., Carey, S. J., & GLIMPSE Team. 2005, American Astronomical Society Meeting Abstracts, 206
- Cieza et al. (2007) Cieza, L., et al. 2007, ApJ, 667, 308
- Clarke et al. (2005) Clarke, A. J., Oudmaijer, R. D., & Lumsden, S. L. 2005, MNRAS, 363, 1111
- Cohen et al. (1992) Cohen, M., Walker, R. G., Barlow, M. J., & Deacon, J. R. 1992, AJ, 104, 1650
- Currie et al. (2008) Currie, T., Kenyon, S. J., Balog, Z., Rieke, G., Bragg, A., & Bromley, B. 2008, ApJ, 672, 558
- Cutri et al. (2003) Cutri, R. M., Skrutskie, M. F., van Dyk, S., Beichman, C. A., Carpenter, J. M., Chester, T., Cambresy, L., Evans, T., Fowler, J., Gizis, J., Howard, E., Huchra, J., Jarrett, T., Kopan, E. L., Kirkpatrick, J. D., Light, R. M., Marsh, K. A., McCallon, H., Schneider, S., Stiening, R., Sykes, M., Weinberg, M., Wheaton, W. A., Wheelock, S., & Zacarias, N. 2003, in The IRSA 2MASS All-Sky Point Source Catalog, NASA/IPAC Infrared Science Archive. http://irsa.ipac.caltech.edu/applications/Gator/
- D’Alessio et al. (2001) D’Alessio, P., Calvet, N., & Hartmann, L. 2001, ApJ, 553, 321
- D’Alessio et al. (1999) D’Alessio, P., Calvet, N., Hartmann, L., Lizano, S., & Cantó, J. 1999, ApJ, 527, 893
- D’Alessio et al. (1998) D’Alessio, P., Canto, J., Calvet, N., & Lizano, S. 1998, ApJ, 500, 411
- D’Alessio et al. (2005) D’Alessio, P., Hartmann, L., Calvet, N., Franco-Hernández, R., Forrest, W. J., Sargent, B., Furlan, E., Uchida, K., Green, J. D., Watson, D. M., Chen, C. H., Kemper, F., Sloan, G. C., & Najita, J. 2005, ApJ, 621, 461
- Drew et al. (2005) Drew, J. E., Greimel, R., Irwin, M. J., Aungwerojwit, A., Barlow, M. J., Corradi, R. L. M., Drake, J. J., Gänsicke, B. T., Groot, P., Hales, A., Hopewell, E. C., Irwin, J., Knigge, C., Leisy, P., Lennon, D. J., Mampaso, A., Masheder, M. R. W., Matsuura, M., Morales-Rueda, L., Morris, R. A. H., Parker, Q. A., Phillipps, S., Rodriguez-Gil, P., Roelofs, G., Skillen, I., Sokoloski, J. L., Steeghs, D., Unruh, Y. C., Viironen, K., Vink, J. S., Walton, N. A., Witham, A., Wright, N., Zijlstra, A. A., & Zurita, A. 2005, MNRAS, 362, 753
- Drew et al. (2008) Drew, J. E., Greimel, R., Irwin, M. J., & Sale, S. E. 2008, MNRAS, 386, 1761
- Dullemond et al. (2007) Dullemond, C. P., Hollenbach, D., Kamp, I., & D’Alessio, P. 2007, in Protostars and Planets V, ed. B. Reipurth, D. Jewitt, & K. Keil, 555
- Dunkin et al. (1997) Dunkin, S. K., Barlow, M. J., & Ryan, S. G. 1997, MNRAS, 290, 165
- Egan et al. (1997) Egan, M. P., Price, S. D., Shipman, R. F., & Tedesco, E. 1997, BAAS, 29, 1294
- Fajardo-Acosta et al. (2000) Fajardo-Acosta, S. B., Beichman, C. A., & Cutri, R. M. 2000, ApJ, 538, L155
- Fazio et al. (2004) Fazio, G. G., Hora, J. L., Allen, L. E., Ashby, M. L. N., Barmby, P., Deutsch, L. K., Huang, J.-S., Kleiner, S., Marengo, M., Megeath, S. T., Melnick, G. J., Pahre, M. A., Patten, B. M., Polizotti, J., Smith, H. A., Taylor, R. S., Wang, Z., Willner, S. P., Hoffmann, W. F., Pipher, J. L., Forrest, W. J., McMurty, C. W., McCreight, C. R., McKelvey, M. E., McMurray, R. E., Koch, D. G., Moseley, S. H., Arendt, R. G., Mentzell, J. E., Marx, C. T., Losch, P., Mayman, P., Eichhorn, W., Krebs, D., Jhabvala, M., Gezari, D. Y., Fixsen, D. J., Flores, J., Shakoorzadeh, K., Jungo, R., Hakun, C., Workman, L., Karpati, G., Kichak, R., Whitley, R., Mann, S., Tollestrup, E. V., Eisenhardt, P., Stern, D., Gorjian, V., Bhattacharya, B., Carey, S., Nelson, B. O., Glaccum, W. J., Lacy, M., Lowrance, P. J., Laine, S., Reach, W. T., Stauffer, J. A., Surace, J. A., Wilson, G., Wright, E. L., Hoffman, A., Domingo, G., & Cohen, M. 2004, ApJS, 154, 10
- Gonzalez-Solares et al. (2008) Gonzalez-Solares, E. A., Walton, N. A., Greimel, R., Drew, J. E., Irwin, M. J., Sale, S. E., Andrews, K., Aungwerojwit, A., Barlow, M. J., van den Besselaar, E., Corradi, R. L. M., Gaensicke, B. T., Groot, P. J., Hales, A. S., Hopewell, E. C., Hu, H., Irwin, J., Knigge, C., Lagadec, E., Leisy, P., Lewis, J. R., Mampaso, A., Matsuura, M., Moont, B., Morales-Rueda, L., Morris, R. A. H., Naylor, T., Parker, Q. A., Prema, P., Pyrzas, S., Rixon, G. T., Rodriguez-Gil, P., Roelofs, G., Sabin, L., Skillen, I., Suso, J., Tata, R., Viironen, K., Vink, J. S., Witham, A., Wright, N. J., Zijlstra, A. A., Zurita, A., Drake, J., Fabregat, J., Lennon, D. J., Lucas, P. W., Martin, E. L., Steeghs, D., & Unruh, Y. C. 2008, MNRAS, 388, 89
- Hayashi et al. (1985) Hayashi, C., Nakazawa, K., & Nakagawa, Y. 1985, in Protostars and Planets II, ed. D. C. Black & M. S. Matthews, 1100
- Hernández et al. (2006) Hernández, J., Briceño, C., Calvet, N., Hartmann, L., Muzerolle, J., & Quintero, A. 2006, ApJ, 652, 472
- Horne (1986) Horne, K. 1986, PASP, 98, 609
- Houk et al. (1997) Houk, N., Swift, C. M., Murray, C. A., Penston, M. J., & Binney, J. J. 1997, in ESA SP-402: Hipparcos - Venice ’97, 279
- Hughes et al. (2008) Hughes, A. M., Wilner, D. J., Kamp, I., & Hogerheijde, M. R. 2008, ApJ, 681, 626
- Indebetouw et al. (2005) Indebetouw, R., Mathis, J. S., Babler, B. L., Meade, M. R., Watson, C., Whitney, B. A., Wolff, M. J., Wolfire, M. G., Cohen, M., Bania, T. M., Benjamin, R. A., Clemens, D. P., Dickey, J. M., Jackson, J. M., Kobulnicky, H. A., Marston, A. P., Mercer, E. P., Stauffer, J. R., Stolovy, S. R., & Churchwell, E. 2005, ApJ, 619, 931
- Irwin (1985) Irwin, M. J. 1985, MNRAS, 214, 575
- Kenyon & Hartmann (1995) Kenyon, S. J., & Hartmann, L. 1995, ApJs, 101, 117
- Kurucz (1979) Kurucz, R. L. 1979, ApJS, 40, 1
- Lagrange et al. (2000) Lagrange, A.-M., Backman, D. E., & Artymowicz, P. 2000, in Protostars and Planets IV, ed. V. Mannings, A. P. Boss, & S. S. Russell, 639
- Mannings & Barlow (1998) Mannings, V., & Barlow, M. J. 1998, ApJ, 497, 330
- Meyer et al. (2007) Meyer, M. R., Backman, D. E., Weinberger, A. J., & Wyatt, M. C. 2007, in Protostars and Planets V, ed. B. Reipurth, D. Jewitt, & K. Keil, 573
- Miller & Scalo (1979) Miller, G. E., & Scalo, J. M. 1979, ApJS, 41, 513
- Oke (1990) Oke, J. B. 1990, AJ, 99, 1621
- Oudmaijer et al. (1992) Oudmaijer, R. D., van der Veen, W. E. C. J., Waters, L. B. F. M., Trams, N. R., Waelkens, C., & Engelsman, E. 1992, A&AS, 96, 625
- Pickles (1998) Pickles, A. J. 1998, PASP, 110, 863
- Plets & Vynckier (1999) Plets, H., & Vynckier, C. 1999, A&A, 343, 496
- Rhee et al. (2007) Rhee, J. H., Song, I., Zuckerman, B., & McElwain, M. 2007, ApJ, 660, 1556
- Rieke et al. (2005) Rieke, G. H., Su, K. Y. L., Stansberry, J. A., Trilling, D., Bryden, G., Muzerolle, J., White, B., Gorlova, N., Young, E. T., Beichman, C. A., Stapelfeldt, K. R., & Hines, D. C. 2005, ApJ, 620, 1010
- Rieke et al. (2004) Rieke, G. H., Young, E. T., Engelbracht, C. W., Kelly, D. M., Low, F. J., Haller, E. E., Beeman, J. W., Gordon, K. D., Stansberry, J. A., Misselt, K. A., Cadien, J., Morrison, J. E., Rivlis, G., Latter, W. B., Noriega-Crespo, A., Padgett, D. L., Stapelfeldt, K. R., Hines, D. C., Egami, E., Muzerolle, J., Alonso-Herrero, A., Blaylock, M., Dole, H., Hinz, J. L., Le Floc’h, E., Papovich, C., Pérez-González, P. G., Smith, P. S., Su, K. Y. L., Bennett, L., Frayer, D. T., Henderson, D., Lu, N., Masci, F., Pesenson, M., Rebull, L., Rho, J., Keene, J., Stolovy, S., Wachter, S., Wheaton, W., Werner, M. W., & Richards, P. L. 2004, ApJS, 154, 25
- Robitaille et al. (2007) Robitaille, T. P., Whitney, B. A., Indebetouw, R., & Wood, K. 2007, ApJS, 169, 328
- Russeil (2003) Russeil, D. 2003, A&A, 397, 133
- Sale et al. (2008) Sale, S. E., et al. 2008, arXiv:0810.2547
- Schlegel et al. (1998) Schlegel, D. J., Finkbeiner, D. P., & Davis, M. 1998, ApJ, 500, 525
- Schmidt-Kaler (1982) Schmidt-Kaler, T. 1982, in Landolt-Bornstein: Numerical Data and functional Relationships in Science and Technology. New Series, Vol. 2b, ed. K. Schaifers & H. H. Voigt (Springer, Berlin)
- Sicilia-Aguilar et al. (2006) Sicilia-Aguilar, A., Hartmann, L., Calvet, N., Megeath, S. T., Muzerolle, J., Allen, L., D’Alessio, P., Merín, B., Stauffer, J., Young, E., & Lada, C. 2006, ApJ, 638, 897
- Silverstone (2000) Silverstone, M. D. 2000, Ph.D. Thesis, University of California
- Silverstone et al. (2006) Silverstone, M. D., Meyer, M. R., Mamajek, E. E., Hines, D. C., Hillenbrand, L. A., Najita, J., Pascucci, I., Bouwman, J., Kim, J. S., Carpenter, J. M., Stauffer, J. R., Backman, D. E., Moro-Martin, A., Henning, T., Wolf, S., Brooke, T. Y., & Padgett, D. L. 2006, ApJ, 639, 1138
- Smith et al. (2006) Smith, P. S., Hines, D. C., Low, F. J., Gehrz, R. D., Polomski, E. F., & Woodward, C. E. 2006, ApJ, 644, L125
- Song et al. (2001) Song, I., Caillault, J.-P., Barrado y Navascués, D., & Stauffer, J. R. 2001, ApJ, 546, 352
- Su et al. (2006) Su, K. Y. L., Rieke, G. H., Stansberry, J. A., Bryden, G., Stapelfeldt, K. R., Trilling, D. E., Muzerolle, J., Beichman, C. A., Moro-Martin, A., Hines, D. C., & Werner, M. W. 2006, ApJ, 653, 675
- Sylvester & Mannings (2000) Sylvester, R. J., & Mannings, V. 2000, MNRAS, 313, 73
- Sylvester et al. (1996) Sylvester, R. J., Skinner, C. J., Barlow, M. J., & Mannings, V. 1996, MNRAS, 279, 915
- Uzpen et al. (2005) Uzpen, B., Kobulnicky, H. A., Olsen, K. A. G., Clemens, D. P., Laurance, T. L., Meade, M. R., Babler, B. L., Indebetouw, R., Whitney, B. A., Watson, C., Wolfire, M. G., Wolff, M. J., Benjamin, R. A., Bania, T. M., Cohen, M., Devine, K. E., Dickey, J. M., Heitsch, F., Jackson, J. M., Marston, A. P., Mathis, J. S., Mercer, E. P., Stauffer, J. R., Stolovy, S. R., Backman, D. E., & Churchwell, E. 2005, ApJ, 629, 512
- Uzpen et al. (2007) Uzpen, B., Kobulnicky, H. A., Monson, A. J., Pierce, M. J., Clemens, D. P., Backman, D. E., Meade, M. R., Babler, B. L., Indebetouw, R., Whitney, B. A., Watson, C., Wolfire, M. G., Benjamin, R. A., Bracker, S., Bania, T. M., Cohen, M., Cyganowski, C. J., Devine, K. E., Heitsch, F., Jackson, J. M., Mathis, J. S., Mercer, E. P., Povich, M. S., Rho, J., Robitaille, T. P., Sewilo, M., Stolovy, S. R., Watson, D. F., Wolff, M. J., & Churchwell, E. 2007, ApJ, 658, 1264
- Uzpen et al. (2008) Uzpen, B., Kobulnicky, H. A., & Kinemuchi, K. 2008, arXiv:0812.2847
- Valdes et al. (2004) Valdes, F., Gupta, R., Rose, J. A., Singh, H. P., & Bell, D. J. 2004, ApJS, 152, 251
- Walker & Wolstencroft (1988) Walker, H. J., & Wolstencroft, R. D. 1988, PASP, 100, 1509
- Waters & Waelkens (1998) Waters, L. B. F. M., & Waelkens, C. 1998, ARA&A, 36, 233
- Witham et al. (2007) Witham, A. R., Knigge, C., Drew, J. E., Greimel, R., Steeghs, D., Gaensicke, B. T., Groot, P. J., & Mampaso, A., 2008, MNRAS, 384, 1277
- Wright et al. (2003) Wright, C. O., Egan, M. P., Kraemer, K. E., & Price, S. D. 2003, AJ, 125, 359
- Wuchterl et al. (2000) Wuchterl, G., Guillot, T., & Lissauer, J. J. 2000, in Protostars and Planets IV, ed. V. Mannings, A. P. Boss, & S. S. Russell, 1081
- Zuckerman (2001) Zuckerman, B. 2001, ARA&A, 39, 549