XMM-Newton and Suzaku analysis of the Fe K complex in the Seyfert 1 galaxy Mrk 509
Abstract
We report on partially overlapping XMM-Newton (260 ks) and Suzaku (100 ks) observations of the iron K band in the nearby, bright Seyfert 1 galaxy Mrk 509. The source shows a resolved neutral Fe K line, most probably produced in the outer part of the accretion disc. Moreover, the source shows further emission blue–ward of the 6.4 keV line due to ionized material. This emission is well reproduced by a broad line produced in the accretion disc, while it cannot be easily described by scattering or emission from photo–ionized gas at rest. The summed spectrum of all XMM-Newton observations shows the presence of a narrow absorption line at 7.3 keV produced by highly ionized outflowing material. A spectral variability study of the XMM-Newton data shows an indication for an excess of variability at 6.6–6.7 keV. These variations may be produced in the red wing of the broad ionized line or by variation of a further absorption structure. The Suzaku data indicate that the neutral Fe K line intensity is consistent with being constant on long timescales (of a few years) and they also confirm as most likely the interpretation of the excess blueshifted emission in terms of a broad ionized Fe line. The average Suzaku spectrum differs from the XMM-Newton one for the disappearance of the 7.3 keV absorption line and around 6.7 keV, where the XMM-Newton data alone suggested variability.
keywords:
galaxies: individual: Mrk 509 – galaxies: active – galaxies: Seyfert – X-rays: galaxies1 Introduction
Deep investigations of the Fe K band in the brightest AGNs allow us to probe the presence of highly ionized emitting/absorbing components from the innermost regions around the central black hole. The high–sensitivity X–ray satellites XMM-Newton and Chandra have shown that the presence of a narrow core of the lowly ionized Fe K line is nearly ubiquitous (Yaqoob & Padhmanaban 2004; Guainazzi et al. 2006; Nandra et al. 2007) and that ionized components of the line, generally associated with emission from photo– and/or collisionally– ionized distant gas are also common (NGC 5506, NGC 7213, IC 4329A; Bianchi et al. 2003; Page et al. 2003; Reynolds et al. 2004; Ashton et al. 2004; Longinotti et al. 2007; see also Bianchi et al. 2002; 2005). The presence of broad (neutral or ionized) components of Fe K lines can only be tested via relatively long exposures of the brightest sources (e.g., Guainazzi et al. 2006; Nandra et al. 2007). Moreover, the observational evidence for broad lines and their interpretation in terms of relativistic effects may be questioned when an important absorbing ionized component is present. Spectral variability studies help in disentangling the different, often degenerate, spectral components (Ponti et al. 2004; Iwasawa et al. 2004; Ponti et al. 2006; Tombesi et al. 2007; Petrucci et al. 2007; DeMarco et al., in prep.).
Mrk 509 (z=0.034397) is the brightest Seyfert 1 of the hard (2–100 keV) X-ray sky (Malizia et al. 1999; Revnivtsev et al. 2004; Sazonov et al. 2007) that is not strongly affected by a warm absorber component (Pounds et al. 2001; Yaqoob et al. 2003). The HETG Chandra observation confirms the presence of a narrow component of the Fe K line with an equivalent width (EW) of 50 eV (Yaqoob et al. 2004). The presence of a second ionized component of the Fe K line at 6.7–6.9 keV has been claimed by Pounds et al. (2001) who fitted it using a relativistic profile, but Page et al. (2003) showed that the same spectral feature was consistent also with a simple Compton reflection component from distant material. The broad–band BeppoSAX spectrum and, in particular, the soft excess, have been fitted by De Rosa et al. (2004) with a reflection component from a ionized disc in addition to a neutral reflection component. Finally, Dadina et al. (2005) found evidence of absorption due to transient, relativistically red–blue– shifted ionized matter.
Here we present the spectral and variability analysis of the complex Fe K band of Mrk 509, using the whole set of XMM-Newton and Suzaku observations. The paper is organized as follows. Section 2 describes the observations and the data reduction. In Sect. 3 the spectral analysis of the EPIC-pn data of the Fe K band (using phenomenological models) is presented. In particular in Sect. 3.3, to check for the presence of an absorption line, the EPIC-MOS data have also been considered. In Sect. 3.4 the spectral variability analysis, within the XMM-Newton observations, is presented. Sect. 4 describes the spectral analysis of the Fe K band of the Suzaku summed (XIS0+XIS3) data and the detailed comparison with the spectrum accumulated during the XMM-Newton observations. In Sect. 4.1 the HXD-pin data are introduced in order to estimate the amount of reflection continuum present in the source spectrum. Finally, a more physically self-consistent fit of the EPIC spectra of all the EPIC instruments (EPIC-pn plus the two EPIC-MOS) is investigated in Sect. 5. The results of our analysis are discussed in Sect. 6, followed by conclusions in Sect. 7.
2 Observations and data reduction
Mrk 509 was observed 5 times by XMM-Newton on 2000–10–25, 2001–04–20, 2005–10–16, 2005–10–20 and 2006–04–25. All observations were performed with the EPIC–pn CCD camera operating in small window observing mode and with the thin filter applied. The total pn observation time is of about 260 ks. Since the live–time of the pn CCD in small window mode is 71 per cent, the net exposure of the summed spectrum is of about 180 ks. The analysis has been made with the SAS software (version 7.1.0), starting from the ODF files. Single and double events are selected for the pn data, while only single events are used for the MOS camera because of a slight pile–up effect. For the pn data we checked that the results obtained using only single events (that allow a superior energy resolution) are consistent with those from the MOS, finding good agreement. The source and background photons are extracted from a region of 40 arcsec within the same CCD of the source both for the pn and MOS data. Response matrices were generated using the SAS tasks RMFGEN and ARFGEN.
Suzaku observed Mrk 509 four times on 2006–04–25, 2006–10–14, 2006–11–15 and 2006–11–27. The last XMM-Newton and the first Suzaku observations overlap over a period of 25 ks. Event files from version 2.0.6.13 of the Suzaku pipeline processing were used and spectra were extracted using XSELECT. Response matrices and ancillary response files were generated for each XIS using XISRMFGEN and XISSIMARFGEN version 2007–05–14. The XIS1 camera data are not considered here because of the relatively low effective area in the Fe K energy interval, while the XIS2 is unavailable for observations performed after November 2006. We used the data obtained during the overlapping interval to check whether the EPIC pn and MOS data on one hand and the Suzaku XIS0 and XIS3 data on the other hand are consistent within the inter–calibration uncertainties. We found an overall good agreement between the data from the two satellites, the parameters related to the main iron emission features and the power–law continuum being the same within the errors (except for the XIS2 camera above 8 keV). The total XIS observation time is about 108 ks. The source and background photons are extracted from a region of 4.3 arcmin within the same CCD of the source. For the HXD/PIN, instrumental background spectra and response matrices provided by the HXD instrument team have been used. An additional component accounting for the CXB has been included in the spectral fits of the PIN data.
All spectral fits were performed using the Xspec software (version 12.3.0) and include neutral Galactic absorption (4.21020 cm-2; Dickey & Lockman 1990), the energies are rest frame if not specified otherwise, and the errors are reported at the 90 per cent confidence level for one interesting parameter (Avni 1976). The sum of the spectra has been performed with the MATHPHA, ADDRMF and ADDARF tools within the HEASOFT package (version 6.1).
3 Fe K band emission of Mrk 509: the XMM-Newton data
The primary goal of this investigation is the study of the Fe K line band; therefore, in order to avoid the effects of the warm absorber (although not strong; Yaqoob et al. 2003; Smith et al. 2007) and of the soft excess, we concentrate on the analysis of the data in the 3.5–10 keV band only. A detailed study of the warm absorber and its variations will be performed by Detmers et al. (in prep), we can nevertheless anticipate that the warm absorber has negligible effect in the Fe K energy band and thus on the results presented here.
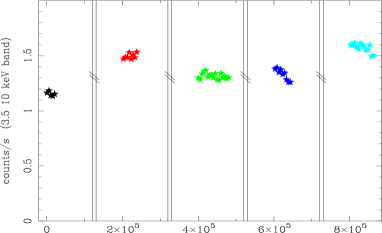
Figure 1 shows the source light curve in the 3.5–10 keV energy band obtained from the XMM-Newton pointings. Mrk 509 shows variations of the order of 30 per cent over the different observations, while almost no variability is detected within each observation. Only during the fourth observation the source shows significant variability, with a mean fractional rms of about 0.04.
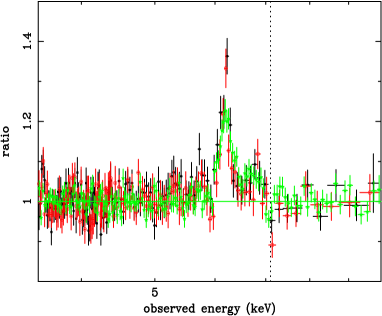
We start the analysis of the XMM-Newton data considering the spectra from the EPIC-pn camera only (including the EPIC-MOS data only when a check of the significance of a feature is required; see Sect. 3.3). We have fitted a simple power law model to the 3.5–10 keV data and found that the spectral index steepens with increasing flux. It goes from 1.540.03 to 1.720.03 for fluxes of 2.510-11 and 3.310-11 erg cm-2 s-1, respectively (3.010-11 – 4.310-11 erg cm-2 s-1, in the 2–10 keV band). We firstly phenomenologically fitted the Fe K complex of each single observation with a series of emission-absorption lines (see also 3.3) and checked that the results on the parameters of Fe K complex obtained in each observation are consistent within the errors (not a surprising result in light of the low statistics of the single spectra and weakness of the ionized features; see 3.4). Hence, we concluded that the continuum variations do not strongly affect the observed shape of the narrow–band emission/absorption structures in the Fe K band. Thus, in order to improve the signal–to–noise ratio and thus to detail the fine structures of the Fe K band, the spectra of all the XMM-Newton observations have been summed (see 3.4 for the study of the source spectral variability). The summed mean EPIC–pn spectrum has been grouped in order to have at least 1000 counts in each data bin. Moreover, this binning criterion ensures to have at least 30 data–points per keV in the 4–7 keV band, where the Fe K complex is expected to contribute. This guarantees a good sampling of the energy resolution of the instrument and the possibility of fully exploiting the spectral potentials of the EPIC instruments. Fig. 2 shows the ratio between the data and the best–fit power law. The energy band used during the fit has been restricted to 3.5–5 and 8–10 keV, in order to avoid the Fe K band, hence measuring the underlying continuum.


The resulting best–fit power–law continuum has a photon index of 1.630.01 and very well reproduces the source emission (=170.0 for 163 degrees of freedom, dof) outside the Fe K band. The inclusion of the Fe K band shows that other components are necessary to reproduce it (=753.9 for 307 dof). The bad statistical result is explained by the presence of clear spectral complexity in the 6–7 keV band.
3.1 The 6.4 keV emission line
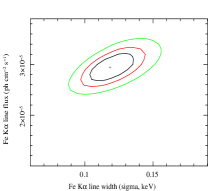
Panel a of Fig. 2 shows the clear evidence for a prominent emission line, consistent with a neutral Fe K line at 6.4 keV. We therefore added a Gaussian emission line to the model, obtaining a very significant improvement of the fit (=392.1 for the addition of 3 dof). The best–fit energy of the line is 6.420.02 keV, consistent with emission from neutral or slightly ionised material. The line has an equivalent width of 698 eV and is clearly resolved (=0.120.02 keV), as shown by the contour plot in the left panel of Fig. 3.
The residuals in panel b of Fig. 2 show no excess redward of this emission line, which could have been indicative of emission from relativistically redshifted neutral material.
3.2 The ionized Fe K emission line
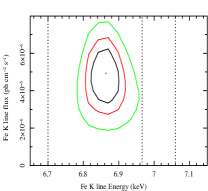
An excess is, however, present in the range 6.5–7 keV (Fig. 2, panel a). If modeled with a Fe K component with the expected energy (fixed at 7.06 keV) and forced to have an intensity of 0.15 of the K (Palmeri et al. 2003a,b; Basko 1978; Molendi et al. 2003) and a width equal to the Fe K line (i.e. assuming that the K and K line originate from one and the same material), the fit improves significantly (=20.3). Nonetheless, significant residuals are still present in the 6.5–6.9 keV band (panel b of Fig.2). If this further excess is modelled with a narrow Gaussian line (=25 for 2 additional dof), the feature (EW=124 eV) is found to peak at E=6.860.04 keV (see panel c of Fig. 2 and right panel of Fig. 3). Thus, the energy centroid is not consistent with the line being produced by either Fe XXV or Fe XXVI (right panel of Fig. 3) in a scattering medium distant from the X-rays source (Bianchi et al. 2002; 2004). The higher energy transition of the Fe XXV complex is the ”resonant line” expected at 6.7 keV (see e.g. Bianchi et al. 2005). Thus, to save this interpretation, it is required that the photo-ionized gas has a significant blueshift (5700 km/s, if the line is associated to Fe XXV) or redshift (4500 km/s, for Fe XXVI). Then, instead of fitting the ionized excess with a single line, we fitted it with two narrow lines forcing their energies to be 6.7 and 6.96 keV. The fit clearly worsens (=326.7 for 302 dof, corresponding to a for the same dof). However, if the gas is allowed to be outflowing, the fit improves (=4.3 for the addition of 1 new parameter; =312.3 for 301 dof; the EW are 8.9 and 12.4 eV for the Fe XXV and Fe XXVI lines, respectively) as respect to the single narrow emission line and it results to have a common velocity of 3500 km/s.
Alternatively, the excess could be produced by a single broad line coming from matter quite close to the source of high–energy photons (in this case the Fe K emission is composed by Fe K+ plus another Fe K line). Leaving the width of the line free to vary, the fit improves, with =311.1 (panel d Fig. 2) and of 5.5, with respect to the single narrow ionized emission line fit, and of 1.3 for the same dof with respect to the best–fit model with two narrow ionized lines. The resulting broad ionized Fe K line has EW=239 eV and =0.14 keV. The best–fit energy of the line does not change significantly (E=6.86 keV); however, in this case the emission is consistent (at the 99 per cent confidence level) with either Fe XXV or Fe XXVI. Although the statistical improvement is not highly significant, in the following we will consider that the 6.8–6.9 keV excess is indeed associated with a resolved emission line.
3.3 Ionized absorption?
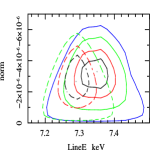
The XMM-Newton data also display a narrow absorption feature at E7 keV (observed frame; see Fig. 2, panel d). Since this feature is very close to the broad excess we just discussed, its significance and intensity are degenerate with the broad emission–line parameters. In order to gain some insight, we then fixed the broad emission–line parameters at the best–fit ones obtained before the addition of a narrow ( fixed at 1 eV) Gaussian absorption line component. In this case, the line is significant at the 99 per cent confidence level (dashed contours of Fig. 4; =15.5 for 2 additional parameters; see also panel e of Fig. 2). Once the MOS data111 The shapes of the emission/absorption lines in the MOS instruments appear slightly narrower, although consistent with the values obtained with the pn instrument. are added, the significance of this feature increases to 99.9 per cent (solid contours of Fig. 4), in both cases, of a broad and of a narrow ionized emission line. The best fit energy and EW of the line are E=7.28 keV and EW=14.9 eV, E=7.33 keV and EW=13.1 eV, in the pn alone and in the pn+MOS, respectively.
3.4 Time resolved spectral variability and total rms spectrum
One of the goals of the present analysis is to search for time–variation of the emission/absorption features of the Fe K complex. To measure possible variations in the Fe K band, the mean EPIC-pn spectra of each of the 5 XMM-Newton observations have been studied. The spectra are fitted with the same model composed by a power law plus three emission lines for the Fe K, K (with the width fixed at the best–fit value, =0.12 keV) and the broad ionized Fe K line. The low statistics of the spectra of the single observations prevents us from the detection of significant spectral variability of the weak ionised emission/absorption lines. The neutral Fe K line is better constrained and we find that its EW is anti–correlated with the level of the continuum, as expected for a constant line.
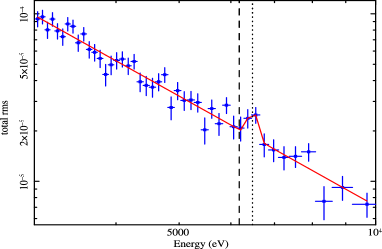
A different, more sensitive, way to detect an excess of spectral variability is the total rms function. The upper panel of Fig. 5 displays the shape of the summed spectrum in the Fe K line band. The lower panel shows the total rms spectrum (Revnivtsev et al. 1999; Papadakis et al. 2005) calculated with time bins of 4.5 ks. The total rms is defined by the formula:
| (1) |
where S2 is the source variance in a given energy interval E; is the scatter introduced by the Poissonian noise and arf is the telescope effective area convolved with the response matrix222The total rms spectrum provides the intrinsic source spectrum of the variable component. Nevertheless, we measure the variance as observed through the instrument. Thus, the sharp features in the source spectrum, as well as the effects of the features on the effective area, are broadened by the instrumental spectral resolution. For this reason, to obtain the total rms spectrum, we take into account the convolution of the effective area with the spectral response.. This function shows the spectrum of the varying component only, in which any constant component is removed and has been computed by using the different XMM-Newton observations as if they were contiguous. The total rms spectrum may be reproduced by a power law with a spectral index of 2.13 (=46.4 for 43 dof). Thus, the variable component is steeper than the observed power law in the mean spectrum, in agreement with the mentioned observed steepening of the photon index () with flux. The –flux correlation is commonly observed in Seyfert galaxies and has been interpreted as being due to the flux-correlated variations of the power-law slope produced in a corona above an accretion disc and related to the changes in the input soft seed photons (e.g. Haardt, Maraschi & Ghisellini 1997; Maraschi & Haardt 1997; Poutanen & Fabian 1999; Zdziarski et al. 2003). These models predict the presence of a pivot point, that would correspond to a minimum in the total rms spectrum. The observation of a perfect power law shape (see Fig. 5) indicates that the pivot point (if present) has to be outside the 3–10 keV energy band. On the other hand, the slope -flux behaviour can be explained in terms of a two-component model (McHardy, Papadakis & Uttley 1998; Shih, Iwasawa & Fabian 2002) in which a constant-slope power law varies in normalization only, while a harder component remains approximately constant, hardening the spectral slope at low flux levels only, when it becomes prominent in the hard band. In this scenario the spectral index of the variable component is equal to the one of the total rms spectrum, that is =2.13.
Moreover we note that at the energy of the neutral and ionized Fe K line components, no excess of variability is present, in agreement with these components being constant, while an indication for an excess of variability is present around 6.7 keV. In order to compute the significance of this variability feature, a narrow Gaussian line has been added to the modelling of the total rms spectrum. The best–fit energy of the additional line is 6.69 keV, with a fixed at the instrumental energy resolution, while the resulting is 8.9 for the addition of 2 parameters (that corresponds to an F–test significance of 98.8 per cent). Introducing the line, the continuum spectral index steepens to . The dashed line in Fig. 5 highlights the centroid energy of the neutral Fe K line, while the dotted line (at 6.7 keV, rest frame) is placed at the maximum of the variability excess. This energy corresponds to a drop of emission in the real spectrum, as we shall discuss in more detail in Section 5.

4 The Suzaku view of the Fe K band emission
As mentioned in 2, the source was also observed with Suzaku. The first 25 ks Suzaku observation is simultaneous with the last XMM-Newton pointing. The source spectra of all the instruments are in very good agreement, during the simultaneous observation. The spectrum is also consistent with the presence of the emission and absorption lines, as observed in the mean XMM-Newton spectrum, nevertheless, due to the low statistics of the 25 ks spectrum and the weakness of the ionized features, it is not possible to perform a detailed comparison. Only the presence of the strong Fe K line can be investigated, the ionized emission and absorption lines are not constrained in the 25 ks Suzaku exposure.
Also during the 4 Suzaku pointings, Mrk 509 has shown little variability, with flux changes lower than 10–15 per cent, hampering any spectral variability study. Fig. 6 shows the XMM-Newton (black) and Suzaku XIS0+XIS3 (red) summed mean spectra. The data were fitted, in the 3.5–5 and 7.5–10 keV bands, with a simple power law and Galactic absorption: the ratio of the data to the best fit model is shown in Fig. 6. The source emission varied between the XMM-Newton and the Suzaku observations. The best–fit spectral index and the 3.5–10 keV band fluxes are: =1.630.01 and =1.710.02 and 2.6310-11 and 3.1110-11 ergs cm-2 s-1, during the XMM-Newton and Suzaku observations, respectively. The neutral and ionized Fe K emission lines appear constant, while some differences are present at 6.7 keV, the same energy where the XMM-Newton data were suggesting an increase of variability. Other more subtle differences appears at 7 keV, where the absorption line imprints its presence in the XMM-Newton data only.
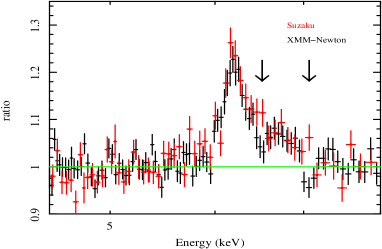
The Suzaku spectrum of Mrk 509 shows, in good agreement with the XMM-Newton one, a resolved neutral Fe K line smoothly joining with a higher energy excess, most likely due to ionized iron emission (see Fig. 6). Given that no absorption lines around 6.7 keV or 7.3 keV are present in the Suzaku data, the spectrum may be useful to infer the properties of the emission lines more clearly.
The XIS0+XIS3 Suzaku summed spectrum has been fitted in the 3.5–10 keV band with a power law plus two resolved Gaussian emission lines to reproduce the emission from Fe K+. The parameters of the Fe K line are free to vary, while the Fe K ones are constrained as in 3.2. This fit leaves large residuals (=1379.8 for 1337 dof) in the Fe K band. In this respect, it is difficult to describe the 6.5 keV excess with a single narrow ionized Fe line (either due to Fe XXV or Fe XXVI). In fact, although the addition of a narrow line is significant (=20.1 for 2 more parameters), it leaves residuals in the Fe K band. This remaining excess can be reproduced (=5.9 for 1 more parameter), in a photoionized gas scenario, by a blend of two unresolved ionized lines, requiring three emission lines to fit the Fe K band (FeK+, Fe XXV and Fe XXVI). In this case, such as in the analysis of the XMM-Newton mean spectrum, a blueshift of this component is suggested (v=2600 km s-1). However, the best–fit model (this scenario is strengthened by the lack of narrow peaks) suggests that the excess may be in fact associated with a broad ionized Fe line (over which the 6.7 keV and 7.3 keV absorption lines are most likely superimposed, but during the XMM-Newton observation only). In fact considering a broad Fe line instead of the two narrow lines we obtain an improvement of =9.7 for the same dof (see Table 1, model A).
| 3.5–10 keV | BEST–FIT | SPECTRA | |||||||
|---|---|---|---|---|---|---|---|---|---|
| Suzaku | |||||||||
| pl norma | ENeut. | Neut. | ANeut.b (EW)c | EIon. | Ion./rin | AIon.b (EW)c | /dof | ||
| keV | keV | keV | keV/rg | ||||||
| A | 1.720.02 | 1.120.02 | 6.420.03 | 0.06 | 1.70.5 (32) | 6.540.09 | 0.400.1 | 4.61.2 (90) | 1344/1340 |
| B | 1.720.02 | 1.120.02 | 6.420.02 | 0.07 | 2.10.5 (40) | 6.610.08 | 2410 | 3.40.8 (79) | 1346/1340 |
| Self-consistent model | |||||||||
| XMM-Newton | |||||||||
| pl norma | ENeut. | Neut. | ANeut.b | Incl. | ARefl.Ion.b | ||||
| keV | keV | deg | erg cm s-1 | ||||||
| C | 1.700.01 | 0.920.04 | 6.410.01 | 0.070.01 | 2.20.3 | 472 | 11 | 0.9 | |
| NHd | log() | z | /dof | ||||||
| 5.8 | 5.15 | 0.0484 | 894.3/876 |
Thus, the Suzaku data indicate that the broad excess at 6.5–6.6 keV is indeed due to a broad line rather than a blend of narrow ionized Fe lines. Since broad lines may arise because of relativistic effects in the inner regions of the accretion flow, we tested this hypothesis by fitting the excess at 6.5–6.6 keV with a diskline profile. The statistics of the spectrum is not such to allow us to constrain all the parameters of the ionized diskline model. Thus, the disc reflectivity index has been fixed at the standard value (, where the emissivity is proportional to ), the outer disc radius and inclinations to 400 gravitational radii (rg) and 30∘, respectively. The broad line is consistent with being produced in the accretion disc (Table 1, Model B); however, the emission from the innermost part of the disc is not required, the lower limit on the inner disc radius being 10–15 rg. As clear from Fig. 6, the Suzaku data do not require any ionized Fe K absorption structures.
In order to quantify the differences between the Suzaku and XMM-Newton spectra (and, in particular, the reality of the absorption structures at 6.7 and 7.3 keV appearing in the XMM-Newton spectrum only) we fixed all the parameters of the Suzaku model (apart from the intensity and spectral index of the direct power law) and fit the XMM-Newton data with that model. This corresponds to assuming that the intrinsic line shapes do not vary between the two observations. Then, a narrow Gaussian line has been added to the XMM-Newton model to estimate the significance of the putative absorption structures. The improvement in the spectral fitting is evident, as indicated by the =28.3 and 22 in the case of a line at E=6.720.04 keV and E=7.290.04 keV, respectively. The presence of these spectral features only in the XMM-Newton observations is thus indicative of variability at energies 6.6–6.7 and 7.3 keV.
4.1 The Suzaku pin data to constrain the reflection fraction
We add the pin data to measure the amount of reflection continuum. We note that the pin data provide a good quality spectrum up to 50 keV. The model used involves a direct power law plus a neutral reflection component ( model in ; Magdziarz & Zdziarski 1995) plus the Fe K+ resolved lines and a broad (DISKLINE) component of the line. As for model B we fix some of the parameters of the DISKLINE profile (disc inclination=30∘, rout=400 rg and =-3). Moreover we assume a high–energy cut off of 100 keV and Solar abundance. Thus, by fitting the 3–50 keV band data, we obtained a reflection fraction and a spectral index =1.76. The total EW of the emission lines above the reflected continuum (about 1.2 keV) is broadly consistent with the theoretical expectations (Matt et al. 1996) and with what observed in Compton thick Seyfert 2 galaxies, where the primary continuum is absorbed and only the reflection is observed. Nevertheless, also for this source, as already known from previous studies (Zdziarski et al. 1999), we observe that the spectral index and the reflection fraction are degenerate and strongly depend on the energy band considered. In fact, if the 2–10 keV band is considered, the reflection fraction increases, resulting to be =1.1 and the power–law photon index of =1.88. The total EW of the Fe emission lines above the reflected continuum are about 750 eV. Again these values are broadly in agreement with expectations (Matt et al. 1996).
5 A physically self-consistent fit: Possible origin of the spectral features
The analysis of the XMM-Newton and Suzaku data shows evidence for the presence of: i) a resolved, although not very broad, (0.12 keV) neutral Fe K line and associated Fe K emission; ii) an ionized Fe K emission line inconsistent with emission from a distant scattering material at rest and most likely produced in the accretion disc; iii) an absorption line at 7.3 keV, present in the summed spectrum of all XMM-Newton observations only; iv) an indication for an enhancement of variability - both by considering the XMM-Newton data alone and by comparison between the two data sets - at 6.7 keV that could be either due to the high variability of the red wing of the broad ionized Fe K line, possibly associated with a variation of the ionisation of the disc, or to a second ionized absorption line.
These emission/absorption components are partially inter–connected to each other given the limited CCD resolution onboard XMM-Newton and Suzaku. Thus we re–fit the XMM-Newton (both the pn and MOS in the 3.5–10 keV energy band) data with a model containing components that better describe the physical processes occurring in the AGN. In particular, we consider two Gaussian lines for the Fe K and K emission plus a neutral reflection component (pexrav in xspec) with a reflection fraction (consistent with the constraints given by the Suzaku pin data). The Fe K line has an equivalent width of 1 keV above the reflection continuum. Moreover, we fit the broad ionized Fe K line with a fully self–consistent relativistic ionised disc reflection component (reflion model in Xspec; Ross & Fabian 2005, convolved with a LAOR kernel; KDBLUR in Xspec).
The statistics prevents us from constraining the parameters of the relativistic profile. Standard values for the relativistic profile are assumed, with the disc inner and outer radii and the emissivity of 6, 400 rg, and 3, respectively. Finally, the 7.3 keV absorption line has been fitted with a photoionised absorption model (zxipcf model in Xspec; Miller et al. 2007; Reeves et al. 2008; Model C, Table 1), assuming a total covering factor.
Table 1 shows the best–fit parameters. Once the presence of the reflection continuum is taken into account, the power law slope becomes steeper (=1.700.01, 0.07) as compared to the fit with a simple power law and emission absorption lines (see §3). The best fit energy of the neutral Fe K line is E=6.410.01 keV, consistent with being produced by neutral material, and results to be narrower (=0.070.01 keV) than in the previous fits. The ionized emission line is fitted with a ionized disc reflection model. The only free parameters of such a component are the inclination and ionisation parameter of the disc that result to be 472∘ and =11 erg cm s-1 (Model C, Table 1). The material producing the 7.3 keV absorption feature in the XMM-Newton data has to be highly ionized, as also indicated by the absence of a strong continuum curvature. In fact, the best ionization parameter is log()=5.15 and the column density cm-2. Nevertheless the observed energy of the absorption feature does not correspond to any strong absorption features, thus there is evidence for this absorption component to be outflowing with a shift c ( km s-1). The resulting is 894.3 for 876 dof.
6 Discussion
This study clearly shows that long exposures are need to disentangle the different emitting/absorbing components contributing to the shape–variability of the Fe K complex in Seyfert galaxies. Here we discuss the origin of both neutral and ionized emission and absorption Fe lines in Mrk 509 which allow to have insights in the innermost regions of the accretion flow.
6.1 Neutral/lowly ionized Fe emission line
Once the broad ionized line is fitted, the width of the Fe K line lowers to a value of 7211 eV (see Fig. 3) that corresponds to a FWHM(Fe K)=80001300 km s-1 (see Model C, Table 1). This value is slightly higher than that measured by Yaqoob & Padmanabhan with a 50 ks HETG Chandra observation (2820 km s-1). The FWHM of the Fe K line is larger than the width of the H line (FWHM(H)=3430240 km s-1; Peterson et al. 2004; Marziani et al. 2003), indicating that the Fe line is produced closer to the center than the optical BLR and, of course, than the torus postulated in unified models; we note that a wide range of FWHM values is observed for the BLR and the Fe K lines in local Seyfert galaxies (Nandra 2006). However, the UV and soft X-ray spectra of Mrk 509 show evidence for the presence of broad emission lines with FWHM of 11000 km s-1 (Kriss et al. 2000). The origin of these UV and soft–X lines is still highly debated, nevertheless they may indicate that the BLR region is stratified, i.e. that these lines are not produced in the optical BLR but in the inner part of a stratified BLR region (see also Kaastra et al. 2002; Costantini et al. 2007), possibly as close as 2000 rg from the center (about 0.012 pc, being the mass of the black hole in Mrk 509 M1.430.12108 M⊙ Peterson et al. 2004; Marziani et al. 2003). Nevertheless, if the line is produced in the innermost part of a stratified BLR, it would require either a higher covering fraction or a higher column density than generally derived from the optical and ultraviolet bands. Simulations by Leahy & Creighton (1993) show that about 70 per cent of the sky, as seen by the central source, has to be covered in order to produce the Fe K line, if the broad line clouds have column densities of about 1023 cm-2, while the typical values for the BLR clouds covering fractions are of the order of 10–25 per cent (Davidson & Netzer 1979; Goad & Koratkar 1998). Alternatively, the Fe K line may be produced by reflection by the outer part of the accretion disc.
6.2 Ionized Fe emission lines
The spectrum of Mrk 509 shows emission from ionized iron, consistent with either Fe XXV or Fe XXVI, implying photoionized gas outflowing or inflowing respectively. Alternatively, the ionized Fe K emission may be produced by reflection from the inner part of the accretion disc.
In fact, both the XMM-Newton and the Suzaku data are consistent with the two scenarios, even if a slightly better fit (=5.5 and 9.7 for XMM-Newton and Suzaku, respectively) is obtained in the case of broad line. Moreover in the case of narrow emission lines the emitting gas should have a significant outflow (for Fe XXV, v3500 and 2600 km s-1 for XMM-Newton and Suzaku, respectively) or inflow (for Fe XXVI, v4500 km s-1) with velocities higher than what generally observed (Reynolds et al. 2004; Longinotti et al. 2007; but see also Bianchi et al. 2008 that detect an outflow of v=900 km s-1). On the other hand, the high radiative efficiency of the source (=0.12; Woo & Urry 2002) suggests that the accretion disc is stable down to the innermost regions around the BH, where the reflection component should be shaped by relativistic effects. For these reasons, although an outflowing emitting gas is not excluded, the broad line interpretation seems favoured. In fact, the profile of the line is compatible with being shaped by relativistic effects, consistent with its origin being in the surface of an accretion disc, in vicinity of a black hole. Nevertheless, the width of the line is not a compelling evidence. The observed broadening of the line can be reproduced also with the Comptonization process occurring in the upper layer of the ionized accretion disc. Moreover, we stress that the main evidences for the presence of a broad Fe K line comes from the mean summed spectrum. The process of summing spectra, although is a powerful way to extract information, might be dangerous in presence of spectral variability and when applied to observations taken many years apart. Thus, the final answer on the origin of these ionized lines will be obtained with either a higher resolution observation or with significantly longer XMM-Newton exposures.
6.3 Ionized Fe absorption lines
The XMM-Newton data indicate the presence of a highly ionized absorption component, the best fit column density being NH=5.81022 cm-2 and ionization log()=5.15. Moreover, fitting the absorption with this model, it results that the absorber has to be blueshifted by 0.0484 c. The blueshift corresponds to an outflow velocity of 14000 km s-1. The structure implies a significant blueshift if the absorber is located in the core of Mrk 509 but, considering the systemic velocity of the galaxy, its energy is also consistent with a local absorber (McKernan et al. 2004; 2005; Risaliti et al. 2005; Young et al. 2005; Miniutti et al. 2007; but see also Reeves et al. 2008). Nevertheless, the observed variability between the XMM-Newton and Suzaku observations points towards an origin within Mrk 509.
An hint of variability is observed around 6.7 keV both in the XMM-Newton data and by comparing the XMM-Newton and Suzaku spectra. This could be due in principle to variability in the red wing of the ionized emission line. However, the total rms spectrum shows a peak of variability that is consistent with being narrow, thus it may suggest an alternative explanation. Indeed, the observed difference between the XMM-Newton and Suzaku Fe K line shapes could be due to a further ionized absorption component, present only the XMM-Newton observations, with a column density NH=5.41021 cm-2 and ionization parameter log()=2.04. When the structure at 6.7 keV is fitted with such a component, an absorption structure appears around 7.3 keV, nevertheless its equivalent width is not strong enough to reproduce the total absorption feature; moreover, it appears at slightly different energy, not completely fitting the 7.3 keV line. Thus, the absorption structures at 6.7 and the one at 7.3 keV may be connected and they may be indicative of another absorption screen. If this further lower ionization absorption component is present, different absorption feature would be expected (due to the low ionization and high column density) at lower energies. Smith et al. (2007) analyzed the RGS data and detected two absorption components with physical parameters similar (log()=2.14 and 3.26; NH=0.75 and 5.5 cm-2) to the ones that we infer, strengthening this interpretation. There is also evidence for another, higher ionization, mildly relativistic, and variable ionized component in the XMM data. The study of this more extreme component is addressed in another paper (Cappi et al., in preparation).
The observation of highly ionized matter in the core of Mrk 509 is in line with its high BH mass and accretion rate. In fact, we remind that at the Eddington limit the radiation pressure equals the gravitational pull, however the densities of the matter lowers with the BH mass (Shakura & Sunyaev 1976). Thus the ionization of the material surrounding high accretion rate and BH mass AGNs, such as Mrk 509, should be higher than normal. We stress, however, that in order to detail the physical parameters of the ionised emitter/absorber, further long observations are required.
7 Conclusions
The Fe K band of Mrk 509 shows a rich variety of emission/absorption components. The XMM-Newton and Suzaku data shows evidence for the presence of:
-
•
a resolved, although not very broad, (0.07 keV) neutral Fe K line and associated Fe K emission. The width of the line suggests that the 6.4 keV line is produced in the outer part of the accretion disc (the broad line region or torus emission seem unlikely). The measured reflection fraction is consistent in this case with the intensity of the line, while a covering factor or column density higher than generally observed would be required if the line were produced in the BLR or the torus;
-
•
both the Suzaku and the XMM-Newton data show an excess due to ionized Fe K emission. Both datasets show a superior fit when a broad ionized line coming from the central parts of the accretion disc is considered. The data are inconsistent with narrow emission from a distant scattering material at rest, while it can not be excluded if the gas is outflowing (v3500 km s-1)
-
•
both EPIC–pn and MOS data show an absorption line at 7.3 keV, present in the summed spectrum of all XMM-Newton observations only. This component confirms the presence of highly ionized, outflowing (v14000 s-1), gas along the line of sight. The comparison between XMM-Newton and Suzaku suggests a variability of this component;
-
•
a hint of an enhancement of variability - both by considering the XMM-Newton data alone and by comparison between the two data sets - at 6.7 keV that could be either due to the high variability of the red wing of the broad ionized Fe K line, possibly associated with a variation of the ionisation of the disc, or to a second ionized absorption line.
Acknowledgments
This paper is based on observations obtained with XMM-Newton, an ESA science mission with instruments and contributions directly funded by ESA Member States and NASA. This work was partly supported by the ANR under grant number ANR-06-JCJC-0047. GP, CV and SB thank for support the Italian Space Agency (contracts ASI–INAF I/023/05/0 and ASI I/088/06/0). GM acknowledge funding from Ministerio de Ciencia e Innovación through a Ramón y Cajal contract. GP thanks Regis Terrier, Andrea Goldwurm and Fabio Mattana for useful discussion. We would like to thank the anonymous referee for the detailed reading of the manuscript and for the comments that greatly improved the readability of the paper.
References
- Ashton et al. (2004) Ashton, C. E., Page, M. J., Blustin, A. J., Puchnarewicz, E. M., Branduardi-Raymont, G., Mason, K. O., Córdova, F. A., & Priedhorsky, W. C. 2004, MNRAS, 355, 73
- Avni (1976) Avni, Y. 1976, ApJ, 210, 642
- Basko (1978) Basko, M. M. 1978, ApJ, 223, 268
- Bianchi & Matt (2002) Bianchi, S., & Matt, G. 2002, A&A, 387, 76
- Bianchi et al. (2003) Bianchi, S., Balestra, I., Matt, G., Guainazzi, M., & Perola, G. C. 2003, A&A, 402, 141
- Bianchi et al. (2004) Bianchi, S., Matt, G., Balestra, I., Guainazzi, M., & Perola, G. C. 2004, A&A, 422, 65
- Bianchi et al. (2005) Bianchi, S., Matt, G., Nicastro, F., Porquet, D., & Dubau, J. 2005, MNRAS, 357, 599
- Bianchi et al. (2008) Bianchi, S., La Franca, F., Matt, G., Guainazzi, M., Jimenez Bailón, E., Longinotti, A. L., Nicastro, F., & Pentericci, L. 2008, MNRAS, 389, L52
- Costantini et al. (2007) Costantini, E., et al. 2007, A&A, 461, 121
- Dadina et al. (2005) Dadina, M., Cappi, M., Malaguti, G., Ponti, G., & de Rosa, A. 2005, A&A, 442, 461
- Davidson & Netzer (1979) Davidson, K., & Netzer, H. 1979, Reviews of Modern Physics, 51, 715
- De Rosa et al. (2004) De Rosa, A., Piro, L., Matt, G., & Perola, G. C. 2004, A&A, 413, 895
- Dickey & Lockman (1990) Dickey, J. M., & Lockman, F. J. 1990, ARA&A, 28, 215
- Goad & Koratkar (1998) Goad, M., & Koratkar, A. 1998, ApJ, 495, 718
- Guainazzi et al. (2006) Guainazzi, M., Bianchi, S., & Dovčiak, M. 2006, Astronomische Nachrichten, 327, 1032
- Haardt et al. (1997) Haardt, F., Maraschi, L., & Ghisellini, G. 1997, ApJ, 476, 620
- Iwasawa et al. (2004) Iwasawa, K., Miniutti, G., & Fabian, A. C. 2004, MNRAS, 355, 1073
- Leahy & Creighton (1993) Leahy, D. A., & Creighton, J. 1993, MNRAS, 263, 314
- Longinotti et al. (2007) Longinotti, A. L., Bianchi, S., Santos-Lleo, M., Rodríguez-Pascual, P., Guainazzi, M., Cardaci, M., & Pollock, A. M. T. 2007, A&A, 470, 73
- Kaastra et al. (2002) Kaastra, J. S., Steenbrugge, K. C., Raassen, A. J. J., van der Meer, R. L. J., Brinkman, A. C., Liedahl, D. A., Behar, E., & de Rosa, A. 2002, A&A, 386, 427
- Kriss et al. (2000) Kriss, G. A., et al. 2000, ApJ, 538, L17
- Magdziarz & Zdziarski (1995) Magdziarz, P., & Zdziarski, A. A. 1995, MNRAS, 273, 837
- Malizia et al. (1999) Malizia, A., Bassani, L., Zhang, S. N., Dean, A. J., Paciesas, W. S., & Palumbo, G. G. C. 1999, ApJ, 519, 637
- Maraschi & Haardt (1997) Maraschi, L., & Haardt, F. 1997, IAU Colloq. 163: Accretion Phenomena and Related Outflows, 121, 101
- Marziani et al. (2003) Marziani, P., Sulentic, J. W., Zamanov, R., Calvani, M., Dultzin-Hacyan, D., Bachev, R., & Zwitter, T. 2003, ApJS, 145, 199
- Matt et al. (1996) Matt, G., Fabian, A. C., & Ross, R. R. 1996, MNRAS, 278, 1111
- McHardy et al. (1998) McHardy, I. M., Papadakis, I. E., & Uttley, P. 1998, The Active X-ray Sky: Results from BeppoSAX and RXTE, 509
- McKernan et al. (2004) McKernan, B., Yaqoob, T., & Reynolds, C. S. 2004, ApJ, 617, 232
- McKernan et al. (2005) McKernan, B., Yaqoob, T., & Reynolds, C. S. 2005, MNRAS, 361, 1337
- Miller et al. (2007) Miller, L., Turner, T. J., Reeves, J. N., George, I. M., Kraemer, S. B., & Wingert, B. 2007, A&A, 463, 131
- Miniutti et al. (2007) Miniutti, G., et al. 2007, PASJ, 59, 315
- Molendi et al. (2003) Molendi, S., Bianchi, S., & Matt, G. 2003, MNRAS, 343, L1
- Nandra (2006) Nandra, K. 2006, MNRAS, 368, L62
- Nandra et al. (2007) Nandra, K., O’Neill, P. M., George, I. M., & Reeves, J. N. 2007, MNRAS, 382, 194
- Page et al. (2003) Page, M. J., Davis, S. W., & Salvi, N. J. 2003, MNRAS, 343, 1241
- Palmeri et al. (2003) Palmeri, P., Mendoza, C., Kallman, T. R., Bautista, M. A., & Meléndez, M. 2003, A&A, 410, 359
- Palmeri et al. (2003) Palmeri, P., Mendoza, C., Kallman, T. R., & Bautista, M. A. 2003, A&A, 403, 1175
- Papadakis et al. (2005) Papadakis, I. E., Kazanas, D., & Akylas, A. 2005, ApJ, 631, 727
- Peterson et al. (2004) Peterson, B. M., et al. 2004, ApJ, 613, 682
- Petrucci et al. (2007) Petrucci, P. O., et al. 2007, A&A, 470, 889
- Ponti et al. (2004) Ponti, G., Cappi, M., Dadina, M., & Malaguti, G. 2004, A&A, 417, 451
- Ponti et al. (2006) Ponti, G., Miniutti, G., Cappi, M., Maraschi, L., Fabian, A. C., & Iwasawa, K. 2006, MNRAS, 368, 903
- Pounds et al. (2001) Pounds, K., Reeves, J., O’Brien, P., Page, K., Turner, M., & Nayakshin, S. 2001, ApJ, 559, 181
- Poutanen & Fabian (1999) Poutanen, J., & Fabian, A. C. 1999, MNRAS, 306, L31
- Reeves et al. (2008) Reeves, J., Done, C., Pounds, K., Terashima, Y., Hayashida, K., Anabuki, N., Uchino, M., & Turner, M. 2008, MNRAS, 385, L108
- Reynolds et al. (2004) Reynolds, C. S., Brenneman, L. W., Wilms, J., & Kaiser, M. E. 2004, MNRAS, 352, 205
- Revnivtsev et al. (1999) Revnivtsev, M., Borozdin, K., & Emelyanov, A. 1999, A&A, 344, L25
- Revnivtsev et al. (2004) Revnivtsev, M., Sazonov, S., Jahoda, K., & Gilfanov, M. 2004, A&A, 418, 927
- Risaliti et al. (2005) Risaliti, G., Bianchi, S., Matt, G., Baldi, A., Elvis, M., Fabbiano, G., & Zezas, A. 2005, ApJ, 630, L129
- Ross & Fabian (2005) Ross, R. R., & Fabian, A. C. 2005, MNRAS, 358, 211
- Sazonov et al. (2007) Sazonov, S., Revnivtsev, M., Krivonos, R., Churazov, E., & Sunyaev, R. 2007, A&A, 462, 57
- Shakura & Sunyaev (1976) Shakura, N. I., & Sunyaev, R. A. 1976, MNRAS, 175, 613
- Shih et al. (2003) Shih, D. C., Iwasawa, K., & Fabian, A. C. 2003, MNRAS, 341, 973
- Smith et al. (2007) Smith, R. A. N., Page, M. J., & Branduardi-Raymont, G. 2007, A&A, 461, 135
- Tombesi et al. (2007) Tombesi, F., de Marco, B., Iwasawa, K., Cappi, M., Dadina, M., Ponti, G., Miniutti, G., & Palumbo, G. G. C. 2007, A&A, 467, 1057
- Woo & Urry (2002) Woo, J.-H., & Urry, C. M. 2002, ApJ, 579, 530
- Young et al. (2005) Young, A. J., Lee, J. C., Fabian, A. C., Reynolds, C. S., Gibson, R. R., & Canizares, C. R. 2005, ApJ, 631, 733
- Yaqoob et al. (2003) Yaqoob, T., McKernan, B., Kraemer, S. B., Crenshaw, D. M., Gabel, J. R., George, I. M., & Turner, T. J. 2003, ApJ, 582, 105
- (59) Yaqoob, T., & Padmanabhan, U. 2004, ApJ, 604, 63
- Zdziarski et al. (1999) Zdziarski, A. A., Lubinski, P., & Smith, D. A. 1999, MNRAS, 303, L11
- Zdziarski et al. (2003) Zdziarski, A. A., Lubiński, P., Gilfanov, M., & Revnivtsev, M. 2003, MNRAS, 342, 355