Transitions between turbulent states in rotating Rayleigh-Bénard convection
Abstract
Weakly-rotating turbulent Rayleigh-Bénard convection was studied experimentally and numerically. With increasing rotation and large enough Rayleigh number an abrupt transition from a turbulent state with nearly rotation-independent heat transport to another turbulent state with enhanced heat transfer is observed at a critical inverse Rossby number . Whereas for the strength of the large-scale convection-roll is either enhanced or essentially unmodified depending on parameters, its strength is increasingly diminished beyond where it competes with Ekman vortices that cause vertical fluid transport and thus heat-transfer enhancement.
pacs:
47.27.te,47.32.Ef,47.20.Bp,47.27.ekTurbulence evolves either through a sequence of bifurcations, possibly passing through periodic and chaotic states Schuster (1988) as in Rayleigh-Bénard (RB) convection Bodenschatz et al. (2000) when the Rayleigh number (to be defined below) is increased, or through subcritical bifurcations Trefethen et al. (1993) as in pipe or Couette flow. Once the flow is turbulent, it usually is characterized by large random fluctuations in space and time and by a loss of temporal and spatial coherence. For the turbulent state common wisdom is that the large fluctuations assure that the phase-space is always fully explored by the dynamics, and that transitions between potentially different states that might be explored as a control parameter is changed are washed out.
Contrary to the above, we show that sharp transitions between distinct turbulent states can occur in RB convection Kadanoff (2001); Ahlers et al. (2009) when the system is rotated about a vertical axis at an angular velocity . In dimensionless form the angular velocity is given by the inverse Rossby number . Here is the height of a cylindrical RB sample, the thermal expansion coefficient, the temperature difference between the bottom and top plate, and the gravitational acceleration. At relatively small where the turbulence is not yet fully developed, we find that the system evolves smoothly as is increased. However, when is larger and the turbulent state of the non-rotating system is well established, we find that sharp transitions between different turbulent states occur, with different heat-transfer properties and different flow organizations. Similar sharp transitions between different states were reported recently for turbulent flows in liquid sodium Monchaux et al. (2007), where the increase of the magnetic Reynolds number beyond a certain threshold led to the spontaneous creation of a mean magnetic field and where sharp bifurcations between different turbulent states were observed when a control parameter was tuned. One sees that sharp transitions, usually regarded as characteristic of low-dimensional systems, are displayed also by the fully developed turbulent flows.
We present both experimental measurements and direct numerical simulations (DNS) for a sample with diameter equal to . They cover different but overlapping parameter ranges and thus complement each other. Where they overlap they agree very well. Without or with only weak rotation, for this system it is known that there are thermal boundary layers (BLs) just below the top and above the bottom plate, with a temperature drop approximately equal to across each. The bulk of the system contains vigorous fluctuations, and in the time average a large-scale circulation (LSC) that consists of a single convection roll with up-flow and down-flow opposite each other and near the side wall.
The numerical scheme was already described in refs. Verzicco and Orlandi (1996); Oresta et al. (2007); Kunnen et al. (2008a); Zhong et al. (2008). The experimental apparatus also is well documented Brown et al. (2005); Zhong et al. (2008) and we give only a few relevant details. The sample cell had cm, with plexiglas side walls of thickness 0.32 cm and copper top and bottom plates kept at temperatures and , respectively. The fluid was water. The Rayleigh number ( and are the kinematic viscosity and the thermal diffusivity, respectively), Prandtl number , and were computed from the fluid properties at the mean temperature . The Nusselt number was determined from the effective thermal conductivity ( is the heat-current density) and the conductivity of the quiescent state. Eight thermistors, labeled , were imbedded in small holes drilled horizontally from the outside into but not penetrating the side wall Brown and Ahlers (2007). They were equally spaced around the circumference at the horizontal mid-plane (. A second and third set were located at and . Since the LSC carried warm (cold) fluid from the bottom (top) plate up (down) the side wall, these thermistors detected the location of the upflow (downflow) of the LSC by indicating a relatively high (low) temperature. To determine the orientation and strength of the LSC, we fit the function
| (1) |
separately at each time step, to the eight temperature readings obtained from the thermistors at . Similarly we obtained , , and for the top level at . At only the mean temperature was used in the current work.
In Ref. Zhong et al. (2008) we explored as a function of , , and in a large parameter regime, ranging towards strong rotation () and from small to large . Here we focus on (typical of water) and weak rotation () to study the transition from the non-rotating state at towards the rotating case for different .
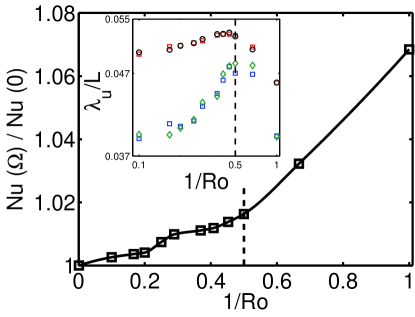
We start with numerical results for the relatively small which is not accessible with the current experimental apparatus because is too large (and thus too small to be accessible with reasonable ). Those simulations where done on a grid of nodes in the radial, azimuthal and vertical directions, respectively, allowing for a sufficient resolution of the small scales both inside the bulk of turbulence and in the BLs adjacent to the bottom and top plates where the grid-point density was enhanced Oresta et al. (2007); Kunnen et al. (2008b). The small allowed for very long runs of 2500 large-eddy turnover-times (where is the free-fall velocity ) and thus excellent statistics. Fig. 1 shows the ratio of in the presence of rotation to as function of . This ratio increases rather smoothly with increasing rotation. This increase is thought to be due to the formation of the Ekman vortices which align vertically and suck up hot (cold) fluid from the lower (upper) BLs (Ekman pumping) Hart (1995); Kunnen et al. (2006, 2008b); Zhong et al. (2008). This is supported by the change in character of the kinetic BL near the bottom and top walls based on the maximum root-mean-square (rms) velocities in the azimuthal direction. For the BL thickness (based on the rms azimuthal velocity) is roughly constant or even slightly increases, and for it behaves according to Ekman’s theory and decreases with increasing rotation rate, see the inset in Fig. 1. As the turbulence is not yet fully developed, a smooth transition between the non-rotating and the rotating turbulent states is observed.
Both numerical and experimental findings are very different for the larger and where the turbulence of the non-rotating system is well developed. In Fig. 2 one sees that now there is a critical inverse Rossby number at which the heat-transfer enhancement suddenly sets in. For weaker rotation the data are consistent with no heat-transfer modification as compared to the non-rotating case. For this larger one sees that experimental and numerical data (now based on a resolution of , see Zhong et al. (2008)) agree extremely well. In Ref. Kunnen et al. (2008b) data from DNS were reported on the relative Nusselt number for higher Rayleigh number, and , which – as we now realize retrospectively – showed a similar transition also at .
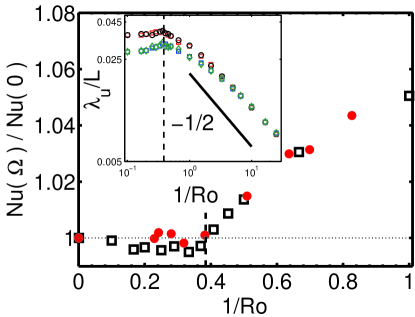
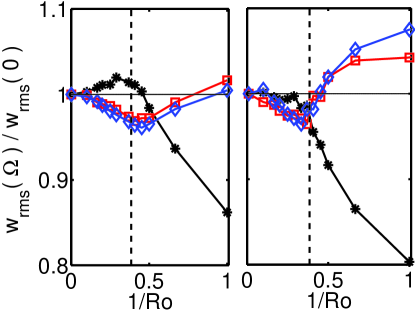
To characterize the flow field, we numerically calculated the rms velocities averaged over horizontal planes and over the entire volume, respectively. The maximum rms azimuthal and radial velocities near the top and bottom wall have again been used to define the thickness of the kinetic BL, which is shown in the inset of Fig. 2 for and . The critical inverse Rossby number clearly distinguishes between two regimes: one with a constant BL thickness (in agreement with the presence of the LSC and the Prandtl-Blasius BL) and another one with decreasing BL thickness for . The scaling with rotation rate is in agreement with Ekman BL theory . Further support can be found in Ref. Kunnen (2008) where similar data for the kinetic BL thickness have been plotted for and . For the normalized (by the value without rotation) volume-averaged vertical velocity fluctuations strongly decrease, indicating that the LSC becomes weaker, see Fig. 3. The decrease in normalized volume averaged vertical velocity fluctuations coincides with a significant increase of the horizontal average at the edge of the thermal BLs indicating enhanced Ekman transport (see also insets in Figs. 1 and 2). These averages provide additional support for the mechanism of the sudden transition seen in and indicate an abrupt change from a LSC-dominated flow structure for to a regime where Ekman pumping plays a progressively important role as increases.
Our interpretation for the two regimes is as follows: Once the vertical vortices organize so that Ekman pumping sucks in the detaching plumes from the BLs, those plumes are no longer available to feed the LSC which consequently diminishes in intensity. A transition between the two regimes should occur once the buoyancy force, causing the LSC, and the Coriolis force, causing Ekman pumping, balance. The ratio of the respective velocity scales is the Rossby number. For the buoyancy-driven LSC is dominant, whereas for the Coriolis force and thus Ekman pumping is stronger. The transition between the two regimes should occur at , consistent with the observed .
One wonders of course why the transition in between the two regimes is sudden (in ) for and less abrupt for the smaller shown in Fig. 1. Our interpretation is that for that relatively low Rayleigh number the flow is not yet fully turbulent so that spatial coherences Ahlers et al. (2009) exist throughout the cell. For the vortical structures have time to form and survive for a while in the LSC-induced wind for lower , and provide some weak Ekman pumping and thus enhanced , while they are easily swept away by the much stronger wind of the LSC for higher . In the latter case no enhancement is thus observed.
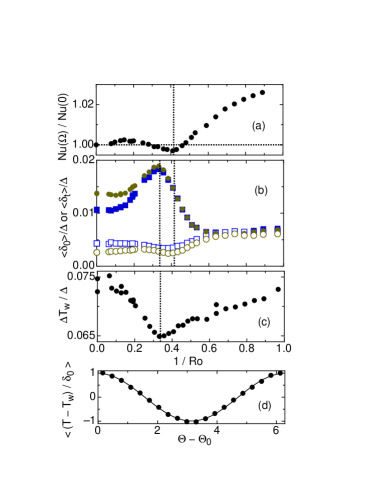
At higher (where is larger and temperature amplitudes can thus more easily be measured) and an even more complex situation is revealed, as seen in Fig. 4 (here DNS is not available because it would be too time consuming). We find that now (Fig. 4a), after a slight increase, first decreases, but these changes are only a small fraction of a percent. Then undergoes a sharp transition at (vertical dotted line in Fig. 4a) and beyond it increases due to Ekman pumping. Comparison with Figs. 1 and 2 shows that the transition of is not strictly at a constant , but that depends weakly on and/or .
The LSC amplitudes and determined from fits of Eq. (1) to the sidewall-thermometer readings are shown in Fig. 4b as solid symbols. Consistent with the results reported in Ref. Brown and Ahlers (2007), when there is no rotation (). This inequality disappears as increases. Both amplitudes first increase by nearly a factor of two. At , where the two amplitudes have just become equal to each other, they begin to decrease quite suddenly and remain equal to each other up to the largest . The transition at is indicated by the leftmost vertical dotted line in Figs. 4b and c. At that point there also is a transition revealed by the vertical temperature difference along the side wall as seen in Fig. 4c which shows as a function of . Consistent with the initially enhanced LSC amplitudes and , these results first show a reduction of the thermal gradient as the LSC becomes more vigorous, but then reveal an increase due to enhanced plume and/or vortex activity above .
Also of interest are the rms fluctuations about the fit of Eq. (1) to the temperature measurements at the horizontal midplane (), and similarly at . They are shown as open symbols in Fig. 4b. These fluctuations begin to rise at rather than at . Then they soon become comparable to and , suggesting that the LSC becomes more and more hidden in a fluctuating environment. Nonetheless, remnants of the LSC survive and can be found when the fluctuations are averaged away, as shown in Fig. 4d. There we see that even for the time average of the deviation from the mean temperature retains a near-perfect cosine shape.
From these measurements we infer that the establishment of the Ekman-pumping mechanism is a three-stage process. First, up to , the time-averaged LSC amplitudes, such as , nearly double in value (see Fig. 4b) and thereby reduce the vertical thermal gradient along the wall (see Fig. 4c). Beyond there is an enhanced accumulation of plumes and vortices, which coincides with an increase of the BL thickness near onset as shown by the simulations at lower Ra (see insets in Figs. 1 and 2). This accumulation detracts from the driving of the LSC but the flow is not yet organized into effective Ekman vortices. This organization sets in at , leads to Ekman pumping, and enhances and reduces the strength of the LSC as supported by the volume-average of , see Fig. 3 (for lower Ra). This sequence of events is altered as (or presumably also ) is changed, but it is remarkable that for fully developed turbulent RB convection sharp bifurcations occur similar to those observed in turbulent flows in liquid sodium by Monchaux et al. (2007). These resemble the characteristic series of bifurcations well-known from low-dimensional chaos.
Acknowledgements: We thank R. Verzicco for providing us with the numerical code and T. Mullin for discussions. The experimental work was supported by the U.S. National Science Foundation through Grant DMR07-02111 and the numerical work by the Foundation for Fundamental Research on Matter (FOM) and the National Computing Facilities (NCF), both sponsored by NWO.
References
- Schuster (1988) H. G. Schuster, Deterministic Chaos (VCH, Weinheim, 1988).
- Bodenschatz et al. (2000) E. Bodenschatz, W. Pesch, and G. Ahlers, Ann. Rev. Fluid Mech. 32, 709 (2000).
- Trefethen et al. (1993) L. Trefethen, A. Trefethen, S. Reddy, and T. Driscol, Science 261, 578 (1993); S. Grossmann, Rev. Mod. Phys. 72, 603 (2000); R. R. Kerswell, Nonlinearity 18, R17 (2006); B. Eckhardt, T. M. Schneider, B. Hof, and J. Westerweel, Annu. Rev. Fluid Mech. 39, 447 (2007).
- Kadanoff (2001) L. P. Kadanoff, Phys. Today 54, 34 (2001).
- Ahlers et al. (2009) G. Ahlers, S. Grossmann, and D. Lohse, Rev. Mod. Phys. 81, in press (2009).
- Monchaux et al. (2007) R. Monchaux et al., Phys. Rev. Lett. 98, 044502 (2007); F. Ravelet et al., Phys. Rev. Lett. 101, 074502 (2008).
- Verzicco and Orlandi (1996) R. Verzicco and P. Orlandi, J. Comput. Phys. 123, 402 (1996); R. Verzicco and R. Camussi, Phys. Fluids 9, 1287 (1997).
- Oresta et al. (2007) P. Oresta, G. Stingano, and R. Verzicco, Eur. J. Mech. 26, 1 (2007).
- Kunnen et al. (2008a) R. P. J. Kunnen, H. J. H. Clercx, B. J. Geurts, L. J. A. van Bokhoven, R. A. D. Akkermans, and R. Verzicco, Phys. Rev. E 77, 016302 (2008a).
- Zhong et al. (2008) J.-Q. Zhong, R. J. A. M. Stevens, H. J. H. Clercx, R. Verzicco, D. Lohse, and G. Ahlers, Phys. Rev. Lett., in press (2009).
- Brown et al. (2005) E. Brown, D. Funfschilling, A. Nikolaenko, and G. Ahlers, Phys. Fluids 17, 075108 (2005).
- Brown and Ahlers (2007) E. Brown and G. Ahlers, Europhys. Lett. 80, 14001 (2007).
- Kunnen et al. (2008b) R. P. J. Kunnen, H. Clercx, and B. Geurts, Europhys. Lett. 84, 24001 (2008b).
- Hart (1995) J. E. Hart, Geophys. Astrophys. Fluid Dyn. 79, 201 (1995); J. E. Hart, Phys. Fluids 12, 131 (2000); J. E. Hart, S. Kittelman, and D. R. Ohlsen, Phys. Fluids 14, 955 (2002).
- Kunnen et al. (2006) R. P. J. Kunnen, H. J. H. Clercx, and B. J. Geurts, Phys. Rev. E 74, 056306 (2006).
- Kunnen (2008) R. Kunnen, Ph.D. thesis, Eindhoven University of Technology, The Netherlands (2008).