A spectacular giant arc in the massive cluster lens MACS J1206.20847111Based on observations collected with the VLT-UT3 Melipal Telescope (ESO)
Abstract
We discuss the X-ray and optical properties of the massive galaxy cluster MACS J1206.20847 (), discovered in the Massive Cluster Survey (MACS). Our Chandra observation of the system yields a total X-ray luminosity of erg s-1 (0.1–2.4 keV) and a global gas temperature of keV, very high values typical of MACS clusters. In both optical and X-ray images MACS J1206.20847 appears close to relaxed in projection, with a pronounced X-ray peak at the location of the brightest cluster galaxy (BCG); we interpret this feature as the remnant of a cold core. A spectacular giant gravitational arc, 15″in length, bright (V) and unusually red (), is seen 20 arcsec west of the BCG; we measure a redshift of for the lensed galaxy. From our Hubble Space Telescope image of the cluster we identify the giant arc and its counter image as a seven-fold imaged system. An excess of X-ray emission in the direction of the arc coincides with a mild galaxy overdensity and could be the remnant of a minor merger with a group of galaxies. We derive estimates of the total cluster mass as well as of the mass of the cluster core using X-ray, dynamical, and gravitational-lensing techniques. For the mass enclosed by the giant arc ( kpc) our strong-lensing analysis based on Hubble Space Telescope imaging yields a very high value of M⊙, inconsistent with the much lower X-ray estimate of M⊙. Similarly, the virial estimate of M⊙ for the total cluster mass, derived from multi-object spectroscopy with CFHT and the VLT of 38 cluster members, is significantly higher than the corresponding X-ray estimate of M⊙. We take the discrepancy between X-ray and other mass estimates to be indicative of pronounced substructure along the line of sight during an ongoing merger event, an interpretation that is supported by the system’s very high velocity dispersion of 1580 km s-1.
keywords:
gravitational lensing — X-rays: galaxies: clusters — galaxies: clusters: general — galaxies: clusters: individual (MACS J1206.208471 Introduction
The concentration of both dark and baryonic matter in the cores of clusters of galaxies has many profound implications for our understanding of cluster growth and cosmology. Firstly, the structure and evolution of the gravitational potential of a cluster of galaxies depends on the nature of dark matter and thus allows direct comparison with predictions from numerical simulations (e.g. Navarro, Frenk & White 1997). Secondly, the surface density of mass integrated through the core of a cluster is often sufficiently high to strongly lens background galaxies into gravitational arcs (Soucail et al. 1987; Mellier et al. 1991; Kneib et al. 1996; Smith et al. 2001). Detailed analysis of the location and shape of such arcs, as well as of lens-generated multiple images, can be used to model the projected mass in the cluster, and in-depth follow-up of the brightest lensed features often yields valuable insights into the properties of distant, faint galaxies (e.g. Kneib et al. 2004; Smail et al. 2007). Thirdly, the high density and temperature of the gas in the core of clusters leads to intense X-ray emission that current instrumentation can detect out to redshifts well above unity. The selection of massive clusters through X-ray emission has proved very successful at providing cosmological constraints (Henry 2000; Borgani et al. 2001; Allen et al. 2003; Pierpaoli et al. 2003; Allen et al. 2008; Mantz et al. 2008) and follow-up observations of X-ray luminous clusters have revealed many spectacular cases of gravitational lensing (Gioia & Luppino 1994; Smith et al. 2001; Dahle et al. 2002; Covone et al. 2006).
In this paper we present a comprehensive multiwavelength study of a complex gravitational arc and its host cluster MACS J1206.20847, an X-ray selected system at intermediate redshift found by the Massive Cluster Survey, MACS (Ebeling, Edge & Henry 2001, 2007). We describe our optical, NIR and X-ray observations in Sections 2 and 3, investigate the properties of the giant arc, the cluster lens, and the brightest cluster galaxy in Section 4 to 7, and derive mass estimates for the cluster core and the entire system in Section 7. We present a discussion of our results as well as conclusions in Section 8.
Throughout we use a CDM cosmology (, ) and adopt 70 km s-1 Mpc-1.
2 Observations
The galaxy cluster MACS J1206.20847 was originally discovered in a short two-minute R-band image taken on June 15, 1999 with the University of Hawaii’s 2.2m telescope (UH2.2m) on Mauna Kea. The observation, performed as part of the MACS project, was triggered by the presence of the X-ray source 1RXS J120613.0084743 in the ROSAT Bright Source Catalogue which had no obvious counterpart in the standard astronomical databases and could also not trivially be identified by inspection of the respective Digitized Sky Survey image.
Following the initial, tentative identification of the RASS X-ray source as a potentially massive galaxy cluster, we conducted a range of follow-up observations to firmly establish the cluster nature of this source and to characterize its physical properties.
2.1 Optical
Spectra of two galaxies in MACS J1206.20847, one of them the BCG, were taken with the Wide-Field Prism Spectrograph on the UH2.2m on July 4, 1999, using a 420 l/mm grism, a Tektronix 20482 CCD yielding 0.355 arcsec/pixel, and a 1.6 arcsec slit. The two redshifts were found to be concordant, establishing an approximate cluster redshift of .
Moderately deep, multi-passband imaging observations (s, dithered by 10 arcsec, in each of the V, R, and I filters) of the cluster were obtained with the UH2.2m on January 29, 2001, using again the Tektronix 20482 CCD which provides a scale of 0.22 arcsec per pixel and a arcminute2 field of view. The seeing was variable throughout the night; we measure seeing values of 0.85, 1.05, 0.90 arcsec in the V, R, and I passbands, respectively, from the final, co-added images.
Spectroscopic observations of presumed cluster galaxies as well as of the giant arc in MACS J1206.20847 were performed with the FORS1 spectrograph in multi-object spectroscopy mode at the UT3 Melipal telescope of the VLT on April 11, 2002. The G300V grism, an order sorting filter (GG375), and a 1 arcsec slit were used, yielding a wavelength coverage from 4000Å to 8600Å at a resolution of . The total exposure time was 38 minutes. A single mask was designed, covering the 7’ field of FORS1 with 19 slitlets of fixed length (22”). Credible redshifts could be measured for 14 objects. During the exposure the seeing was 0.6 arcsec. Spectra of the spectrophotometric standard star EG274 were obtained for calibration.
Additional multi-object spectroscopy of colour-selected galaxies in the field of MACS J1206.20847 was performed on May 8, 2003 using the MOS spectrograph on the Canada-France-Hawaii Telescope (CFHT) on Mauna Kea. We used the B300 grism and the EEV1 CCD, which provides a resolution of 3.3Å/pixel, and observed through a broadband filter (#4611, General Purpose set) to produce truncated spectra, covering about 1800Å centred on 6150Å, such that spectra could be stacked in three tiers along the dispersion direction. This choice of filter and grism ensured that, for all cluster members, redshifts could be obtained from the Ca H+K lines which fall at 5660Å and 5710Å at the approximate cluster redshift of . Weather conditions were poor though, and only 48 of the 67 objects observed (total integration time: one hour) yielded reliable redshifts.
Finally, MACS J1206.20847 was observed on December 6, 2005 with the Advanced Camera for Surveys (ACS) aboard the Hubble Space Telescope as part of program SNAP-10491 (PI Ebeling), for a total of 1200 seconds in the F606W filter, resulting in a high-resolution image of the cluster core, including the giant arc.
2.2 Near-infrared
Near-infrared observations of the core of MACS J1206.20847 were performed in the J and K bands using the United Kingdom Infra-Red telescope (UKIRT) on April, 5 2001 using the UFTI imager during a period of good seeing. The observations consisted of two iterations of a nine-point dither pattern, each of 60 second exposures for a total integration time of 1080 seconds. The seeing measured from these observations was 0.47 and 0.59 arc-seconds in the J and K bands, respectively.
2.3 X-ray
MACS J1206.20847 was observed on December 18, 2002 with the ACIS-I detector aboard the Chandra X-ray Observatory for a nominal duration of 23.5 ks, as part of a Chandra Large Programme awarded to the MACS team. The target was placed about two arcmin off the standard aimpoint to avoid flux being lost in the chip gaps of the ACIS-I detector, while still maintaining good (sub-arcsec) angular resolution across the cluster core. VFAINT mode was used in order to maximize the efficiency of particle event rejection in the post-observation processing.
3 Data reduction
3.1 Optical imaging
Standard data-reduction techniques (bias-subtracting, flat-fielding, image combination and registration) were applied to the V, R and I band data using the relevant iraf packages. The data were photometrically calibrated via the observation of Landolt standard-star fields.
In order to measure aperture magnitudes, seeing-matched frames were produced by applying a Gaussian smoothing to the V, I, J and K images such that the seeing in these frames was degraded to match the 1.1 arc-seconds measured in the R band. Using SExtractor, the seeing-matched (undegraded) images were then used to measure aperture (total) magnitudes.
Photometry of the giant arc was performed by manually defining an aperture mask fitted to the arc profile. The area defined by this aperture was then masked out of the science frame and a background image produced by median smoothing over the absent arc. This background image was subtracted from the science frame and VRIJK photometry obtained by applying the aperture to the resulting sky-subtracted images.
3.2 Optical spectroscopy
For the reduction of our spectroscopic data we applied the same standard techniques as for the imaging data, followed by straightening of the skylines, extraction of spectra, and wavelength calibration using the relevant iraf packages.
Preliminary redshifts were determined via visual inspection, typically from the calcium H and K lines. Final refined redshifts were found with a multi-template cross-correlation method using the iraf task fxcor.
Redshifts with cross-correlation peak heights exceeding 0.70 are typically accurate to 0.0002; for peak heights between 0.5 and 0.7 the error is typically 0.0005. All redshifts were converted to the heliocentric reference frame. Table 2 lists the coordinates of all galaxies observed, as well as the measured redshifts with their uncertainties.
3.3 Near-infrared imaging
The J and K imaging data were reduced using the ORAC-DR data-reduction pipeline and were calibrated through observation of observatory standard stars.
3.4 X-ray
We use Ciao (version 3.3), the standard suite of software tools developed for the analysis of Chandra data at the Chandra Science Center, as well as the most recent calibration information, to reprocess the raw ACIS-I data. Our inspection of the lightcurve of the event count rate in the source-free regions of the ACIS-I detector finds no significant flaring, leading to an effective (dead-time corrected) total exposure time of 23.2 ks.
To investigate potential spatial variations in the cluster gas temperature we define various source and background regions. For each of these regions we generate auxiliary response files (ARF) and response matrix files (RMF) which weigh the position-dependent instrument characteristics by the observed count distribution in the respective area. Following Markevitch & Vikhlinin (2001), only the 0.5–2.0 keV band data are used to create these maps of spatial weights, since the effects of vignetting are small in this energy range. We also apply a correction of a factor of 0.93 to the effective area distribution at energies below 2 keV in all ARFs as suggested by a comparison of calibration results for the front- and back-illuminated ACIS chips (Vikhlinin et al. 2002). Finally, we use the acisabs package to correct all ARFs for the effects of the (time-dependent) buildup of a contaminating deposit on the optical detector window which results in a reduction of the effective area at low energies.
Background regions are defined by copying the respective source regions to the same chip-y location on the other three ACIS-I CCDs. This strategy minimizes the impact of any residual chip-y dependence of the background on the data analysis, an effect that is unavoidable if the background is selected as a source-free region on the same CCD as the cluster.
4 Cluster galaxy distribution
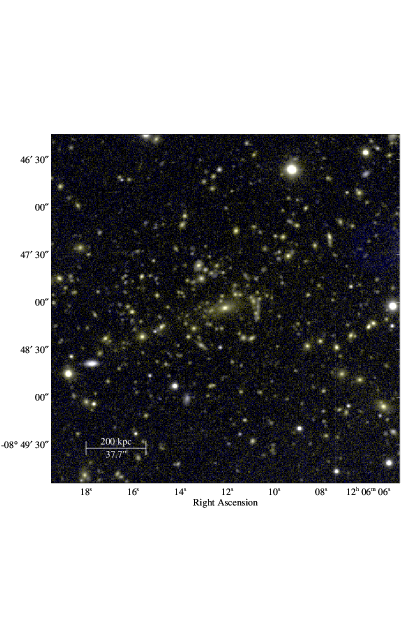
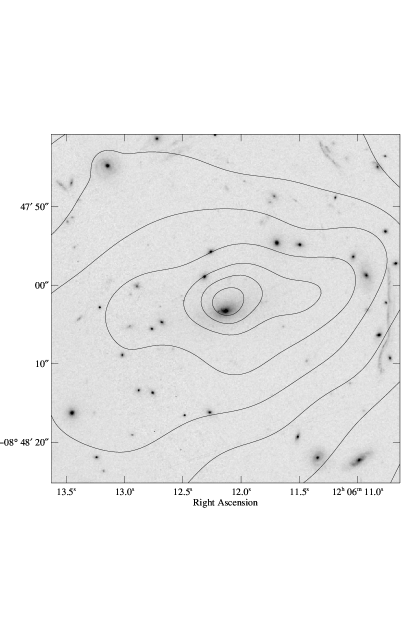
Figure 1 shows a colour image of the cluster generated from the V, R, I images obtained with the UH2.2m. MACS J1206.20847 is found to be an optically very rich system with a single dominant central galaxy and no obvious subclustering in the apparent, projected cluster galaxy distribution. A giant arc is clearly visible about 20 arcsec to the West of the BCG. The astrometric solution used is based on eight stars within the field of view of the V band image that have accurate celestial coordinates in the Hubble Guide Star Catalogue (GSC2).
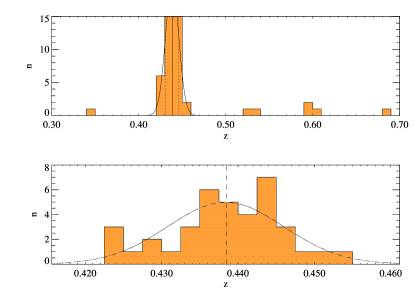
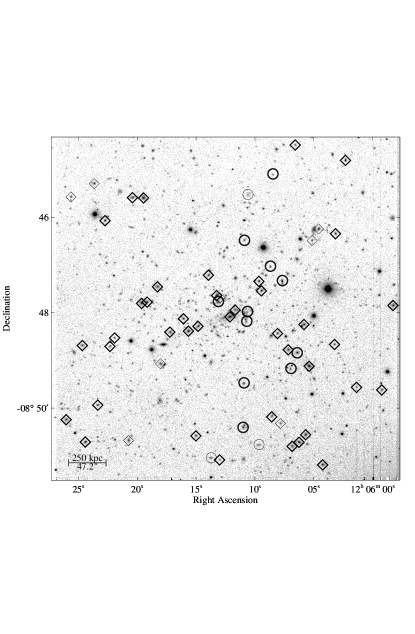
Our spectroscopic observations of 85 galaxies in the field of MACS J1206.20847 (Fig. 2) yield redshifts as listed in Table 2. Two galaxies were observed with both the VLT and CFHT; their spectroscopic redshifts agree within the errors. Using only the most accurate redshifts with correlation peak heights exceeding 0.7, we apply iterative clipping to the redshift histogram to obtain a systemic cluster redshift of and a very high velocity dispersion in the cluster rest frame of km/s based on 38 redshifts. Entirely consistent values of and km/s are found using the ROSTAT statistics package (Beers, Flynn & Gebhardt 1990). The resulting redshift histogram is shown in Fig. 3. Despite the extremely high velocity dispersion of the system we find no obvious signs of substructure along the line of sight; a one-sided Kolmogorov-Smirnov test finds the observed redshift distribution to be only mildly inconsistent with a Gaussian ( significance).
5 Arc properties
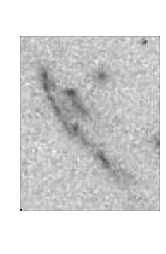
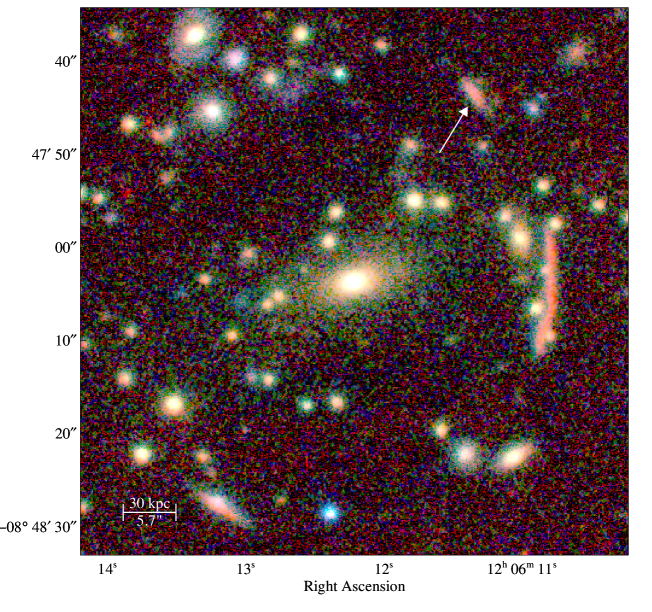
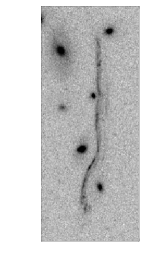
The bright () giant arc is centered at (J2000) = 12h 06m 10.75s, (J2000) = 08∘ 48’ 04.5”, about 20″west of the BCG. Its unusually red colour is apparent in Fig. 4 which shows a composite V, I, K image of the cluster core. Also prominent, and marked by the arrow in Fig. 4, is the counter image, clearly identifiable by its colour, at (J2000) = 12h 06m 11.27s, (J2000) = 08∘ 47’ 43.0”. Enlarged high-resolution views of arc and counter image provided by HST are shown in the margins of Fig. 4. The photometric properties of arc and counter image are summarized in Table 1; note however that at the resolution of our ground-based images both the arc and its counter image is blend of several objects. Figure 5 shows the spectrum of the giant arc in MACS J1206.20847 as observed with FORS1 on the VLT.
| object | I | R | V | J | K | RI | VI | VR | RJ | RK | JK |
|---|---|---|---|---|---|---|---|---|---|---|---|
| giant arc | |||||||||||
| counter image |

At the giant arc in MACS J1206.20847 is among the reddest strongly lensed features currently known. Its colour is comparable to that of the giant arc in Abell 370 (, Aragón-Salamanca & Ellis 1990) and only slightly bluer than the red arc in Abell 2390 (, Smail et al. 1993).
Our multi-band photometry allows the classification of the background galaxy lensed into the giant arc. Standard template spectral energy distributions (SEDs) of five galaxy types were redshifted to match that of the giant arc. The filter response curves of each of the V, R, I, J and K bands were then convolved with these SEDs and normalized to the R band to produce predicted colours for each of the five galaxy types, all relative to the R band. The resulting model mλ–mR colours, as well as the equivalent observed colours of the arc, are shown in Fig. 6. We find the colour distribution of the arc in MACS J1206.20847 to be consistent with the background galaxy being a normal spiral of class Sbc.

6 Intra-cluster gas properties
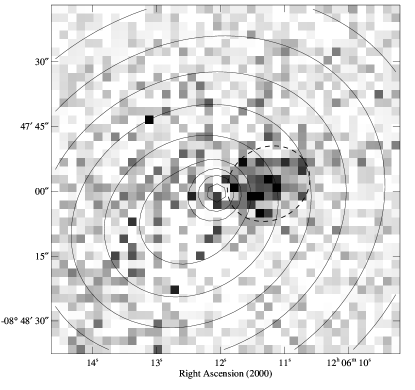
Figure 7 shows contours of the adaptively smoothed X-ray emission from MACS J1206.20847, as observed with Chandra/ACIS-I in the 0.5–7 keV band, overlaid on the UH2.2m R-band image222 For this overlay, as well as for any other comparisons of the spatial appearance of the cluster in the X-ray and optical wavebands, we have used three X-ray point sources with obvious optical counterparts to slightly adjust the astrometric solution of the X-ray image, namely by 0.03 seconds in right ascension and 0.4 arcseconds in declination. We estimate the resulting, relative astrometry between the optical and X-ray images to be accurate to better than 0.2 arcseconds..
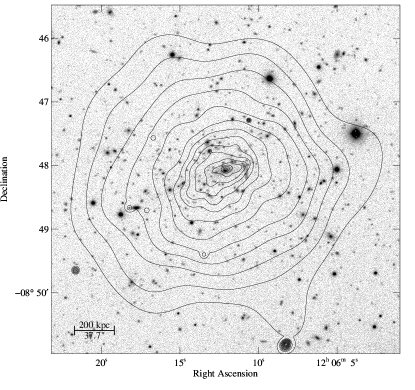
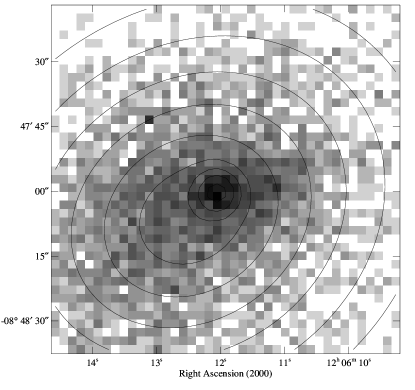
At large distances from the center, the system’s X-ray appearance is close to spherical in projection. The central region at kpc, however, shows a pronounced ellipticity as well as non-concentric X-ray flux contours in the cluster core. The observed elongation, as well as the displacement of the innermost contours toward the very compact X-ray core, are both in the direction of a group of galaxies in the vicinity of the giant arc.
6.1 Spatial analysis
Using Sherpa, the fitting package provided with Ciao, we fit the observed X-ray surface brightness distribution within 2.5 arcmin of the cluster core with a two-dimensional spatial model, consisting of an elliptical model
(where is the variable radius of an ellipse with ellipticity and orientation angle ), an additional circular Gaussian component to account for the compact core, and a constant background.
Point sources with detection significances exceeding 99% (as measured with the celldetect algorithm) have been excised from the image, and a spectrally weighted exposure map is used as a two-dimensional response function in the fit. We use a composite exposure map to account for the differences between photons of cosmic origin and high-energy particles, the latter being subject neither to off-axis vignetting nor to variable detection rates due to spatial or temporal variations in the CCD quantum efficiency (QE). At energies between 0.5 and 2 keV particles account for roughly 2/3 of the observed background; at higher energies this fraction rises to over 90 per cent. Since, overall, more than 80% of the background events registered in the 0.5–2 keV band used here are caused by particles we ignore the sky contribution altogether and compute a background exposure map which incorporates the effects of bad pixels and dithering but not those of a variable CCD QE and vignetting. A second exposure map is computed using weights based on the spectrum of the target of our observations. The spectral weights for this ‘cluster-weighted’ exposure map are created assuming a plasma model with keV, a metal abundance of 0.3 solar, and the Galactic value of cm-2 for the equivalent Hydrogen column density value in the direction of the cluster, consistent with the results of our spectral fits to the global cluster X-ray spectrum (see below). The resulting exposure map shows significant vignetting of more than 20% across the ACIS-I field of view. The final exposure map used in the following is then the weighted average of the background and cluster exposure maps, with the weights being given by the fraction of counts from the cluster and the background, and with the peak value set to that of the cluster-weighted map.
Since the image used in the fit is relative coarsely binned ( arcsec2) and no small-scale spatial components are included in the model, we do not convolve the model with the telescope point-spread function (PSF). All parameters of the two-dimensional spatial model are fit. Because of the low number of counts (zero or one) in the large majority of image pixels, we use the C statistic (Cash 1979) during the optimization process.
Our spatial fit yields best-fit values for the parameters of the model of arcsec (corresponding to ( kpc) for the core radius, for the slope parameter, for the ellipticity, and degrees (counted North through West). Our two-dimensional spatial fit also finds coordinates of (J2000) = 12h 06m 12.10s, (J2000) = 08∘ 48’ 01.7” for the centroid of the compact cluster core, offset by arcsec from the position (J2000) = 12h 06m 12.50s, (J2000) = 08∘ 48’ 07.1” which marks the center of the elliptical component that describes the shape of the X-ray emission on larger scales.
Figure 8 shows the contours of the best-fitting model overlaid both on the observed exposure-corrected X-ray image and on the residuals remaining when the model is subtracted from the data. The residual image shows a clear excess of emission, corresponding to about 300 photons, to the West of the cluster core. Note that the best-fit model parameters quoted above were obtained with the excess region excluded from the fit.
Since the two-dimensional fitting procedure allows no immediate assessment of the goodness of fit other than via visual inspection of the residuals (Fig. 8), we also fit a one-dimensional, spherical model to the radial X-ray surface brightness profile. In this fit we adopt the center of the elliptical model component as the overall center of the X-ray emission, and exclude a 60-degree-wide azimuthal section around the compact core and the excess emission to the West-North-West. Again we account for variations in the exposure time across the source and background regions. Since all annuli contain at least 50 photons we are now justified in using statistics in the fit.

The resulting one-dimensional radial profile as well as the best-fitting model are shown in Figure 9. When fitting out to a radius of about 150 arcsec (850 kpc), where the observed surface brightness profile begins to drop below twice the background level, we find the model to provide an unacceptable fit to the data at a reduced value of 1.9 (48 data points, 45 degrees of freedom (d.o.f.). However, essentially the same model fits the data very well (=1.1 for 19 d.o.f.) within a radius of 66 arcsec (375 kpc). At larger radii the observed slope varies such that the best-fitting model first systematically underpredicts, then systematically exceeds the observed values. The best-fit values of ct arcsec2, arcsec (corresponding to () kpc), and , all of which are consistent with the results from our two-dimensional fit, thus allow a credible parametrization of the observed emission out to about 375 kpc, provided the compact core and the excess emission region to the West are excluded. At larger radii, the X-ray morphology of MACS J1206.20847 is again too complex to be described by a simple model.
Although the one-dimensional model is too simplistic to adapt to the spatial variations in the X-ray emission near the cluster core or at very large radii, it provides an adequate global description of the cluster. Extrapolating the model to (see Section 8.2) yields values of erg s-1 cm-2 and erg s-1 for the total X-ray flux and X-ray luminosity of MACS J1206.2–0847, respectively (0.1–2.4 keV). The quoted errors do, however, not account for any systematic errors which are bound to be present in view of the fact that X-ray emission is detected only out to about 1 Mpc from the cluster center and that, at larger radii, the model tends to overpredict the observed X-ray surface brightness (see Fig. 9). A more robust measurement can be obtained within (1.04 Mpc) and yields lower limits to the total X-ray flux and luminosity of erg s-1 cm-2 and erg s-1.
6.2 Spectral analysis
We measure a global temperature for the intra-cluster medium (ICM) in MACS J1206.20847 by extracting the X-ray spectrum from kpc to Mpc (r1000) and using Sherpa to fit a MEKAL plasma model (Mewe et al. 1985) with the absorption term frozen at the Galactic value. We find keV, a high value even for extremely X-ray luminous clusters (Chen et al. 2007). Although the relatively high reduced- value of this spectral fit of 1.4 is statistically acceptable, it could be indicative of systematic effects such as spatial temperature variations or the presence of multiphase gas. We find only mild evidence of the former when fitting absorbed plasma models to the X-ray spectra extracted from five concentric annuli. As shown in Fig. 10, the ICM temperature is consistently high ( keV), with the exception of the core region where, at kpc, a significant drop to about 9 keV (still a very high value) is observed. The lower gas temperature measured around the cluster core could be caused by the presence of a minor cool core, in agreement with the results of our X-ray imaging analysis.

7 Properties of the central galaxy
The spectrum of the central cluster galaxy taken at CFHT (Fig. 11, see also Section 2.1) covers only a small wavelength range mostly redward of the 4000Å break. While the wavelength coverage is thus insufficient to check for the presence of H and OIII in emission, we do detect faint OII emission ( Å), albeit at a much lower level than typically observed in the central cluster galaxies of large cool-core clusters (e.g., Allen et al. 1992, Crawford et al. 1995).

Bright NVSS (162 mJy at 1.4 GHz) and Molonglo (900 mJy at 365 MHz) radio sources are coincident with the central galaxy. The radio source exhibits a relatively steep spectrum () and is similar to the one found in MACSJ1621.3+3810 (Edge et al. 2003) but an order of magnitude more powerful (6 W Hz-1 at 1.4 GHz). The radio source is also detected at 74 MHz in the VLA Low-frequency Sky Survey (VLSS) with a measured flux of Jy that is in excellent agreement with the power-law prediction from the detections at 365 MHz and 1.4 GHz.
Although no clear signs of cavities are detected in the cluster core, we can, from our Chandra data alone, not conclusively assess the degree of interaction between the BCG and the surrounding intra-cluster medium. High-resolution radio data would be required to map the radio morphology of the BCG. We do observe though a slight, but significant displacement of arcsec – kpc at the cluster redshift – between the position of the central cluster galaxy ( (J2000) = 12h 06m 12.14s, (J2000) = 08∘ 48’ 03.3”) and the X-ray centroid of the compact cluster core (Fig. 12). Having carefully aligned the optical and X-ray images (see footnote in Section 6) we estimate that at most 10% of this offset can reasonably be attributed to residual astrometric uncertainties; the majority of the misaligned is thus real. Similar offsets ( 10 kpc) have been noted in previous Chandra studies of galaxy clusters (Arabadjis, Bautz & Garmire 2002) and may also have contributed to minor optical/X-ray misalignments in the cores of cooling clusters observed with ROSAT (Peres et al. 1998).
In addition, the velocity offset of 550 km s-1 between the central galaxy and the cluster mean velocity is comparable to the largest peculiar velocities observed in local clusters (Zabludoff et al. 1990; Hill & Oegerle 1993; Oegerle & Hill 2001), although we note that the non-Gaussian velocity distribution in this cluster (Fig. 3) complicates the measurement of an accurate systemic velocity.
Spatial and velocity offsets between central galaxy and X-ray peak are not expected in the simplest cool-core scenario, although it is worth noting that an offset of the same size as observed by us here (10 kpc) has been seen in the best-studied cool-core cluster, Perseus (Böhringer et al. 1993), and there has been a widespread realization that the physics of cool cluster cores are more complex and the role of AGN feedback more important than previously thought (Peterson et al. 2001; Soker et al. 2002; Edge 2001; Mittal et al. 2008). We conclude that MACSJ1206.20847 is likely to contain a moderate cool core, as well as an extremely luminous radio galaxy (one of the most powerful ones known in cluster cores at ), with the observed disturbances being likely due to a recent or still ongoing cluster merger.
8 Mass measurements
8.1 Virial mass
Using the measured redshifts of cluster members and their spatial distribution as projected on the sky, we determined the virial cluster mass based on the method of Limber & Mathews (1960) in which the mass is calculated as
| (1) |
Here is the one-dimensional (radial) velocity dispersion and is the projected mean harmonic point-wise separation (projected virial radius). is defined by
| (2) |
where N is the number of galaxies, is the projected separation of galaxies and , and the sum is over all pairs. Being a pairwise estimator this quantity is sensitive to close pairs and quite noisy (Bahcall & Tremaine 1981). It also systematically underestimates the radius for a rectangular aperture typical of cluster redshift surveys (Carlberg et al. 1996). Carlberg et al. therefore introduce a new radius estimator, the ringwise projected harmonic mean radius , given by
| (3) | |||||
Here and are the projected distances from the cluster center to galaxies and respectively, , and is the complete elliptic integral of the first kind in Legendre’s notation. This estimator requires an explicit choice of cluster center and assumes the cluster is spherically symmetric with respect to this center. It treats one of the particles in the pairwise potential as having its mass distributed in a ring around the cluster center. is less sensitive to close pairs, less noisy, and tolerates non-circular apertures better than . If the cluster is significantly flattened or subclustered, however, will systematically overestimate the true projected virial radius.
We calculate both radius estimators in our mass determinations to investigate the resulting systematic uncertainty in the virial mass. For our sample the virial radius and mass derived using are 7% larger than those based on . We choose to use as the more robust estimator in our analysis and define the three-dimensional (deprojected) virial radius as
| (4) |
Our determination of the virial radius estimators and was made using all 62 galaxies with redshifts within of the cluster mean (see Section 4). The resulting projected virial radius is Mpc ( Mpc) with a virial mass of M⊙ and a three-dimensional virial radius of Mpc.
8.2 X-ray mass
To estimate the total gravitational mass of the cluster from its X-ray emission, we need to assume that the cluster is in hydrostatic equilibrium. In addition, we need a description of the density as well as the temperature of the intracluster gas, often assumed to be isothermal. For a cluster with a core region as disturbed as the one of MACSJ1206.20847 such simplifying assumptions are unlikely to be justified; however, an isothermal model should provide an adequate description of the cluster outskirts and allow us to obtain a crude mass estimate.
From the X-ray temperature (see Section 6.2) we estimate the virial radius using the formula of Arnaud et al. (2002),
with
Here (Evrard et al. 1996) is the normalization of the virial relation, i.e., . Then, the total mass of the cluster within a radius can be computed with the help of the -model profile discussed in Section 6.1:
| (5) |
(Evrard et al. 1996). Using the above equations we find Mpc as an approximate value for the virial radius. The X-ray estimates for the total mass within and the mass within the core region (defined as the sphere interior to the giant arc, i.e. kpc) are then M☉ and M☉, respectively.
8.3 Lensing mass
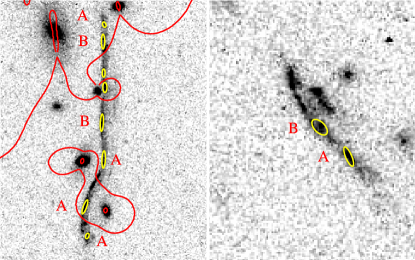
Using the high-resolution HST images, we have identified within the giant arc two features A & B that are replicated six times. The same two features are also identified in the southern part of the counter image as shown in Figure 14. The northern part of the counter image is most likely not multiply imaged. Altogether, the giant arc and its counter image represent a seven-image multiple system which we use to constrain a strong-lensing model of the cluster mass distribution.
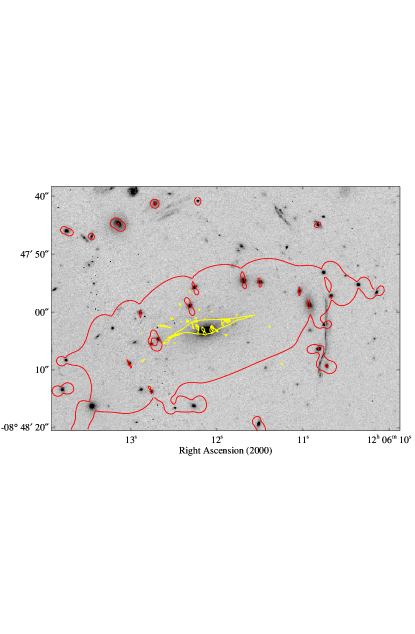
To model the cluster core we used Lenstool333publicly available at http://www.oamp.fr/cosmology/lenstool (Kneib et al. 1996; Jullo et al. 2007) which now uses a Bayesian MCMC sampler to optimize the cluster mass model and generate robust lens results. We have followed the procedure of Limousin et al. (2007) to model the mass distribution using one cluster-scale dark-matter halo described by a truncated PIEMD (Pseudo Isothermal Elliptical Mass Distribution), as well as an additional 84 truncated galaxy-scale PIEMD potentials to describe the dark-matter halos associated with the brightest cluster member galaxies selected from the cluster V–K red sequence. Furthermore, to minimize the number of free parameters, we assumed that the mass of galaxy-size halos scales with the K-band luminosity of the associated galaxy (Natarajan & Kneib 1997). The obtained critical curves shown in figure 13 display a winding shape in between the galaxies (see close-up in Fig. 14), which explains the extreme elongation of the giant arc.
Using the most probably strong-lensing mass model, we estimate the mass enclosed by the giant arc. We find and a mass-to-light ratio interior to the giant arc of .
These numbers are very robust and depend little on the mass profile assumed for the dark-matter distribution of the cluster. Caution is advised though when extrapolating to larger radius, as the slope of the cluster mass profile is not well constrained by only one (multiple) arc. Deeper, high-resolution imaging (with, e.g., ACS or WFC3), however, would likely detect a large number of multiple images as was the case for Abell 1703 (Limousin et al. 2008), allowing us to accurately measure the slope of the cluster dark-matter profile. Note that the current best estimate of the Einstein radius at is nearly 45″, making this cluster a superb cosmological telescope to probe the first galaxies in the Universe.
The total magnification of the system (both the giant arc and the part of the counter image that is multiply imaged) is about 8010, one of the largest amplification factors known for a giant arc. A detailed model of the arc surface brightness is beyond the scope of this study but will be presented in a future paper (Clement et al., in preparation).
9 Summary and Conclusions
We present a comprehensive multi-wavelength analysis of the properties of the massive galaxy cluster MACS J1206.2–0847. At a redshift of , the system acts as a gravitational lens for a background galaxy at , resulting in spectacular gravitational arc of high surface brightness, 15″in length, a total magnitude of V=21.0, and of unusual, very red colour of . Our X-ray analysis based on Chandra data yields global X-ray properties ( erg s-1, 0.1–2.4 keV, and keV) that make this cluster one of the most extreme systems known at any redshift.
Belying its relaxed appearance at optical wavelengths, MACS J1206.2–0847 exhibits many signs of ongoing merger activity along the line of sight when looked at more closely, including a disturbed X-ray morphology in the cluster core, a small but significant offset of the peak of the X-ray emission from the brightest cluster galaxy, and a very high velocity dispersion of 1580 km s-1. The strongest indication of recent or ongoing cluster growth, however, is obtained from a comparison of X-ray, virial, and lensing mass estimates for this system. A high-resolution image of the giant arc and its counter image obtained with HST allows us to create a lens model that places tight constraints on the mass distribution interior to the arc. The strong-lensing value of the mass of the cluster core of thus obtained is higher by about a factor of two than the X-ray estimate of M⊙. A similar discrepancy is found between the X-ray estimate of the total mass within and the virial mass estimate derived from radial-velocity measurements for 38 cluster galaxies.
Comparable discrepancies between X-ray and lensing mass estimates, in particular for cluster cores, have been reported before for other systems, the perhaps most famous example being A1689 (e.g., Miralda-Escudé & Babul 1995; Xue & Wu 2002; Limousin et al. 2007). In all cases, including the one presented here, the mass derived using gravitational-lensing features is two to three times higher than the one obtained by an X-ray analysis assuming hydrostatic equilibrium. In agreement with simulations (Bartelmann & Steinmetz 1996), detailed observational studies of such discrepancies for individual clusters find deviations from hydrostatic equilibrium and the presence of substructure along the line of sight to be responsible, tell-tale signs being offsets between the X-ray peak and the location of the BCG as well as extreme elongations and structure in radial-velocity space (Allen 1998, Machacek et al. 2001). We conclude that MACS J1206.2–0847 is a merging cluster with a merger axis that is close to aligned with our line of sight. A modest cool core has either survived the merger or is in the process of formation.
The discovery of a giant arc in this MACS cluster underlines yet again the efficiency of X-ray luminous clusters as gravitational lenses. Much deeper, high-resolution images of systems like MACS J1206.2–0847 will, owing to the large number of multiple images detected, allow a detailed mapping of the mass distribution in the cluster core, and, through the power of gravitational magnification, provide an ultra-deep look at the very distant Universe.
Acknowledgments
We thank Alexey Vikhlinin for very helpful advice and suggestions concerning systematic effects in the Chandra data analysis. HE gratefully acknowledges financial support from grants NAG 5-8253 and GO2-3168X. ACE thanks the Royal Society for generous support during the gestation phase of this paper. JPK acknowledges support from the Centre National de la Recherche Scientifique (CNRS), and the ANR grant 06-BLAN-0067. EJ acknowledges support from an ESO-studentship and from CNRS.
References
- [1] Allen S.W., 1998, MNRAS, 296, 392
- [2] Allen S.W. et al. 1992, MNRAS, 259, 67
- [3] Allen S.W., Schmidt R.W., Fabian A.C., Ebeling H. 2003, MNRAS, 342, 287
- [4] Arabadjis J.S., Bautz M.W., Garmire G.P. 2002, ApJ, 572, 66
- [5] Aragón-Salamanca A. & Ellis R.S. 1990, in Mellier Y., Soucail G., Fort B., ed, Gravitational Lensing. Springer Verlag, p. 288
- [6] Arnaud M., Aghnaim N., & Neumann D. 2002, A&A, 389, 1
- [7] Bahcall J. & Tremaine S.D. 1981, ApJ, 447, L81
- [8] Bartelmann M. & Steinmetz M. 1996, MNRAS, 283, 431
- [9] Beers T.C., Flynn K., Gebhardt K. 1990, AJ, 100, 32
- [10] Böhringer H., Voges W, Fabian A.C., Edge A.C., Neumann D.M. 1993, MNRAS, 264, L25
- [11] Borgani S. et al. 2001, ApJ, 561, 13
- [12] Cavaliere A. & Fusco-Femiano R. 1976, A&A, 49, 137
- [13] Chen Y., Reiprich T.H., Böhringer H., Ikebe Y., Zhang Y.-Y., 2007, A&A 466, 805
- [14] Carlberg R.G., Yee H.K.C., Ellingson E., Abraham R., Gravel P., Morris S. & Pritchet C.J. 1996, ApJ, 462, 32
- [15] Cash W. 1979, ApJ, 228, 939
- [16] Covone G., Kneib J.-P., Soucail G., Richard J., Jullo E., Ebeling H. 2006, A&A, 456, 409
- [17] Crawford C.S., Edge A.C., Fabian A.C., Allen S.W., Böhringer H., Ebeling H., McMahon R.G., Voges W. 1995, MNRAS, 274, 75
- [18] Dahle H., Kaiser N., Irgens R.J., Lilje P.B., Ridgway S.E. 2002, ApJS, 139, 313
- [19] Ebeling H., Edge A.C., Henry J.P. 2001, ApJ, 553, 668
- [20] Ebeling H., White D.A., Rangarajan F.V.N. 2006, MNRAS, 368, 65
- [21] Ebeling H., Barrett E., Donovan D., Ma C.-J., Edge A.C., van Speybroeck, L. 2007 ApJ, 661, L33
- [22] Edge A.C. 2001, MNRAS, 328, 762
- [23] Edge A.C., Ebeling H., Bremer M., Röttgering H., van Haarlem M., Rengelink R., Courtney N. 2003, MNRAS, 339, 913
- [24] Evrard A.E., Metzler C.A., & Navarro J.F. 1996, ApJ, 469, 494
- [25] Gioia I.M., Luppino G. 1994, ApJS, 94, 583
- [26] Henry J.P. 2000, ApJ, 534, 565
- [27] Hill J.M. & Oegerle W.R. 1993, AJ, 106, 831
- [28] Jullo E., Kneib J.-P., Limousin M., Elíasdóttir Á., Marshall P.J., Verdugo T. 2007, NJPh, 9, 447
- [29] Kneib J.-P., Ellis R.S., Smail I., Couch W.J., Sharples R.M. 1996, ApJ, 471, 643
- [30] Kneib J.-P., Ellis R.S., Santos M.R., Richard J. 2004, ApJ, 607, 697
- [31] Limber D.N. & Mathews W.G. 1960, ApJ, 132, 286
- [32] Limousin M., Kneib J.-P., Bardeau S., Natarajan P., Czoske O., Smail I., Ebeling H., Smith G.P. 2007, A&A, 461, 881
- [33] Machacek M., Bautz M.W., Canizares C., Garmire G.P. 2002, ApJ, 567, 188
- [34] Markevitch M. & Vikhlinin A. 2001, ApJ, 563, 95
- [35] Mellier Y., Fort B., Soucail G., Mathez G., Cailloux, M. 1991, ApJ, 380, 334
- [36] Mewe R., Gronenschild E.H.B.M., & van den Oord G.H.J. 1985, A&AS, 62, 197
- [37] Mittal R. Hudson D.S., Reiprich T.H., Clarke T. 2008, A&A, submitted, arXiv:0810.0797
- [38] Miralda-Escudé J. & Babul A. 1995, ApJ, 449, 18
- [39] Natarajan P. & Kneib J.-P. 1997, MNRAS, 287, 833
- [40] Navarro J.F., Frenk C.S., White S.D.M 1997, ApJ, 490, 493
- [41] Oegerle W.R. & Hill J.M. 2001, AJ, 122, 2858
- [42] Peterson J.R. et al. 2001, A&A, 365, 104L
- [43] Pierpaoli E., Borgani S., Scott D., White M. 2003, MNRAS, 342, 163
- [44] Peres C.B., Fabian A.C., Edge A.C., Allen S.W., Johnstone R.M., White D.A. 1998, MNRAS, 298, 416
- [45] Sand D.J., Treu T., Smith G.P., Ellis R.S. 2003, ApJ, submitted
- [46] Smail I., Ellis R.S., Aragón-Salamanca A., Soucail G., Mellier Y., Giraud E. 1993, MNRAS, 263, 628
- [47] Smith G.P., Kneib J.-P., Ebeling H., Czoske O., Smail I. 2003, ApJ, 552, 493
- [48] Smith G.P., Smail I., Kneib J.-P., Davis, C.J., Takamiya, M. Ebeling H., Czoske O. 2002, MNRAS, 333, L13
- [49] Soker N., Blanton E.L., Sarazin C.L. 2002, ApJ, 573, 533
- [50] Soucail G., Mellier Y., Fort B., Mathez G., Hammer F. 1987, A&A, 184, L7
- [51] Vikhlinin A., van Speybroeck L., Markevitch M., Forman W.R., Grego L. 2002, ApJ, 578, L107
- [52] Xue S.-J. & Wu X.-P. 2002, ApJ, 576 152
- [53] Zabludoff A.I., Huchra J.P., Geller M.J. 1990, ApJS, 74, 1
| R.A. (J2000) | Dec (J2000) | Peak Height | Telescope | ||
|---|---|---|---|---|---|
| 12 05 58.37 | 08 47 48.5 | 0.88 | 0.44255 | 0.00003 | CFHT |
| 12 05 59.28 | 08 49 34.8 | 0.47 | 0.44921 | 0.00024 | CFHT |
| 12 06 01.42 | 08 49 31.7 | 0.46 | 0.44378 | 0.00031 | CFHT |
| 12 06 02.48 | 08 44 46.4 | 0.76 | 0.44669 | 0.00013 | CFHT |
| 12 06 03.29 | 08 46 18.7 | 0.58 | 0.44081 | 0.00144 | CFHT |
| 12 06 03.31 | 08 48 38.0 | 0.92 | 0.43766 | 0.00005 | CFHT |
| 12 06 04.25 | 08 51 09.4 | 0.49 | 0.42341 | 0.00108 | CFHT |
| 12 06 04.72 | 08 46 12.8 | 0.79 | 0.34227 | 0.00012 | CFHT |
| 12 06 05.27 | 08 46 27.5 | 0.83 | 0.52920 | 0.00005 | CFHT |
| 12 06 05.45 | 08 49 05.5 | 0.72 | 0.43627 | 0.00006 | CFHT |
| 12 06 05.71 | 08 50 31.7 | 0.81 | 0.43547 | 0.00005 | CFHT |
| 12 06 05.91 | 08 48 13.1 | 0.88 | 0.43505 | 0.00009 | CFHT |
| 12 06 06.27 | 08 50 41.2 | 0.79 | 0.43616 | 0.00010 | CFHT |
| 12 06 06.47 | 08 48 48.7 | 0.88 | 0.44432 | 0.00006 | VLT |
| 12 06 06.75 | 08 44 27.5 | 0.79 | 0.43563 | 0.00009 | CFHT |
| 12 06 06.85 | 08 50 46.4 | 0.81 | 0.42495 | 0.00004 | CFHT |
| 12 06 06.99 | 08 49 08.4 | 0.88 | 0.43461 | 0.00003 | VLT |
| 12 06 07.23 | 08 48 45.1 | 0.77 | 0.45409 | 0.00006 | CFHT |
| 12 06 07.76 | 08 47 18.0 | 0.95 | 0.43245 | 0.00003 | VLT |
| 12 06 07.85 | 08 50 17.7 | 0.82 | 0.59625 | 0.00006 | CFHT |
| 12 06 08.15 | 08 48 24.6 | 0.79 | 0.43371 | 0.00007 | CFHT |
| 12 06 08.60 | 08 50 09.5 | 0.64 | 0.44649 | 0.00012 | CFHT |
| 12 06 08.62 | 08 45 04.0 | 0.71 | 0.44152 | 0.00010 | VLT |
| 12 06 08.78 | 08 47 00.0 | 0.90 | 0.44008 | 0.00002 | VLT |
| 12 06 09.54 | 08 47 31.1 | 0.88 | 0.45178 | 0.00005 | CFHT |
| 12 06 09.66 | 08 50 44.4 | 0.34 | 0.36688 | 0.00021 | VLT |
| 12 06 09.76 | 08 47 19.2 | 0.53 | 0.43981 | 0.00009 | CFHT |
| 12 06 10.71 | 08 47 57.2 | 0.89 | 0.44486 | 0.00004 | VLT |
| 12 06 10.73 | 08 45 30.0 | 0.79 | 0.68794 | 0.00005 | VLT |
| 12 06 10.76 | 08 48 09.4 | 0.75 | 0.44460 | 0.00008 | VLT |
| 12 06 10.96 | 08 49 26.9 | 0.82 | 0.43782 | 0.00007 | VLT |
| 12 06 11.00 | 08 46 27.7 | 0.84 | 0.43840 | 0.00004 | VLT |
| 12 06 11.02 | 08 50 22.9 | 0.96 | 0.42781 | 0.00003 | VLT |
| 12 06 11.76 | 08 47 55.5 | 0.71 | 0.42274 | 0.00012 | CFHT |
| 12 06 12.20 | 08 48 04.1 | 0.71 | 0.44132 | 0.00006 | CFHT |
| 12 06 13.00 | 08 51 04.0 | 0.55 | 0.43312 | 0.00024 | CFHT |
| 12 06 13.04 | 08 47 40.1 | 0.54 | 0.53602 | 0.00017 | CFHT |
| 12 06 13.18 | 08 47 44.8 | 0.78 | 0.42373 | 0.00006 | VLT |
| 12 06 13.34 | 08 47 37.4 | 0.70 | 0.42762 | 0.00012 | CFHT |
| 12 06 13.71 | 08 51 01.3 | 0.38 | 0.35605 | 0.00021 | VLT |
| 12 06 14.04 | 08 47 11.8 | 0.52 | 0.43725 | 0.00010 | CFHT |
| 12 06 14.90 | 08 48 16.3 | 0.70 | 0.42653 | 0.00009 | CFHT |
| 12 06 15.02 | 08 50 34.0 | 0.85 | 0.43421 | 0.00007 | CFHT |
| 12 06 15.71 | 08 48 22.4 | 0.61 | 0.44184 | 0.00013 | CFHT |
| 12 06 16.14 | 08 48 06.9 | 0.85 | 0.44138 | 0.00004 | CFHT |
| 12 06 17.28 | 08 48 23.7 | 0.93 | 0.44498 | 0.00006 | CFHT |
| 12 06 18.06 | 08 49 03.6 | 0.62 | 0.53216 | 0.00011 | CFHT |
| 12 06 18.36 | 08 47 26.8 | 0.37 | 0.44816 | 0.00084 | CFHT |
| 12 06 19.23 | 08 47 46.2 | 0.86 | 0.43826 | 0.00005 | CFHT |
| 12 06 19.59 | 08 45 35.2 | 0.92 | 0.44702 | 0.00006 | CFHT |
| 12 06 19.70 | 08 47 47.9 | 0.86 | 0.44760 | 0.00003 | CFHT |
| 12 06 20.53 | 08 45 34.9 | 0.34 | 0.43464 | 0.00077 | CFHT |
| 12 06 20.73 | 08 50 40.4 | 0.84 | 0.53072 | 0.00005 | CFHT |
| 12 06 21.97 | 08 48 31.5 | 0.43 | 0.43494 | 0.00017 | CFHT |
| 12 06 22.36 | 08 48 42.2 | 0.77 | 0.44310 | 0.00018 | CFHT |
| 12 06 22.84 | 08 46 04.1 | 0.81 | 0.43793 | 0.00013 | CFHT |
| 12 06 23.36 | 08 49 56.1 | 0.64 | 0.43830 | 0.00008 | CFHT |
| 12 06 23.78 | 08 45 17.6 | 0.77 | 0.59400 | 0.00007 | CFHT |
| 12 06 24.40 | 08 50 42.6 | 0.82 | 0.44680 | 0.00011 | CFHT |
| 12 06 24.70 | 08 48 41.3 | 0.80 | 0.43520 | 0.00019 | CFHT |
| 12 06 25.74 | 08 45 34.5 | 0.73 | 0.60783 | 0.00018 | CFHT |
| 12 06 26.04 | 08 50 14.7 | 0.83 | 0.44389 | 0.00002 | CFHT |