What can we learn about Quasars from measurements in Galactic Black Hole Binaries?
Abstract
We draw a comparison between AGN and Galactic black hole binaries using a uniform description of spectral energy distribution of these two classes of X-ray sources. We parametrize spectra of GBHs with an parameter which we define as a slope of a nominal power law function between 3 and 20 keV. We show that this parameter can be treated as an equivalent of the X-ray loudness, , used to describe AGN spectra. We do not find linear correlation between the and disc flux (similar to that between and optical/UV luminosity found in AGN). Instead, we show that follows a well defined pattern during a GBH outburst. We find that tend to cluster around 1, 1.5 and 2, which correspond to a hard, very high/intermediate and soft spectral state, respectively. We conclude that majority of the observed Type 1 radio quiet AGN are in the spectral state corresponding to the very high/intermediate state of GBHs. The same conclusion is valid for radio loud AGN. We also study variations of the spectral slopes ( and the X-ray photon index, ) as a function of disc and Comptonization fluxes. We discuss these dependencies in the context of correlations of and with the optical/UV and X-ray 2 keV fluxes considered for AGN and quasars.
keywords:
X-rays:galaxies – X-ray:binaries – galaxies:active – quasars:general – accretion, accretion discs1 Introduction
Accretion powers active galactic nuclei (AGN), including quasars, and drives X-ray activity of Galactic black hole binaries (GBHs). While GBHs harbour a few solar mass black hole, a super-massive black hole ( M⊙) is needed to power quasars. Spectral energy distribution (SED) of AGN in optical to X-ray band has two main components. A multi-colour disc blackbody is believed to originate in the optically thick matter creating an accretion disc around the black hole [e.g. Mitsuda et al., 1984], and hard X-ray power-law like radiation is thought to come from an optically thin hot electron plasma, so-called ’corona’. The location and origins of the ’corona’ is not clear. A number of theoretical models were invoked to explain this hard X-ray radiation including inverse Compton process in a ’corona’ above the disc [e.g. Coppi, 1999] or jet-related synchrotron radiation [e.g. Markoff, Nowak & Wilms, 2005]. There is an ongoing debate as to which model describes the hard X-rays better [e.g. Zdziarski et al., 2004, Markoff, Nowak & Wilms, 2005].
Characteristic disc temperature scales with mass as for a given fraction of Eddington luminosity, so the disc is hotter in GBHs and emits in soft X-ray band instead of optical/UV band. Hence, all levels of GBHs activity can be studied in the X-ray band. Rossi X-ray Timing Explorer (RXTE) monitoring campaigns provided with excellent X-ray data from GBHs. High Energy X-ray Timing Experiment (HEXTE) on board RXTE can observe bright sources up to 200 keV. BeppoSAX, INTEGRAL and Suzaku provide with excellent broad-band spectral coverage. In contrast to these data, distant quasars have fluxes too low to be detected by RXTE. Their accretion disc radiation is shifted into the optical/UV band and needs to be observed with optical and UV instruments. In X-rays, the most recent Chandra and XMM-Newton observatories provide X-ray continua with excellent resolution, but only in a limited 0.3–8 keV band (1.5–40 keV in the rest frame of a = 4 quasar).
The broad-band optical/UV/X-ray spectra of local AGN and high- quasars are usually parametrized by the monochromatic rest frame optical/UV and X-ray luminosities, and in erg s-1 Hz-1, respectively, and the X-ray photon index, . In this paper we will use at = 2500 Å and at = 2 keV.
The X-ray loudness is another parameter in AGN studies that characterizes the relative amount of energy emitted in the optical (e.g. thermal disc component) and X-rays (non-thermal emission). It is defined as a point-to-point spectral slope between the optical/UV and X-ray bands [Avni & Tananbaum, 1982]:
| (1) |
Equation 1 is equivalent to that used in other papers, . We use the minus sign, so our will be positive.
| Source | Outburst | Year | Start | End | No. of pointings | Observed | References | |||
|---|---|---|---|---|---|---|---|---|---|---|
| MJDa | MJDa | Total | M1 | M2 | spectral states | 1022 cm-2 | ||||
| (1) | (2) | (3) | (4) | (5) | (6) | (7) | (8) | (9) | ||
| GRO J1655-40 | 2005 | 53423 | 53685 | 503 | 409 | 344 | all | 0.8 | [1] | |
| XTE J1550-564 | o1 | 1998/1999 | 51064 | 51319 | 233 | 207 | 163 | all | 0.65 | [2] |
| o2 | 2000 | 51644 | 51741 | 164 | 161 | 103 | all | 0.65 | [2] | |
| o3 | 2001 | 51938 | 52028 | |||||||
| o4 | 2002 | 52285 | 52339 | |||||||
| o5 | 2003 | 52726 | 52775 | |||||||
| XTE J1650-500 | 2001/2002 | 52159 | 52385 | 153 | 153 | 73 | all | 0.78 | [3] | |
| XTE J1859+226 | 1999/2000 | 51463 | 51749 | 127 | 127 | 100 | SS, IS | 0.3 | [4] | |
| H 1743-322 | o1 | 2003/2004 | 52727 | 53055 | 217 | 205 | 157 | all | 2.4 | |
| o2 | 2004 | 53198 | 53329 | 64 | 64 | 29 | SS | [5] | ||
| o3 | 2005 | 53595 | 53668 | IS | ||||||
| GX 339-4 | o1 | 1996–1999 | 50291 | 51442 | 90 | 89 | 45 | all | ||
| o2 | 2002/2003 | 52367 | 52808 | 206 | 200 | 140 | 0.6 | [6] | ||
| o3 | 2004/2005 | 53044 | 53603 | 173 | 173 | 134 | ||||
a Modified Julian Date,
The dependencies of and on luminosity ( and/or ) and redshift have important implications on our understanding of quasars nature and evolution, and have been searched for and modeled for many years [e.g. Zamorani et al., 1981, Avni & Tananbaum, 1982, Wilkes et al., 1994, Bechtold et al., 2003, Vignali et al., 2003, Sobolewska, Siemiginowska & Życki, 2004a, b, Richards et al., 2006, Strateva et al., 2005, Steffen et al., 2006, Tang et al., 2007, Kelly et al., 2007, 2008]. Many studies concluded that there is no evidence for a correlation between and redshift or luminosity, although some studies reported that is correlated with both. Recently, Kelly et al. [2008] investigated this correlation in quasars with measured black hole mass. They found that increases with increasing black hole mass and UV luminosity (in terms of the Eddington luminosity) and decreases with increasing X-ray luminosity (in terms of Eddington luminosity), and argue that this implies that the fraction of bolometric luminosity emitted by an accretion disc (thermal), as compared to a corona (non-thermal), increases with increasing accretion rate relative to Eddington. This may suggest that quasars and AGN should exhibit an evolution and a variety of accretion states should be observed. Evolution time-scales of super-massive black holes are too long for monitoring [e.g. – years as suggested by AGN outbursts observed in X-ray clusters, see review by McNamara & Nulsen, 2007], hence studies of large samples of AGN are necessary to identify these accretion states.
GBHs have more favorable time-scales (days-years) for evolution studies and many X-ray spectral states have been observed in one source [a recent review on accretion in Galactic black hole and neutron star binaries can be found in Done, Gierliński & Kubota, 2007]. These objects provide the best observational evidence that the accretion process is not steady even with the continuous supply of accretion fuel to the central engine. Phenomenology of the GBHs X-ray spectral states is well understood and so their spectra may be used as a guidance in studies of accretion processes in AGN. A number of methods have been developed to facilitate separation of the spectral states in GBHs including colour-colour [e.g. Done & Gierliński, 2003] and hardness-intensity diagrams [e.g. Corbel et al., 2004, Belloni et al., 2005, Tomsick et al., 2005, Dunn et al., 2008]. Generalized version of hardness-intensity diagrams was applied to AGN by Körding, Jester & Fender [2006] to explore origins of the radio-loudness (radio-to-optical flux ratio). Based on hardness-intensity diagrams Fender, Belloni & Gallo [2004] established a link between an X-ray spectral state and radio emission from jet in X-ray binaries. In their picture, the low/hard state the X-ray binaries is associated with a steady compact jet. After transition to the intermediate/very high state, the radio emission originates in discrete ejections of plasma and it fades away while the source continues to evolve [e.g. Corbel et al., 2001]. The high/soft spectral state is radio-quiet.
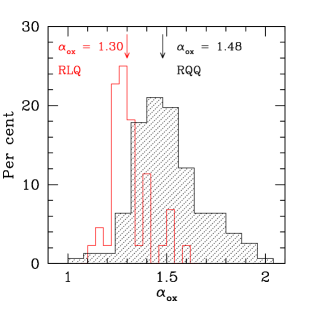
In this paper we concentrate on the X-ray loudness of AGN, optical-to-X-ray flux ratio, . Figure 1 shows a distribution of in a sample of 157 optically selected Type 1 radio-quiet quasars [RQQs, Kelly et al., 2008] and in a sample of 908 radio-loud quasars observed in the soft 0.1–2.4 keV X-ray band by ROSAT [RLQs, Green et al., 1995]. RLQs are on average more X-ray loud with median , as opposed to median for RQQs. (Objects with only an upper limit on are excluded from the radio-quiet sample.) This difference is qualitatively explained by the jet radiation contributing to the X-ray band in the RLQs.
We compare and analogous parameter that we define for GBHs, . The two parameters have the same physical meaning: they provide a measure of relative strength of the accretion disc and Comptonized components. We study the evolution with disc and Comptonization luminosities throughout an outburst to provide a baseline for comparison with relations studied extensively in AGN: vs. and . Our goal is to use phenomenology of GBHs to learn more about spectral states of local AGN and high- quasars. If accretion acts in a similar way in massive black holes in the centre of galaxies and in stellar mass black hole binaries, the properties of and distributions, and the way they depend on other spectral observables should correspond to each other.
The structure of the paper is as follows. In Sec. 2 we define the parameter for Galactic black hole binaries. Section 3.1 contains details of RXTE data selection, reduction and analysis. We describe there our results regarding parametrization of several outbursts of black hole binaries with . In Sec. 4 we compare GBHs and AGN in terms of spectral indices (, and ) and their relations with the disc and Componization fluxes. Section 5 contains discussion of our results and conclusions.
2 Parametrization of GBH binaries
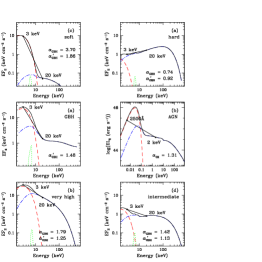
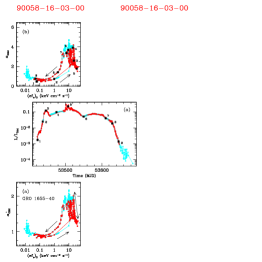
In Fig. 2 we show the shape of GRO J1655-40 spectra in different spectral states. The individual spectra correspond to observations 2, 5, 6 and 8 in the long term lightcurve of outburst presented in Fig. 3a. Note that the luminosity of the source in these four states is high in terms of the Eddington luminosity and it is always higher than . We calculated the Eddington luminosity for isotropic emission from accreting black hole with mass of 6.3 M⊙ located at the distance of 3.2 kpc [McClintock & Remillard, 2006]. This outburst contains all known spectral states: soft (including ultra-soft with very weak hard X-ray tail, very high with strong hard X-ray emission, and typical soft state dominated by disc emission and showing a power law with soft photon index), intermediate and hard.
With the exception of the hard-state data, the spectra are dominated by the disc at 3 keV. Conversely, hard X-ray power-law like radiation dominates at 20 keV (see Sec. 3.1 for details of the applied model). Hence, for each GBH spectrum we find the counterpart of quasars’ parameter (Eq. 1) defined as
| (2) |
where and are (unabsorbed) (keV cm-2 s-1) fluxes at 3 and 20 keV, respectively. This definition is illustrated in Fig. 2. In the hard state when the disc spectrum is cool and weak the measures effectively the photon index of the Comptonized component and may not correspond directly to the in AGN (Fig. 2a).
3 Data reduction and analysis


.

3.1 Data
We analysed RXTE data from a number of Galactic black hole X-ray binaries: GRO J1655–40, XTE J1550–564, XTE J1650–500, XTE J1859+226, H1743+332 and GX 339–4. We used all archive data available before June 2007, in total 1930 pointed observations. The best outburst coverage is available for GRO J1655–40, XTE J1550–564 (1998/1999 outburst) and XTE J1650–500. Table 1 contains list of sources, time-span of outbursts and observed spectral states.
We reduced data from public HEASARC111High Energy Astrophysics Science Archive Research Center archives using ftools ver. 6.2. We extracted PCA222Proportional Counter Array Standard 2 spectra for detector 2, top layer only, in the 3–20 keV band and HEXTE spectra from both detectors in the 20–200 keV band. We obtained one spectrum per pointed observation and we accounted for systematic errors in PCA data at the level of 1%. For background estimate we used the latest background models available from RXTE data analysis web-pages, together with appropriate background model files. To enhance the signal-to-noise ratio, , we rebinned the PCA and HEXTE spectra requiring that in each new bin (which corresponds to 20 source photons in each new bin). We modeled the spectra using xspec ver. 11.3 [Arnaud, 1996] to find the photon index, and the fluxes at 3 and 20 keV. Based on these monochromatic fluxes we estimated the relative strength of the disc and hard X-ray fluxes parametrized by (Eq. 2). We applied two methods of data analysis.
In the first method (Method 1), we fitted simultaneously the PCA/HEXTE (3–200 keV) spectra with a model consisting of a multicolour disc blackbody, thermal Comptonization [thcomp in xspec; Zdziarski, Johnson & Magdziarz et al., 1996], Gaussian line profile to model iron K feature, and smeared edge (smedge) to account for iron K absorption. We also added Galactic absorption with fixed throughout the outburst at best values from literature (Table 1), and a constant to account for differences in normalization between PCA and HEXTE (the constant has been fixed at 1 for PCA). The complete model is described in xspec as constant*wabs*smedge*(gaussian + diskbb + thcomp) [see Done & Gierliński, 2003, for details]. Several data sets show evidence of a non-thermal tail at high energies [compare, e.g., Zdziarski et al., 2001], which was not accounted for by the model. However, the discrepancy is significant only at the energies higher than 20 keV. In PCA bandpass (in particular at 3 and 20 keV) the model describes the data well, and the reduced for the fit to the full PCA/HEXTE band is always lower than 2. We determine the and fluxes directly from these spectral fits.
We use only these data sets that give reduced , in total 1691 observations. Among them, some soft state observations that are bright in the PCA bandpass, show very low HEXTE flux. In addition, the hard state data at the beginning and end of an outburst show overall low flux in both the PCA and HEXTE bandpasses. In these two cases we estimate based on PCA data, and use only these PCA data sets that after rebinning contain at least 10 bins with .
In the second method (Method 2), we consider the 20–40 keV HEXTE hard X-ray band with negligible contribution from the disc. We perform constant*powerlaw fits with the constants for each HEXTE detector fixed at the values found in Method 1. We used only the data sets which gave the reduced and for which the photon index could be constrained between 1 and 8 at 90 per cent confidence level, in total 1006 observations. In this method, the is derived from 20–40 keV HEXTE fits and is taken from models described in Method 1.
In both methods the photon index is a fit parameter and we use Eq. 1 to calculate . Method 1 is more comprehensive because in general it is based on the broad band PCA/HEXTE fits. Hence, the results drawn from Method 1 can be regarded as a reference for our considerations. Conversely, Method 2 ‘mimics’ the methodology commonly applied to the AGN, for which conclusions about radiation mechanisms are drawn based on incomplete information about the spectra, i.e. discontinuous observations taken in optical/UV (cool disc) and X-rays. Thus, results of Method 2 are better suited for GBHs vs. AGN comparison.
Studies of large samples consisting of AGN observed with different X-ray missions cannot rely on hardness ratios because this would introduce instrumental effects Instead, parametrisation based on spectral fits is used. We also use spectral fits to perform a consistent analogy between the GBHs and AGN. We note however that we get consistent and robust results on independently on the spectral model as long as the fit is good (see Sobolewska, Gierliński, Siemiginowska 2009 in preparation, where we use eqpair to fit the data of GRO J1655-40). In the remaining of the paper we compare GBHs with the AGN. We investigate any possible issues in the interpretation of the AGN data, determine the spectral state of the observed AGN, and identify classes of objects that may be missing.
3.2 Example of GRO J1655-40
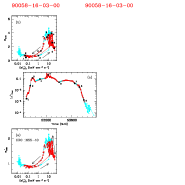
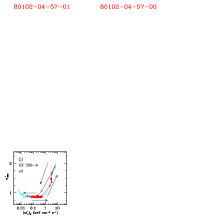
Figure 3b shows as a function of monochromatic disc flux at 3 keV, , for GRO J1655-40. We indicate the results of Methods 1 and 2 with cyan and red colours, respectively. There is a characteristic circular pattern in the diagram resembling that seen in the GBHs hardness-intensity diagrams [e.g. Fender, Belloni & Gallo, 2004, Dunn et al., 2008]. However, hardness-intensity diagrams in the literature use diverse definitions of hardness, and based on them it is difficult to draw direct analogies between GBHs and AGN. Uniform parametrization with that we propose in this paper makes such a comparison straightforward (see Sec. 4). Below we describe how the spectral evolution of GRO J1655-40 throughout an outburst affects evolution of . This can be generalized to the case of other GBHs, as we show in Sec. 4.
There is no linear correlation between the and , and there is no unique value of characteristic of a given spectral state. At the beginning of the outburst (observation 1 in Fig. 3) the source is in a hard state, the is less than unity and it simply provides a measure of the slope of the Comptonization. With time disc and Comptonization luminosities increase, but the spectral shape does not change much, and stays approximately constant (observation 2). During the hard-to-soft state transition the source moves toward the upper right corner of the plot (observation 3) and increases. In the soft spectral state the disc flux does not vary significantly as opposed to the Comptonized component flux, and wide range of is covered while the source moves up and down on the diagram (observations 3, 4, 5 and 6). Observation 5 is an example of the very high state spectrum, resulting in moderate and position in the lower right corner of the diagram. In the ultra-soft state reaches the maximum (observation 6). Observation 7 marks the beginning of the soft-to-hard state transition. The decreases (observation 8) and the source moves back to the hard state (observation 9).
Data succeeding observation 9 have statistics too poor to be considered in Method 2, because HEXTE is not sensitive enough to give reasonable results for such low luminosity hard states. Similarly, a number of data sets surrounding observation 4 were excluded by Method 2. These data represent an ultra-soft state, with a weak Comptonized tail. Future observations with more sensitive hard X-ray detectors (e.g. NuStar, EXIST) will provide a better coverage for the sources in the low luminosity hard state.
4 Results: Comparison of GBH binaries and AGN
4.1 Distribution of the disc-to-Comptonization index
Central black holes in AGN are 5–8 orders of magnitude more massive than in GBHs. Disc temperature scales with mass as for a given fraction of Eddington luminosity, so the disc is cooler in AGN and emits in optical/UV band instead of soft X-rays. For AGN, the disc-to-Comptonization slope called X-ray loudness is defined for keV and 2 keV, whereas we define our for 3 and 20 keV. This means that the disc-to-Comptonization slope, parametrized by in GBHs, needs to be scaled, or ‘stretched’, before it can be directly compared with in AGN. We account for the shift of the disc spectrum towards lower energies in AGN by defining
| (3) |
where , and is given by Eq. 2. After this correction, a spectrum of a GBH and a spectrum of an AGN with the same ratio of the disc normalization to the Comptonization normalization will result in a comparable and indices.
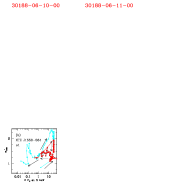
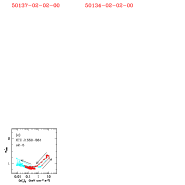
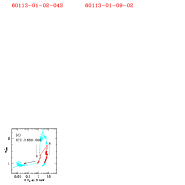
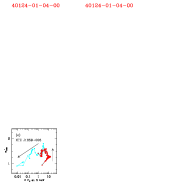
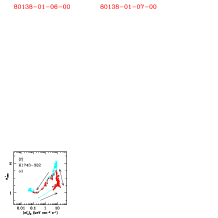
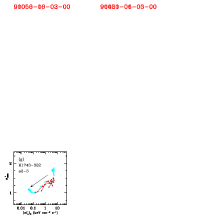
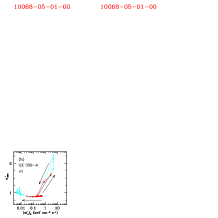
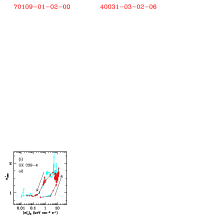
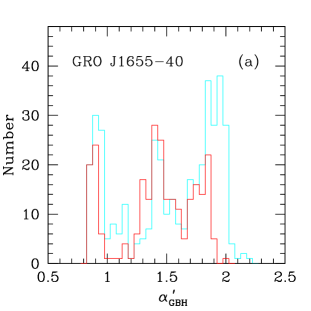
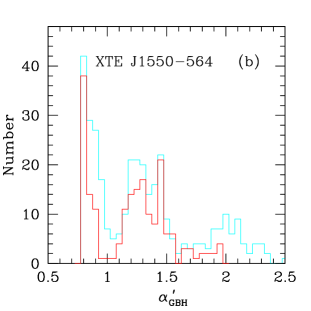
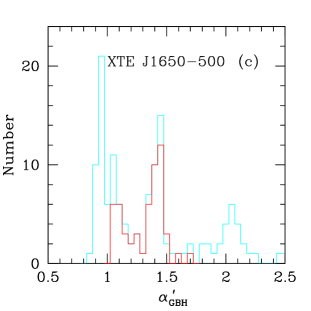
We have found for a number of GBHs. In Fig. 4 we show the results of calculating both directly from the PCA/HEXTE fits (Method 1, cyan) and from the method that mimics the AGN studies, and uses only a part of the hard X-ray spectrum, here 20–40 keV (Method 2, red). Both methods give similar results, but Method 2 is more restrictive and excludes significant number of data points in the soft and ultra-soft states and in the hard state with low luminosity, where the HEXTE data are too weak to constrain . Figure 4 shows that the shape of the track in the (and hence ) and diagram found for GRO J1655–40 (Fig. 3) is similar in other sources.
Scaling disc-to-Comptonization index according to Eq. 3 results in parameter ranging between 1 and 2, which is consistent with the AGN observations as shown by histogram of (Fig. 1) produced for the optically selected radio-quiet quasars cross-correlated with the Chandra X-ray archive [Kelly et al., 2007] and for radio-loud ROSAT quasars [Green et al., 1995]. For the AGN samples, distributions peak at 1.5 and 1.3, respectively. To compare the behaviour of AGN and GBHs we produced histograms of for three Galactic sources with the best coverage of their outbursts: GRO 1655–40, XTE J1550–564 and XTE J1650–500 (Figs. 5a–c). In the case of XTE J1550–564, we considered all its 5 outbursts together. Three main peaks can be distinguished in the GBHs distributions, close to of 1, 1.5 and 2. These peaks correspond to the hard, very high/intermediate and typical-soft/ultra-soft spectral states, respectively. (Shapes of the very high and intermediate states energy spectra are very similar, with the only difference being much higher luminosity in the very high state.) A comparison of Figs. 5a–c and Fig. 1 for GBHs and AGN, respectively, suggests that majority of the observed AGN are most probably in a spectral state corresponding to the very high/intermediate state of GBHs.
We stress the difference between the distributions arising from Methods 1 (cyan) and 2 (red). When Method 2 is applied (the one that corresponds to AGN methodology), the soft and hard state peaks (centred at and 1, respectively) are suppressed, which is most clearly visible in the case of XTE J1650-500 for which the soft state peak disappears from the distribution (Fig. 5c).
In the remaining part of this section we use only the and resulting from Method 2 to better compare the GBHs and AGN.
4.2 Disc-to-Comptonization index vs. the photon index
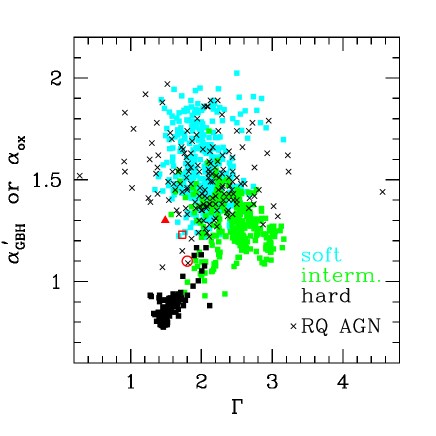
In Fig. 6 we plot the ’stretched’ disc-to-Comptonization index, , versus the photon spectral index, . The light grey/cyan, dark grey/green and black squares show different spectral states of GBHs: soft, intermediate and hard, respectively. Note that our soft state includes in addition to a typical soft state also the ultra-soft (with a very weak X-ray tail) and very high (with a strong disc and strong Comptonization) state spectra. The data form an S-like track in the diagram. In the hard state the photon index is hard with a median , the disc flux is weak, so the median is low, and the data occupy the lower left corner of the diagram. Upper part of the diagram corresponds to the soft state GBHs. It is worth noting that is most probably not the real upper limit for , but it results from HEXTE sensitivity limits to detect 20–40 keV flux. The centre of the diagram is occupied by the very high/intermediate state GBHs.
We plot the Type 1 radio-quiet quasars data [black crosses, Kelly et al., 2007] with black crosses in the same figure and it can be seen that majority of them cluster in the centre of the diagram, and so they coincide with the very high/intermediate state GBHs, while minority with greater than 1.6–1.7 match the soft state GBHs. All but four of these AGN have photon index smaller than and between 1 and 2. This sample does not contain quasars with a very soft photon index. However, some Narrow Line Seyfert 1 galaxies have [Boller et al., 1996] and thus might provide examples of AGN in the soft state with .
We do not show the radio-loud sample from Fig. 1 here because of lack of the simultaneous measurements of the photon index of the power-law like part of their X-ray spectrum (ROSAT observations covered soft 0.1–2.4 keV X-ray band, sufficient to estimate but not ). However, we characterize the radio-loud quasars in Fig. 6 with average properties derived for the composition of Elvis et al. [1994, we plot the 2–10 keV photon index] and the sample of 16 RLQs of Gambill et al. [2003, defined between 2500Å and 1 keV]. On average the RLQs are placed on the left low- edge of the GBH trail. The derived average photon index of RLQs samples ranges from to 1.8 and is flatter than average radio-quiet in Kelly et al. [2007]. This effect is usually explained with jet or jet-related emission. We can conclude that the RLQs would also correspond to the intermediate/very high state of GBHs. We also show 13 low-luminosity LINERs from Maoz [2007]. We may hypothesize that some radio-loud quasars [e.g. Bechtold et al., 1994, Gambill et al., 2003] and LINERs [e.g. Maoz, 2007] with and a typical photon index of –2 [e.g. Bechtold et al., 1994, Belsole et al., 2006] may be in a hard state.
4.3 Dependence of spectral indices on disc and Comptonization fluxes


Correlations between spectral indices ( and ) and disc and Comptonization fluxes, and , are intensively studied in the AGN samples. Particular attention is given recently to the radio-quiet objects and here we will focus on this sub-class. Highly significant correlation was reported between the optical/UV and X-ray fluxes [e.g. Steffen et al., 2006], and between the and [e.g. Steffen et al., 2006, Kelly et al., 2007, 2008]. Kelly et al. [2008] considered a large sample of objects with estimated mass of the black hole and they found that the X-ray photon index correlates with both X-ray and optical/UV luminosities expressed in Eddington units, i.e. and . They interpreted this as a result of correlation with the mass accretion rate.
In the previous sections we showed that there is no linear correlation of with disc luminosity, , when individual objects are considered. Here we check if there are any correlations of with either disc or Comptonization luminosities within a given spectral state, and for this purpose we analyse data of all considered GBHs together.
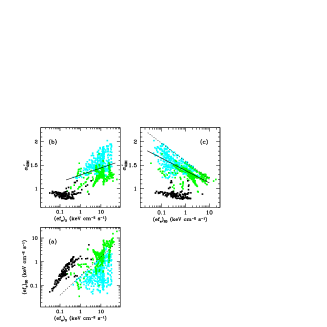
Figure 7a shows that in the hard state the fluxes at 3 and 20 keV are proportional to each other and that this correlation may hold also for the intermediate state data. This correlation arises because in the hard state the Comptonization dominates the entire X-ray band (Fig.2a), including soft X-rays which in other states are dominated by disc thermal emission, and so and change in a similar way. Such hard state correlation between the disc and Comptonization fluxes should not be however expected in hard-state AGN whose disc emission may be masked by the host galaxy.
The dotted line in Fig. 7a, , indicates the upper limit for the soft state data. This limit shows a relation between the disc and Comptonized components in the soft state. This state is dominated by the accretion disc emission, so there is a threshold to the amount of the Comptonization at a given thermal disc emission, e.g. a maximum to the division of the energy release between the disc and the corona in the accretion process.
The is consistent with being constant in the hard state (Fig. 7b–c). In the intermediate and soft states we find formal correlations of with the disc and Comptonization fluxes, and , respectively. The former correlation is consistent with those found for AGN [Steffen et al., 2006, Kelly et al., 2008]. The later is marginally consistent with only the correlation reported by Kelly et al. [2008, they consider, however, dependence of on monochromatic X-ray luminosity in Eddington units, and here we do not correct GBH luminosities for difference in black hole mass].
We do not see any obvious correlation between the photon index and either the disc or Comptonization flux in any of the spectral states. This result does not change if the fluxes are expressed in the Eddington units, as in Kelly et al. [2008].
The intermediate state data may form narrow tracks due to transitions between the hard and soft states (e.g. Figs. 7b-c). The soft and intermediate states in Fig. 7c seem to be restricted by the function. This limit is formed by the data with highest flux that for our sources does not exceed 40 keV cm-2 s-1 (Figs. 7a-b). Interestingly, the slope of this limit is consistent with the and correlation found by Kelly et al. [2008].
5 Discussion and Conclusions
In this paper we drew analogy between accretion disc vs. Comptonized component emissions in GBHs and AGN. We introduced an parameter to describe the SEDs of GBHs throughout their outbursts. This new parameter has the same physical meaning and occupies the same range of values as the X-ray loudness, , used to characterize the AGN optical-to-X-ray spectra. The central engine in both AGN and GBHs is powered by a black hole accreting matter from the host galaxy (AGN) or from a companion star (GBHs). Thus, the underlying physics and radiative processes producing SED in these two classes of objects should be similar. In particular, the properties of and distributions, and the way they depend on other spectral observables should correspond to each other.
We have applied the methodology commonly used in the AGN studies to a number of RXTE data of GBHs. We found that the majority of the observed Type 1 radio quiet AGN may be in a spectral state similar to a very high state, which is one of the soft states of GBHs, or in an intermediate state. We base this conclusion on two findings. First, detailed analysis of GBH outbursts during which sources cover all spectral states shows that distribution has three distinctive peaks: 1 (corresponding to the hard spectral state), (very high/intermediate state) and (typical soft and ultra-soft state), while the distribution for AGN is single-peaked with an average close to 1.5 (Figs. 5 and 1). Second, the analysis of the vs. X-ray photon index,, diagram (Fig. 5) reviled that Type 1 RQQs occupy the same region as the GBHs in the intermediate/very high state. Interestingly, McHardy et al. [2007] reported that Ark 564 stays most probably in the very high/intermediate state. This conclusion was reached based on the variability studies and position of characteristic frequency in power density spectrum of this Seyfert 1. However, we note that a fraction of AGN from the Kelly et al. [2008] sample reminds the soft state GBHs.
We argue that the observed radio-loud quasars may also be the counter-parts of the very high/intermediate state GBHs. This is in agreement with the GBHs studies that show presence of the radio emission in some of the very high/intermediate states, shortly after the transition from the hard (or typical soft) state [e.g Corbel et al., 2001]. We should note here that the peak in the distribution of around 1.5 is a superposition of the radio-quiet and radio-loud states. In the Fender, Belloni & Gallo [2004] jet model for GBHs the radio-quiet (soft) and radio-loud (hard, intermediate, very high) states are separated with so called ’jet line’ placed at a certain value of hardness ration. In our description, this would correspond to –1.5 (the approximate border line between the intermediate/very high and soft state data, Fig. 7b), which interestingly fits between the maxima of the distributions of the for the radio-loud and radio-quiet AGN (Fig. 1). More detailed discussion of the connection between the radio-loud AGN and GBHs is however beyond the scope of the present paper. We note that spectra of LINERs show spectral indices similar to those seen in the hard state GBHs.
The presence of three peaks in the distribution of (Fig. 5) indicates that the time of transition between the spectral states is much shorter than the time the source spends in a given state. Thus, physical conditions resulting in characteristic spectral shapes must be relatively ‘stable’. Analogous distribution should be expected in AGN, and the most important question arising from this study is whether AGN able to form the two peaks at around 1 and 2 exist, but are missed in present surveys.
It is possible that the two extreme peaks apparent in the distribution of are missed in AGN samples due to selection effects. The AGN samples rely on optical detections, hence low disc luminosity hard state objects with could be absent from the sample. The AGN optical flux in the hard state would be low and buried within the host galaxy emission, and thus they could not be classified as AGN. However, hard state AGN still should be present and even detected in X-ray surveys. It is interesting to note that they may ‘mimic’ so-called absorbed sources, as their X-ray spectra will be hard. Their emission would contribute to the hard X-ray background emission. The AGN counterparts of the ultra-soft GBHs with might have been omitted because their X-ray emission is probably too weak to be detected by Chandra and XMM-Newton. This aspect is considered in more details in our next paper (Sobolewska et al., in preparation).
All GBHs contain a black hole of similar mass, of the order of several Solar masses [see e.g. Done & Gierliński, 2003, McClintock & Remillard, 2006, and references therein]. In contrast, the AGN samples contain black holes that differ in mass even by 3–4 orders of magnitude. It is known that the mass of the central objects affects the temperature of the accretion disc and thus alters the overall broad band energy distribution. Thus, in Paper II we discuss how the mass spread in AGN samples can affect the results. In particular we check if the correlations between the spectral indices and disc and/or Comptonization fluxes (not observed here, or not consistent with the AGN observations) may arise as the effect of mass distribution in the AGN samples. On the other hand, our results presented in Sec. 4.3 provide predictions for relations between the and monochromatic fluxes in a narrow black hole mass bin. Such studies may soon become possible as the number of AGN for which black hole masses were estimated from independent methods (gas/star dynamics, line widths, variability properties) increases.
Acknowledgements
We thank Paul Green for valuable discussions about AGN surveys, and the anonymous referee for careful reading of the manuscript and comments on how to improve it. This research was funded in part by NASA contract NAS8-39073 and Chandra awards GO2-3148A and GO5-6113X. MS was supported by EU grant MTKD-CT-2006-039965 and by Polish grant N20301132/1518 from Ministry of Science and Higher Education. MG acknowledges support from STFC Fellowship and Polish grant NN203065933.
References
- Arnaud [1996] Arnaud K.A., 1996, in Jacoby G.H., Barnes J., eds, Astronomical Data Analysis Software and Systems V. ASP Conf. Ser. Vol. 101. Astron. Soc. Pac., San Francisco, p. 17
- Avni & Tananbaum [1982] Avni Y., Tananbaum H., 1982, ApJL, 262, L17
- Bechtold et al. [1994] Bechtold J. et al., 1994, AJ, 108, 759
- Bechtold et al. [2003] Bechtold J. et al., 2003, ApJ, 588, 119
- Belloni et al. [2005] Belloni T., Homan J., Casella P., van der Klis M., Nespoli E., Lewin W.H.G., Miller J.M., Méndez M., 2005, A&A, 440, 207
- Belsole et al. [2006] Belsole E., Worrall D.M., Hardcastle M.J., 2006, MNRAS, 366, 339
- Boller et al. [1996] Boller T., Brandt W.N., Fink H., 1996, A&A, 305, 53
- Capitanio et al. [2005] Capitanio F. et al., 2005, ApJ, 622, 503
- Coppi [1999] Coppi P.S., 1999, in Poutanen J., Svensson R., eds, High Energy Processes in Accreting Black Holes. ASP Conf. Ser. Vol. 161, Astron. Soc. Pac., San Francisco, p. 375
- Corbel et al. [2001] Corbel S. et al., 2001, ApJ, 554, 43
- Corbel et al. [2004] Corbel S., Fender R.P., Tomsick J.A., Tzioumis A.K., Tingay S., 2004, ApJ, 617, 1272
- Dunn et al. [2008] Dunn R.J.H., Fender R.P., Körding E.G., Cabanac C., Belloni T., 2008, MNRAS, 387, 545
- Elvis et al. [1994] Elvis M. et al., 1994, ApJS, 95, 1
- Done, Gierliński & Kubota [2007] Done C., Gierliński M., Kubota A., 2007, A&AR, 15, 1
- Done & Gierliński [2003] Done C., Gierliński M., 2003, MNRAS, 342, 1041
- Fender, Belloni & Gallo [2004] Fender R.P., Belloni T.M., Gallo E., 2004, MNRAS, 355, 1105
- Gambill et al. [2003] Gambill J.K., Sambruna R.M., Chartas G., Cheung C.C., Maraschi L., Tavecchio F., Urry C.M., Pesce J.E., 2003, A&A, 401, 505
- Gierliński, Maciołek-Niedźwiecki & Ebisawa [2001] Gierliński M., Maciołek-Niedźwiecki A., Ebisawa K., 2001, MNRAS, 325, 1253
- Gierliński & Done [2003] Gierliński M., & Done C., 2003, MNRAS, 342, 1083
- Green et al. [1995] Green P.J. et al., 1995, ApJ, 450, 51
- Hynes et al. [2002] Hynes R.I., Haswell C.A., Chaty S., Shrader C.R., Cui W., 2002, MNRAS, 331, 169
- Kelly et al. [2007] Kelly B.C., Bechtold J., Siemiginowska A., Aldcroft T., Sobolewska M., 2007, ApJ, 657, 116
- Kelly et al. [2008] Kelly B.C., Bechtold J., Trump J.R., Vestergaard M., Siemiginowska A., 2008, preprint (astro-ph/08012383)
- Körding, Jester & Fender [2006] Körding E.G., Jester S., Fender R., 2006, MNRAS, 372, 1366
- Maoz [2007] Maoz D., 2007, MNRAS, 377, 1696
- Markoff, Nowak & Wilms [2005] Markoff S., Nowak M.A., Wilms J., 2005, ApJ, 635, 1203
- McClintock & Remillard [2006] McClintock J.E., Remillard R.A., 2006, in Lewin W., van der Klis M., eds, Cambridge Astroph. Ser. Vol. 39, Compact Stellar X-ray Sources. Cambridge University Press, Cambridge, p. 157
- McHardy et al. [2007] McHardy I.M., Arévalo P., Uttley P., Papadakis I.E., Summons D.P., Brinkmann W., Page M.J., 2007, MNRAS, 382, 985
- McNamara & Nulsen [2007] McNamara B.R., Nulsen P.E.J., 2007, ARAA, 45, 117
- Miniutti, Fabian & Miller [2004] Miniutti G., Fabian A.C., Miller J.M., 2004, MNRAS, 351, 466
- Mitsuda et al. [1984] Mitsuda K. et al., 1984, PASJ, 36, 741
- Richards et al. [2006] Richards G.T. et al., 2006, ApJS, 166, 470
- Sobolewska, Siemiginowska & Życki [2004a] Sobolewska M.A., Siemiginowska A., Życki P.T., 2004a, ApJ, 617, 102
- Sobolewska, Siemiginowska & Życki [2004b] Sobolewska M.A., Siemiginowska A., Życki, P.T., 2004b, ApJ, 617, 102
- Steffen et al. [2006] Steffen A.T., Strateva I., Brandt W.N., Alexander D.M., Koekemoer A.M., Lehmer B.D., Schneider D.P., Vignali C., 2006, AJ, 131, 2826
- Strateva et al. [2005] Strateva I.V., Brandt W.N., Schneider D.P., Vanden Berk D.G., Vignali C., 2005, AJ, 130, 387
- Tang et al. [2007] Tang S.M., Zhang S.N., Hopkins P.F., 2007, MNRAS, 377, 1113
- Tomsick et al. [2005] Tomsick J.A., Corbel S., Goldwurm A., Kaaret P., 2005, ApJ, 630, 413
- Vignali et al. [2003] Vignali C., Brandt W.N., Schneider D.P., 2003, AJ, 125, 433
- Wilkes et al. [1994] Wilkes B.J., Tananbaum H., Worrall D.M., Avni Y., Oey M.S., Flanagan J., 1994, ApJS, 92, 53
- Zamorani et al. [1981] Zamorani G. et al., 1981, ApJ, 245, 357
- Zdziarski, Johnson & Magdziarz et al. [1996] Zdziarski A.A., Johnson W.N., Magdziarz P., 1996, MNRAS, 283, 193
- Zdziarski et al. [1998] Zdziarski A.A., Poutanen J., Mikolajewska J., Gierliński M., Ebisawa K., Johnson W.N., 1998, MNRAS, 301, 435
- Zdziarski, Lubiński & Smith et al. [1999] Zdziarski, A.A., Lubiński P., Smith D.A., 1999, MNRAS, 303, L11
- Zdziarski et al. [2001] Zdziarski A.A., Grove J.E., Poutanen J., Rao A.R., Vadawale S.V., 2001, ApJL, 554, L45
- Zdziarski et al. [2004] Zdziarski A.A., Gierliński M., Mikołajewska J., Wardziński G., Smith D.M., Harmon B.A., Kitamoto S., 2004, MNRAS, 351, 791