Modeling Porous Dust Grains with Ballistic Aggregates.
II.
Light Scattering Properties
Abstract
We study the light scattering properties of random ballistic aggregates constructed in Shen et al. (Paper I). Using the discrete-dipole-approximation, we compute the scattering phase function and linear polarization for random aggregates with various sizes and porosities, and with two different compositions: 100% silicate and 50% silicate-50% graphite. We investigate the dependence of light scattering properties on wavelength, cluster size and porosity using these aggregate models. We find that while the shape of the phase function depends mainly on the size parameter of the aggregates, the linear polarization depends on both the size parameter and the porosity of the aggregates, with increasing degree of polarization as the porosity increases. Contrary to previous studies, we argue that monomer size has negligible effects on the light scattering properties of ballistic aggregates, as long as the constituent monomer is smaller than the incident wavelength up to where is the monomer radius. Previous claims for such monomer size effects are in fact the combined effects of size parameter and porosity. Finally, we present aggregate models that can reproduce the phase function and polarization of scattered light from the AU Mic debris disk and from cometary dust, including the negative polarization observed for comets at scattering angles . These aggregates have moderate porosities, , and are of sub--size for the debris disk case, or -size for the comet case.
Subject headings:
dust, extinction – polarization – scattering – circumstellar matter – comets – interplanetary medium – stars: individual (AU Mic, GJ 803)1. Introduction
Interplanetary dust particles (IDPs) collected in the Earth’s stratosphere by high-flying aircraft (Brownlee, 1985; Warren et al., 1994) usually have irregular shapes and fluffy structures. Similar structures have been produced in laboratory and microgravity experiments of dust particle interactions (Wurm & Blum, 1998; Blum & Wurm, 2000; Krause & Blum, 2004). It has also been suggested that interstellar dust grains may consist primarily of such aggregate structures (e.g., Mathis & Whiffen, 1989; Dorschner & Henning, 1995), with a mixture of various chemical compositions and vacuum.
Porous, composite aggregates are often modeled as a cluster of small spheres (“spherules” or “monomers”), assembled under various aggregation rules. The optical properties of these aggregates can be calculated using numerical schemes such as the generalized multisphere Mie (GMM) solution (Mackowski, 1991; Xu, 1997) or the discrete dipole approximation (DDA) method (e.g., Purcell & Pennypacker, 1973; Draine & Flatau, 1994). These methods have been used to study the optical properties of different kinds of aggregates during the past decade (e.g., West, 1991; Lumme & Rahola, 1994; Petrova et al., 2000; Kimura et al., 2006; Bertini et al., 2007; Lasue et al., 2009); most of those studies are dedicated to interpret the phase function and polarization of light scattered by cometary dust.
In a companion paper (Shen et al., 2008, hereafter Paper I), we constructed aggregates using three specific aggregation rules: ballistic agglomeration (BA), ballistic agglomeration with one migration (BAM1) and ballistic agglomeration with two migrations (BAM2). We developed a set of parameters to characterize the irregular structure of these aggregates. While the BA clusters are essentially the Ballistic Particle-Cluster Agglomeration (BPCA) clusters frequently used in the literature (e.g., West, 1991; Kozasa et al., 1992, 1993; Ossenkopf, 1993; Kimura et al., 2006; Bertini et al., 2007; Lasue et al., 2009), the newly-introduced BAM1 and BAM2 clusters have geometries that are random but substantially less “fluffy” than the BA clusters. The effective porosity (eq. 12 in Paper I) increases from BAM2BAM1BA and covers a wide dynamical range, allowing us to investigate the effects of porosity on the optical properties of the aggregates in a systematic way. Using these aggregation rules, we can construct grain models with various sizes and compositions. In Paper I, we computed total scattering and absorption cross sections for the three types of aggregates (BA, BAM1 and BAM2), for three different compositions (50% silicate and 50% graphite; 50% silicate and 50% amorphous carbon AC1, Rouleau & Martin, 1991, and 100% silicate), and for wavelengths from 0.1 µm to . The purpose of this paper is to investigate the detailed light scattering properties of these aggregates, i.e., the phase function and the linear polarization.
The paper is organized as follows: in §2 we recapitulate our aggregate models; the scattering phase function and linear polarization for various ballistic aggregates are presented in §3, where we explore the dependence of light scattering properties on aggregate properties; we present examples of aggregates that can be applied to circumstellar debris disks and cometary dust in §4, and we show that moderate porosity aggregates can reproduce the observed scattering and polarization properties of dust in both solar system comets and extrasolar debris disks. We summarize our results in §5.
2. Aggregate Models
A detailed description of the target generation algorithms and resulting geometric properties of the BA, BAM1 and BAM2 clusters can be found in Paper I. Here we review some of the basic concepts that will be used in the following sections.
Each aggregate is composed of spherical monomers with radius . We define the “effective radius” of a cluster, , to be the radius of an equal-volume solid sphere; thus our aggregates have
| (1) |
The structure of the cluster is characterized by a porosity parameter (see eq. 12 of Paper I) and a characteristic radius (see eq. 11 of Paper I), which depends on and is typically times . Tables 1 and 2 of Paper I give tabulated mean values of and for the three types of aggregates with . For a given value of , the BA clusters have the highest , while the BAM2 clusters have the lowest . Information for the specific cluster geometries employed in this paper can be found in Table 1, including the porosity , the number of dipoles representing the realization, and the number of dipoles per sphere, . The actual geometry (including images) of these and other realizations of BA, BAM1, and BAM2 clusters can be obtained online.111 http://www.astro.princeton.edu/draine/agglom.html
| cluster | Figs. | ||||
|---|---|---|---|---|---|
| BA.256.1 | 0.8598 | 1.9249 | 115656 | 451.8 | 6 |
| BA.256.2 | 0.8525 | 1.8925 | 105855 | 413.5 | 6 |
| BA.256.3 | 0.8553 | 1.9050 | 102725 | 401.3 | 6 |
| BAM1.32.4 | 0.6188 | 1.3791 | 13903 | 434.5 | 4ab |
| BAM1.256.1 | 0.7060 | 1.5038 | 103921 | 405.9 | 6 |
| BAM1.256.2 | 0.7412 | 1.5693 | 107160 | 418.6 | 6 |
| BAM1.256.3 | 0.6980 | 1.4904 | 107047 | 418.2 | 6 |
| BAM2.256.1 | 0.5632 | 1.3179 | 113696 | 444.1 | 1,3,4cd,5,6,7 |
| BAM2.256.2 | 0.5781 | 1.3333 | 103509 | 404.3 | 1,3,4cd,5,6,7 |
| BAM2.256.3 | 0.5818 | 1.3372 | 107332 | 419.3 | 1,3,4cd,5,6,7 |
| BAM2.512.14 | 0.6127 | 1.3719 | 211211 | 412.5 | 4ab |
| BAM2.1024.1 | 0.6386 | 1.4039 | 414977 | 405.3 | 4cd,8 |
| BAM2.1024.2 | 0.6476 | 1.4158 | 412077 | 402.4 | 4cd,8 |
| BAM2.1024.3 | 0.6387 | 1.4041 | 430184 | 420.1 | 4cd,8 |
Note. — Naming convention: “BA.256.1” means realization 1 of the BA clusters.
In Paper I we considered three different compositions: 50% silicate + 50% graphite, 50% silicate + 50% AC1, and 100% silicate. Silicate material accounts for perhaps 2/3 of the total mass of interstellar dust, and it is natural to assume that silicates will also provide the bulk of the refractory material in comets or debris disks. Interstellar silicates are amorphous; and amorphous silicates are believed to dominate the silicate mass even in the case of comets or circumstellar disks where crystalline silicates have been detected. We use the “astrosilicate” dielectric function (Draine & Lee, 1984; Draine, 2003).
Carbonaceous material provides a significant fraction of the total mass of interstellar grains, and this may also be true of dust in comets and debris disks. The smallest carbonaceous particles in the ISM consist primarily of polycyclic aromatic hydrocarbon material, but the form of the carbon in the larger grains (where most of the carbon resides) remains uncertain: Pendleton & Allamandola (2002) conclude that the hydrocarbon material is aromatic (ring-like) and 15% aliphatic (chain-like), but Dartois et al. (2004) claim that aliphatic material predominates, with at most 15% of the carbon in aromatic form. To explore the effect of material that is strongly absorptive in the visible, we use the dielectric tensor of graphite for the carbon in our mixed-composition aggregates.
In the present paper we study the scattering properties of aggregates with two compositions: 100% silicate, or 50% silicate + 50% graphite (volume fractions). In Paper I we found that aggregates consisting of 50% silicate + 50% AC1 amorphous carbon had scattering properties intermediate between the 100% silicate and 50% silicate + 50% graphite aggregates.
Calculations are performed using DDSCAT version 7.0 (Draine & Flatau, 2008). DDSCAT is a code based on the discrete dipole approximation (Purcell & Pennypacker, 1973; Draine & Flatau, 1994), designed to compute scattering and absorption of electromagnetic waves by targets with arbitrary geometry and composition, for targets that are not too large compared to the wavelength . For each cluster type (defined by , aggregation rule, and composition) we generally average over three random realizations and 54 orientations for each realization.222 9 values of the angle between the cluster principal axis and (the direction of the incident light), and 6 values of the rotation angle of the cluster around . We use a single value of the rotation angle of around because we average over 4 scattering planes. DDSCAT 7.0 allows us to treat the graphite monomers as randomly-oriented spheres with the anisotropic dielectric tensor of graphite.
3. Scattering Phase Function and Polarization
The phase function and linear polarization of the scattered light as functions of scattering angle can be retrieved from the elements of the Muller matrix (e.g., Bohren & Huffman, 1983). For unpolarized incident light, the scattered light phase function is proportional to (where is the differential scattering cross section for unpolarized incident light) and the linear polarization parameter is . By definition, the polarization is perpendicular/parallel to the scattering plane when is positive/negative.
We have obtained and for our realization- and orientation-averaged aggregates for wavelengths . For illustrative purposes, in most cases we will present the results for the BAM2 aggregates – the aggregate geometry with the lowest porosity. Orientation-averaged scattering properties for the clusters studied in this paper (including wavelengths not shown in the figures) are available online.333 http://www.astro.princeton.edu/draine/SDJ09.html
3.1. Wavelength Dependence
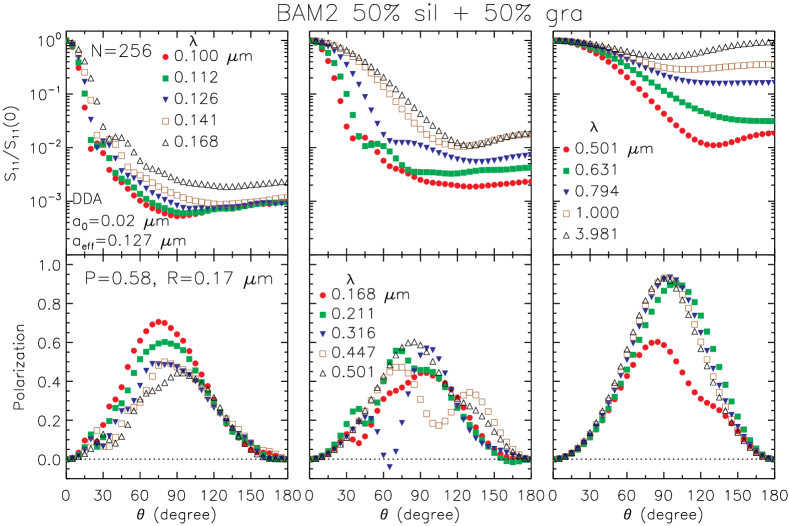
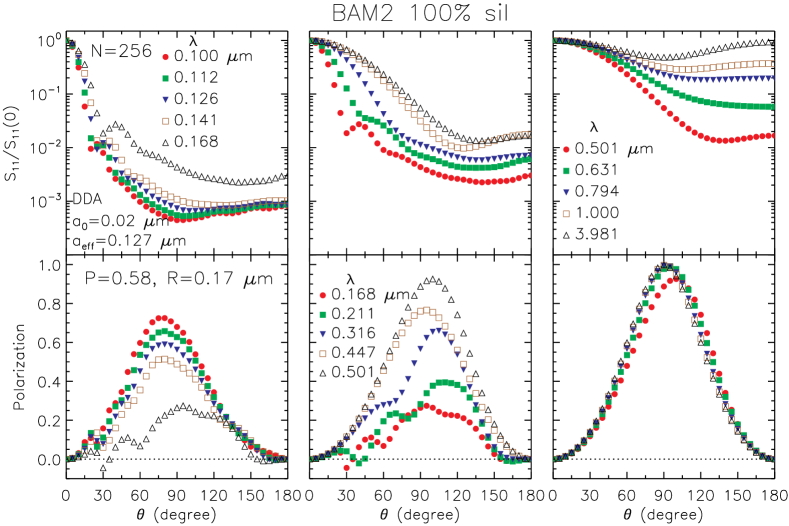
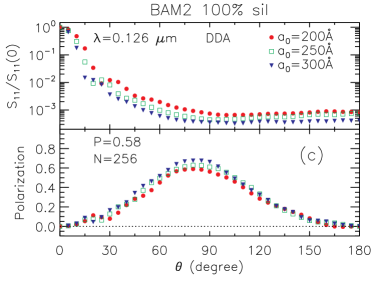
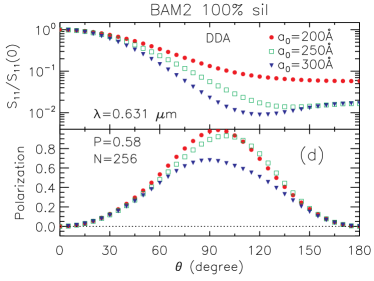
We first show the wavelength dependence of and linear polarization for -monomer BAM2 clusters with monomer radius in Figure 1, for selected wavelengths. For the BAM2 case, m, the porosity (see Table 1), and the characteristic radius . The phase function shows a relatively smooth dependence on wavelength : for (), it shows a strong peak in the forward scattering and a mild backscattering enhancement, with the overall forward-backward asymmetry decreasing monotonically as the incident wavelength increases. For linear polarization, the situation is more complicated. The polarization near first decreases as increases, reaches a minimum at , and then rises again with increasing , approaching in the Rayleigh limit. The wavelength where is minimum is well-defined for the pure silicate, with . For the graphite-silicate composition it is less well-defined, with minima near and . The increase of polarization with increasing wavelength in the optical band is known as the polarization color effect in cometary scattered light observations (e.g., Chernova et al., 1996; Levasseur-Regourd & Hadancik, 2001). The reverse behavior of increasing polarization with decreasing wavelength in the UV band, however, is more complicated to interpret. It could be caused by the change in the size parameter , or changes in the dielectric function as varies, or both. We will return to this point in §3.3.
It was shown in Paper I that the EMT-Mie model provides a good approximation for the total extinction cross section as a function of , provided that the vacuum fraction is set to . We now test to see if the EMT-Mie model reproduces the scattering phase function and polarization . For the EMT-Mie calculations we use an optimal value of vacuum fraction and the same amount of solid material as in the BAM2 clusters. For the effective dielectric permittivity we use the Bruggeman rule (see Bohren & Huffman, 1983)
| (2) |
where and are the volume fraction and dielectric permittivity of each composition, including vacuum. There is always only one solution of that is physically meaningful. For graphite, we make the usual approximation, and take for , for .
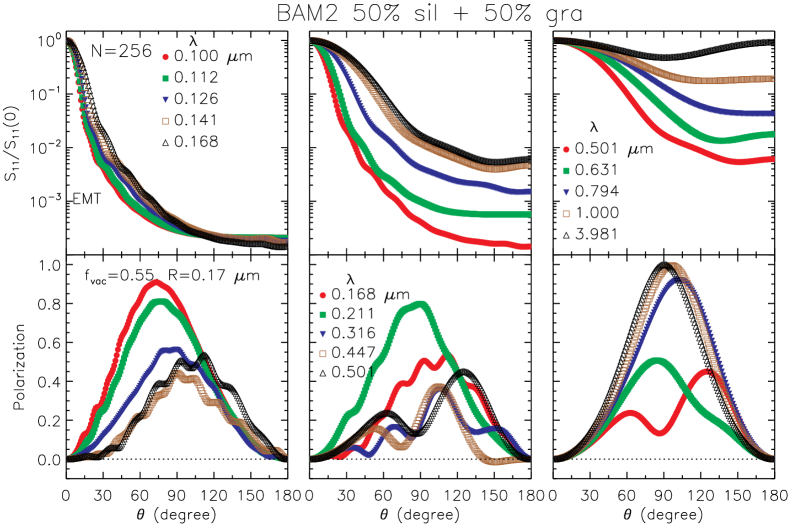
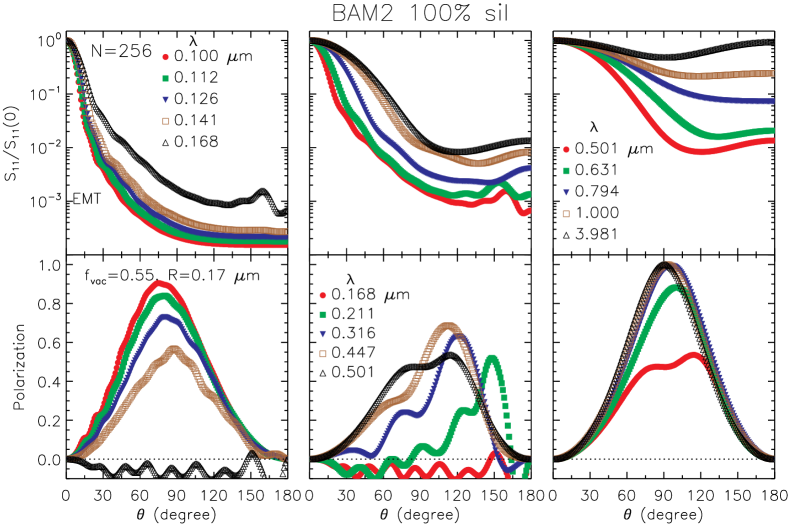
The EMT-Mie results are shown in Fig. 2 for the silicate-graphite and the pure silicate cases, in parallel to Fig. 1. The EMT calculations at fixed wavelength show resonances that arise from the use of spheres, but these should be smoothed out when modeling nonspherical particles, which are randomly-oriented and will not show such well-defined resonances. Therefore we have smoothed the EMT results using a Gaussian kernel
| (3) |
where and is the radius of the Mie sphere. The phase function and polarization are then computed using the smoothed .
By directly comparing Fig. 1 and Fig. 2 it is evident that the EMT-Mie results for and linear polarization do share the same trends we see in the DDA calculations. Nevertheless, there are substantial differences between the EMT-Mie results and our DDA results. One obvious feature is that the EMT-Mie model tends to underestimate the backscattering for short wavelength (, ), a feature already revealed by the behavior of the asymmetry parameter discussed in Paper I (fig. 12). For example, consider the forward-backward asymmetry for : the DDA calculations for the mixed graphite-silicate BAM2 cluster give , while the EMT-Mie calculation gives .
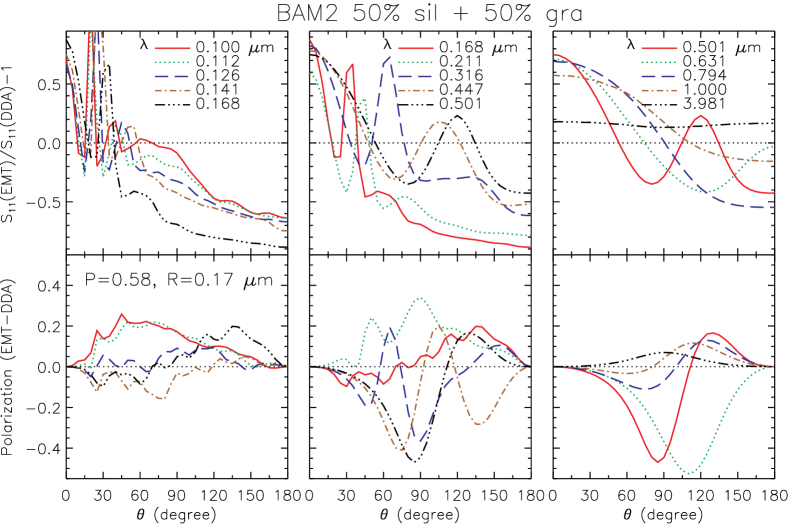
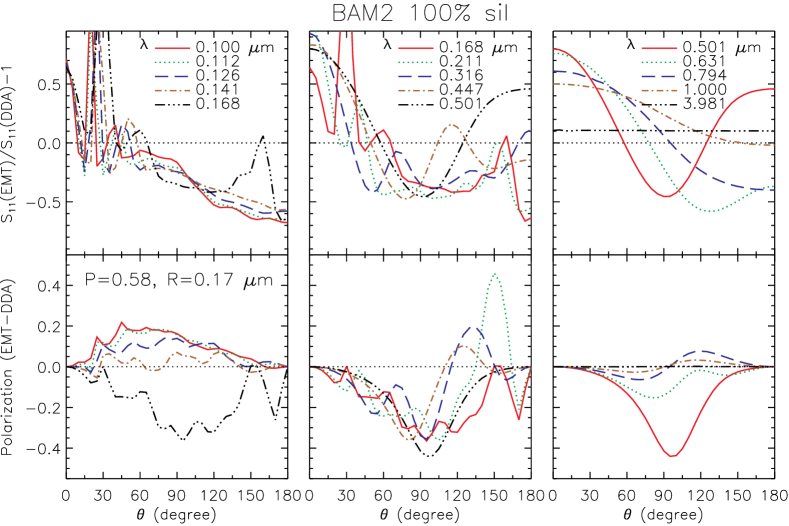
To compare the EMT-Mie results and our DDA calculations in detail we plot the relative differences in Fig. 3, for the silicate plus graphite case (upper) and the pure silicate case (bottom). The difference can be substantial for specific wavelengths or scattering angles. For example, for scattering at , the EMT-Mie calculation underestimates the polarization by a factor , for both the graphite-silicate clusters and the pure silicate clusters. Although Paper I showed that EMT-Mie calculations can be used to obtain moderately accurate total extinction and scattering cross sections, Figure 3 shows that the scattering phase function and polarization estimated using EMT-Mie calculations do not accurately reproduce the scattering properties of irregular clusters.
3.2. Does Monomer Size Matter?
There is another parameter that might affect and polarization: the monomer size. There have been claims that large monomer size is crucial in decreasing the polarization and in producing the negative polarization branch observed in cometary dust (e.g., Petrova et al., 2000; Bertini et al., 2007). However, in these previous studies, variations of monomer size were always coupled with changes in porosity and cluster size , hence effects attributed to varying the monomer size may in fact be due to variations in or . We have already seen in Paper I that the apparent effects of monomer size on total cross sections are essentially the effects of varying or .
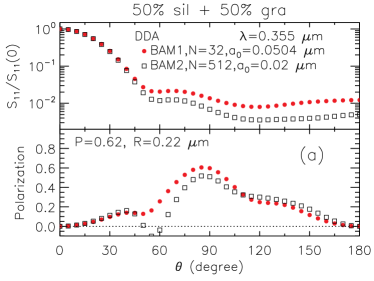
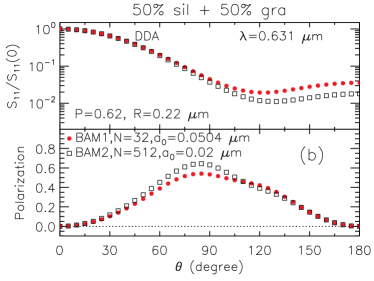
To isolate the effect of monomer size, we compare clusters with the same and very similar (thus is also comparable), but different monomer size . Thus the effect of monomer size, if there is any, is decoupled from other effects. We first consider the same example used in figure 8 of Paper I: the BAM1 cluster realization BAM1.32.4 (, ) with monomer size and the BAM2 cluster realization BAM2.512.14 (, ) with . Both clusters have and . The orientation-averaged results are shown in Fig. 4a,b for two wavelengths and for the silicate-graphite composition only. Although there are slight differences, the two cases have similar phase functions and polarizations: at constant and , varying the monomer size had little effect on the phase function and polarization.
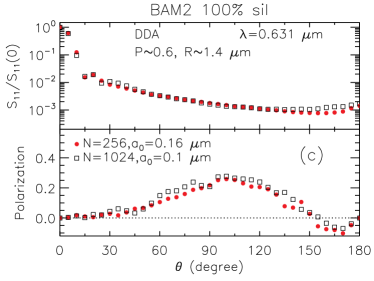
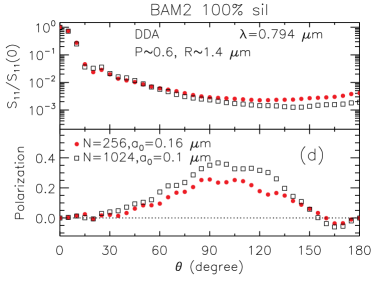
The above example employed moderate-sized clusters () composed of small monomers (). Fig. 4c,d compares the scattering properties of 2 large clusters (, and ) with similar porosities but different monomer sizes. For and , clusters with and show similar (though not identical because of the slight difference in porosity of the two clusters; see §3.4) polarization , despite the substantial difference in monomer size.
3.3. Dependence on Cluster Size
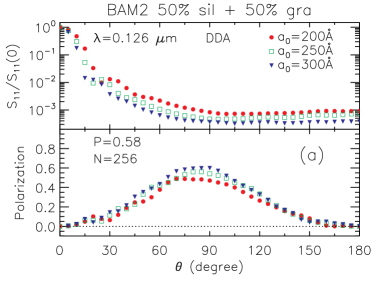
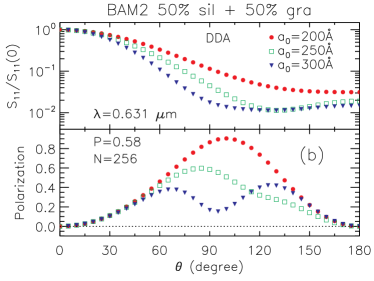
As we have discussed in §3.1 for fixed-size clusters, the dependence of the phase function and linear polarization on wavelength is likely caused by the changes in both the size parameter and dielectric function. To investigate the effects of cluster size at fixed incident wavelength (i.e., the effects of size parameter alone), we use , BAM2 clusters with monomer size , or . These clusters have the same porosity, and as argued in the previous section, monomer size has negligible effects, hence any difference must be caused by changes in . The results are shown in Fig. 5 for both compositions. We present results at two wavelengths: () and (). In both cases the backward/forward scattering asymmetry increases with increasing the size parameter .
In general, we expect in the Rayleigh scattering limit , with the peak polarization decreasing with increasing . This decline with increasing is seen in Figure 5b,d. However, the results in Figure 5a,c show that the variation of with increasing is not monotonic: at when and when the dielectric function is very absorptive, for both the 100% silicate and 50% silicate + 50% graphite BAM2 clusters, the polarization is an increasing function of over the range . Thus for these cases the polarization at has a minimum at some size .
However, the dependence of polarization on depends on the dielectric function (and therefore on both composition and wavelength). For the 100% silicate BAM2 clusters with have the polarization declining with increasing out to (the largest value computed, see §4.2 and Figs. 7d and 8) – without showing a reversal in the polarization behavior. The situation is even more complicated for the silicate plus graphite case, where there is no coherent trend when (see Figs. 1a, 7a and 7b). Based on the cases investigated thus far, it appears that when the dielectric function has only weak absorption (e.g., 100% astrosilicate at ), for fixed porosity the polarization is a monotonically decreasing function of cluster size from the Rayleigh limit up to . On the other hand, when the dielectric function is strongly absorptive (e.g., materials at or silicate-graphite clusters at ), for fixed porosity the polarization declines with increasing from the Rayleigh limit until it reaches a local minimum at (the transition is less distinct for the silicate-graphite case than for the pure silicate case), and then rises as is further increased, at least out to (e.g., Figs. 5a and 7a,b).
3.4. Dependence on Porosity
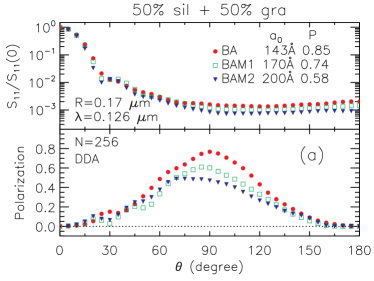
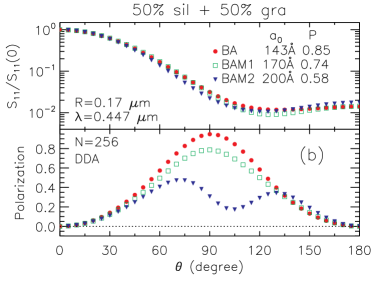
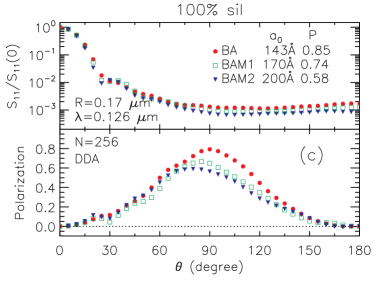
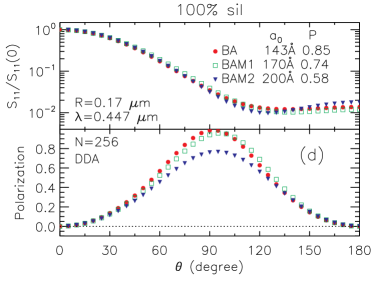
We now investigate the effect of porosity on the scattering phase function and linear polarization. Previous studies on the porosity effect using only the BPCA and/or the even more porous “ballistic cluster-cluster agglomeration (BCCA)” clusters were quite limited in the dynamical range of porosity, and changes in porosity were coupled with changes in cluster size. To decouple from the cluster size effect we choose clusters with comparable sizes, but different porosities. We use BA, BAM1 and BAM2 clusters, with monomer size Å respectively; hence these clusters have comparable size , but different porosities .
We consider two regimes: and . The results are shown in Fig. 6 for two example wavelengths, and , and for the two compositions. It is evident that in both regimes, porosity has little effect on the shape of the phase function444The slight difference in is likely caused by the different geometry of the BA, BAM1 and BAM2 clusters.. On the other hand, higher porosity tends to increase the linear polarization for both and .
Most of the cases shown in this section have large linear polarization fraction []. Cometary dust typically has and a negative branch of polarization at scattering angle (e.g., Levasseur-Regourd & Hadancik, 2001), observed at optical wavelengths. From the results of §3.1-§3.4 we expect that, in general, a reduced peak polarization and appearance of a negative polarization branch for can be obtained by (1) increasing the cluster size and (2) making the cluster more compact (lower porosity ). Examples of ballistic aggregates that are able to reproduce these cometary dust features will be presented in §4.2.
4. Applications of Ballistic Aggregates
The light scattering properties of our ballistic aggregates can be applied to various observations. Here we focus on debris disks and cometary dust, where single scattering dominates in the optically thin regime. We show examples of aggregates that can reproduce qualitative and quantitative features observed in the scattered light from the debris disk around AU Mic (Graham et al., 2007) and from cometary dust (e.g., Lumme & Rahola, 1994; Petrova et al., 2000; Kimura et al., 2006; Lasue et al., 2009). Due to computational limits, we cannot probe a sufficiently large parameter space to claim that our models are unique; nor do we attempt to fit a sophisticated model to the observations of a specific comet. Nevertheless, our examples (in particular the moderate-porosity BAM2 clusters) nicely reproduce most of the features observed in light scattered by debris-disk dust and cometary dust.
4.1. Debris disk around AU Mic
Polarization maps of the debris disk surrounding the nearby M star AU Microscopii have been obtained by Graham et al. (2007) using HST ACS in the F606W optical band (). The scattered light is polarized perpendicular to the disk plane. Graham et al. (2007) adopted the form for the phase function introduced by Henyey & Greenstein (1940):
| (4) |
assumed that the polarization vs. scattering angle varies as
| (5) |
and simultaneously fitted the phase function and linear polarization as function of scattering angle to the observational data, obtaining and . Graham et al. (2007) suggest that very porous () -sized spherical grains or aggregates can produce these features based on Mie theory and DDA calculations for BA clusters (Kimura et al., 2006).
Here we will show that random aggregates with a much lower porosity () can, in fact, better fit the observations of the AU Mic debris disk. To reproduce the observed features, we require that the phase function and linear polarization are both close to the functions (4) and (5) with the the best-fit values of and found by Graham et al. (2007). In particular, the intensity of scattered light at should be approximately a factor of 150 larger than the intensity at , and the maximum polarization should be , although need not necessarily peak at .
Dust grains in debris disks will have a distribution of sizes. Much of the interstellar grain mass can be approximated by a power-law size distribution for with (Mathis et al., 1977). Size distributions with can be obtained from models with coagulation and collisional fragmentation (Dohnanyi, 1969; Tanaka et al., 1996; Weidenschilling, 1997).
For modeling comets and debris disks, we will consider a size distribution . For a fixed porosity (i.e., a particular type of aggregate with a fixed ), this size distribution is just , where is the monomer size. Hence the averaged phase function and polarization are:
| (6) | |||
| (7) |
where and are the minimum and maximum values of monomer size in our size distribution.
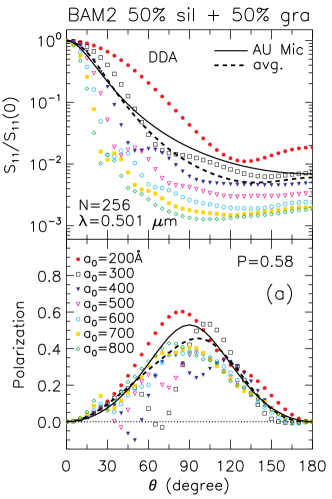
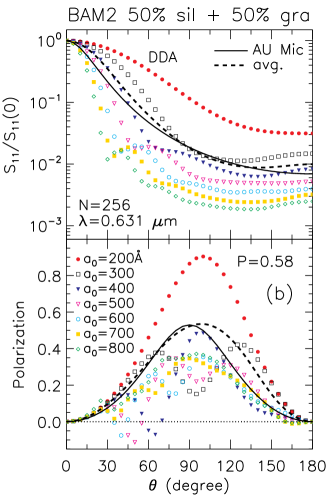
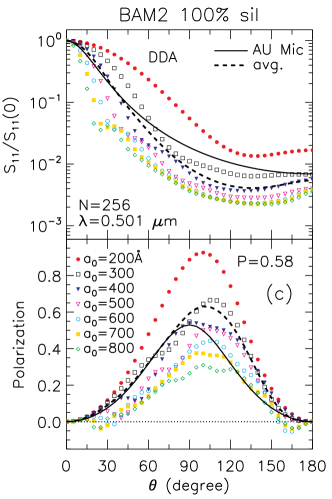
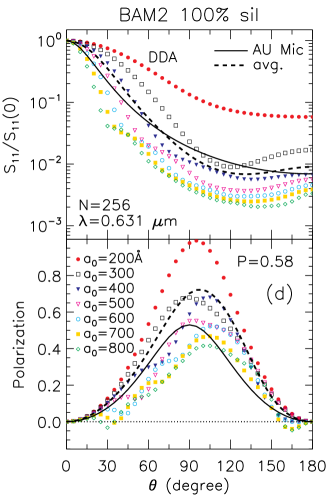
We consider BAM2 clusters (), with , which correspond to . We show the calculated phase function and polarization for each of these clusters (averaged over orientations and 3 realizations) in Fig. 7, at two wavelengths and . For comparison with the scattering properties inferred for the dust around AU Mic, we calculate and polarization averaged over a size distribution with and (, ), which are shown as dashed lines. The best-fit Henyey-Greenstein phase function (4) and polarization fitting function (5) from Graham et al. (2007) are shown as solid black lines. We plot the comparison for both the silicate-graphite composition (upper panels) and the pure silicate composition (bottom panels).
As we can see from Fig. 7, the size-averaged silicate-graphite clusters produce close matches to the Henyey-Greenstein model at these optical wavelengths for both the phase function and linear polarization. These clusters have porosity and overall size , i.e., they are sub--sized clusters with moderate porosity.
As discussed in §3.4, increasing porosity will increase the polarization of scattered light. Our highest-porosity clusters are those BA clusters, which are commonly used in the literature, referred to as “ballistic particle-cluster agglomeration (BPCA)” clusters (e.g., West, 1991; Kozasa et al., 1992, 1993; Ossenkopf, 1993; Kimura et al., 2006; Bertini et al., 2007; Lasue et al., 2009). We found that if we replace the BAM2 clusters in Fig. 7 with BA clusters with the same number of monomers and monomer sizes, we can reproduce similar phase function features but over-predict the polarization. This is already seen in Graham et al. (2007) (e.g., their fig. 8). Thus we conclude that compact BAM2 clusters fit the observations of AU Mic better than the more porous BA clusters that have been considered previously.
4.2. Cometary Dust
The phase function and linear polarization of scattered light have been observed in a variety of comets. Though different comets show quantitative differences in the phase function and polarization, there are some common features:
-
•
The phase function shows strong forward scattering with a weak enhancement in the backscattering; the geometric albedo [defined as where is the averaged geometric cross section of the grain] of backscattered light is less than 0.06 (e.g., Hanner & Newburn, 1989).
-
•
The linear polarization is a bell-shaped curve as function of scattering angle, with typical maximum value of (Dobrovolsky et al., 1986; Levasseur-Regourd et al., 1996), although gas contamination in polarimetric measurements with wide-band filters might depolarize the observed scattered light (Kiselev et al., 2004).
- •
- •
Most of these features, in particular the negative polarization branch, have been successfully reproduced using various aggregates which differ in geometry, composition and porosity (e.g., Lumme & Rahola, 1994; Petrova et al., 2000; Kimura et al., 2006; Bertini et al., 2007; Lasue et al., 2009). The aggregates studied here are capable of producing all these features as well. In addition, we have demonstrated the effects of grain size and porosity, and pointed out that the monomer size effect claimed by previous authors is in fact due to changes in cluster size and/or porosity . For example, in Petrova et al. (2000) and Bertini et al. (2007), the difference of the prominence of the negative branch is caused by the effect of grain size when they increase the monomer size for the same configuration/porosity.
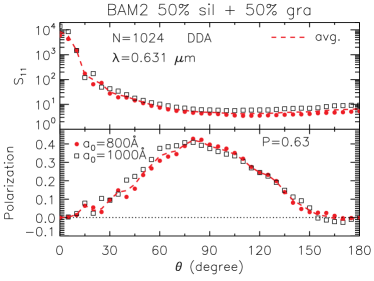
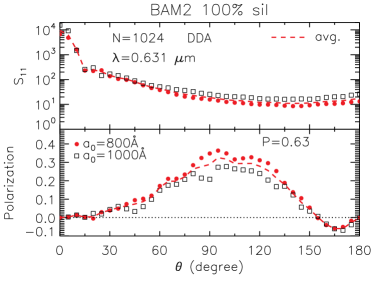
The reason that those authors did not find a negative branch of polarization for small monomer size () and moderate number of monomers (a few tens) is that computational limits prevented them from using a sufficient number of monomers. To test this, we have computed a few realizations of BAM2 clusters with , composed of small monomers (). The results are shown in Fig. 8 for optical wavelength , where the negative branch is evident for both compositions (it is more prominent at the usually observed red band ). In Fig. 8, we have also computed for the BAM2 clusters using monomer size , shown as open squares; the dashed lines are the average of the results of the two monomer sizes, for a size distribution running from to .
These clusters are -size grains, which is consistent with the values found by other authors (e.g., Lumme & Rahola, 1994; Petrova et al., 2000; Kimura et al., 2006), although the exact values depend on composition as well as porosity. We find that the , BAM2 clusters composed of silicate and graphite (Fig. 8a) with and , reproduce a backscattering albedo and a small negative polarization for scattering angles 155 – 180∘ peaking at (), representative of the typical values found in cometary observations, although the maximum polarization () is a little higher than observed. We may need somewhat more compact aggregates, or different composition (e.g., more silicate, see the right panel of Fig. 8) to lower the peak polarization. Alternatively, one may consider the mixture of fluffy aggregates and compact solid grains (e.g., Lasue et al., 2009). In their study, a larger fraction of porous BCCA aggregates is needed to produce a higher peak polarization for comet C/1995 O1 Hale-Bopp than for comet 1P/Halley, consistent with our argument that high porosity helps increase the polarization. Since only very porous BCCA clusters were used in their modeling, it will be interesting to see if our more compact BAM1 and BAM2 clusters will provide better fits for these comets in modeling the mixture of fluffy aggregates and compact solid grains.
5. Conclusions
We have studied the phase function and linear polarization properties of light scattering by ballistic aggregates. We studied the wavelength dependence, cluster size dependence, and porosity dependence of the light scattering properties using the discrete-dipole-approximation, and compared with the EMT-Mie model. Our main conclusions are:
-
1.
It is shown that though the EMT-Mie model reproduces similar trends in these dependences, it differs quantitatively from the DDA calculations. We recommend using DDA calculations if accurate results are desired.
-
2.
Monomer size has negligible effects on the scattered light properties as long as monomers are small compared with the incident wavelength . Even when the monomers are no longer small (e.g., ), monomer size appears to be of secondary importance for the phase function and polarization .
-
3.
The phase function is mainly determined by ; increasing decreases the backscattering relative to forward scattering.
-
4.
When (e.g., in the Rayleigh limit), increasing decreases the polarization. For , the dependence of polarization on depends on the dielectric function: for materials that are not strongly absorbing, increasing results in decreasing polarization, at least for (e.g., Figure 7c,d, showing 100% silicate BAM2 clusters at and ); however, at vacuum UV wavelengths where the materials are strongly absorbing, increasing can increase the polarization (e.g., Figure 5a,c, showing scattering at ).
-
5.
The degree of polarization depends on the size parameter as well as porosity, but high porosity helps increase polarization in both the and regimes.
-
6.
We present aggregates with BAM2 geometry, moderate porosity , and sub- sizes which can reproduce the scattered light phase function and polarization observed in the AU Mic debris disk.
-
7.
We present aggregate models with BAM2 geometry and moderate porosity that can reproduce the albedo and polarization observed for cometary dust, including the negative polarization observed at scattering angles . These aggregates are composed of silicate and graphite, and are of size. Such moderately porous aggregates are promising candidates for cometary dust.
References
- Bertini et al. (2007) Bertini, I., Thomas, N., & Barbieri, C. 2007, A&A, 461, 351
- Blum & Wurm (2000) Blum, J., & Wurm, G. 2000, Icarus, 143, 138
- Bohren & Huffman (1983) Bohren, C. F., & Huffman, D. R. 1983, Absorption and Scattering of Light by Small Particles (New York: Wiley)
- Brownlee (1985) Brownlee, D. E. 1985, Annual Review of Earth and Planetary Sciences, 13, 147
- Chernova et al. (1996) Chernova, G. P., Jockers, K., & Kiselev, N. N. 1996, Icarus, 121, 38
- Dartois et al. (2004) Dartois, E., Muñoz Caro, G. M., Deboffle, D., & d’Hendecourt, L. 2004, A&A, 423, L33
- Dobrovolsky et al. (1986) Dobrovolsky, O. V., Kiselev, N. N., & Chernova, G. P. 1986, Earth Moon and Planets, 34, 189
- Dohnanyi (1969) Dohnanyi, J. W. 1969, J. Geophys. Res., 74, 2531
- Dollfus et al. (1988) Dollfus, A., Bastien, P., Le Borgne, J.-F., Levasseur-Regourd, A. C., & Mukai, T. 1988, A&A, 206, 348
- Dorschner & Henning (1995) Dorschner, J., & Henning, T. 1995, A&A Rev., 6, 271
- Draine (2003) Draine, B. T. 2003, ApJ, 598, 1017
- Draine & Flatau (1994) Draine, B. T., & Flatau, P. 1994, \josaa, 11, 1491
- Draine & Flatau (2008) —. 2008, http://arXiv.org/abs/astro-ph/0809.0337
- Draine & Lee (1984) Draine, B. T., & Lee, H. M. 1984, ApJ, 285, 89
- Eaton et al. (1992) Eaton, N., Scarrott, S. M., & Gledhill, T. M. 1992, MNRAS, 258, 384
- Graham et al. (2007) Graham, J. R., Kalas, P. G., & Matthews, B. C. 2007, ApJ, 654, 595
- Hanner & Newburn (1989) Hanner, M. S., & Newburn, R. L. 1989, AJ, 97, 254
- Henyey & Greenstein (1940) Henyey, L. G., & Greenstein, J. L. 1940, Annales d’Astrophysique, 3, 117
- Kimura et al. (2006) Kimura, H., Kolokolova, L., & Mann, I. 2006, A&A, 449, 1243
- Kiselev et al. (2004) Kiselev, N. N., Jockers, K., & Bonev, T. 2004, Icarus, 168, 385
- Kozasa et al. (1992) Kozasa, T., Blum, J., & Mukai, T. 1992, A&A, 263, 423
- Kozasa et al. (1993) Kozasa, T., Blum, J., Okamoto, H., & Mukai, T. 1993, A&A, 276, 278
- Krause & Blum (2004) Krause, M., & Blum, J. 2004, Phys. Rev. Lett., 93, 021103
- Lasue et al. (2009) Lasue, J., Levasseur-Regourd, A. C., Hadamcik, E., & Alcouffe, G. 2009, Icarus, 199, 129
- Levasseur-Regourd et al. (1996) Levasseur-Regourd, A. C., Hadamcik, E., & Renard, J. B. 1996, A&A, 313, 327
- Levasseur-Regourd & Hadancik (2001) Levasseur-Regourd, A. C., & Hadancik, E. 2001, in ESA SP-495: Meteoroids 2001 Conference, ed. B. Warmbein, 587–594
- Lumme & Rahola (1994) Lumme, K., & Rahola, J. 1994, ApJ, 425, 653
- Mackowski (1991) Mackowski, D. W. 1991, Proc. Royal Soc. London Ser A, 433, 599
- Mathis et al. (1977) Mathis, J. S., Rumpl, W., & Nordsieck, K. H. 1977, ApJ, 217, 425
- Mathis & Whiffen (1989) Mathis, J. S., & Whiffen, G. 1989, ApJ, 341, 808
- Ossenkopf (1993) Ossenkopf, V. 1993, A&A, 280, 617
- Pendleton & Allamandola (2002) Pendleton, Y. J., & Allamandola, L. J. 2002, ApJS, 138, 75
- Petrova et al. (2000) Petrova, E. V., Jockers, K., & Kiselev, N. N. 2000, Icarus, 148, 526
- Purcell & Pennypacker (1973) Purcell, E. M., & Pennypacker, C. R. 1973, ApJ, 186, 705
- Rouleau & Martin (1991) Rouleau, F., & Martin, P. G. 1991, ApJ, 377, 526
- Shen et al. (2008) Shen, Y., Draine, B. T., & Johnson, E. T. 2008, ApJ, 689, 260
- Tanaka et al. (1996) Tanaka, H., Inaba, S., & Nakazawa, K. 1996, Icarus, 123, 450
- Warren et al. (1994) Warren, J. L., Barrett, R. A., Dodson, A. L., Watts, L. A., & Zolensky, M. E. 1994, Cosmic Dust Catalog, 14
- Weidenschilling (1997) Weidenschilling, S. J. 1997, Icarus, 127, 290
- West (1991) West, R. A. 1991, Appl. Opt., 30, 5316
- Wurm & Blum (1998) Wurm, G., & Blum, J. 1998, Icarus, 132, 125
- Xu (1997) Xu, Y.-L. 1997, Appl. Opt., 36, 9496