H.E.S.S. observations of -ray bursts in 2003–2007
Abstract
Aims. Very-high-energy (VHE; 100 GeV) -rays are expected from -ray bursts (GRBs) in some scenarios. Exploring this photon energy regime is necessary for understanding the energetics and properties of GRBs.
Methods. GRBs have been one of the prime targets for the H.E.S.S. experiment, which makes use of four Imaging Atmospheric Cherenkov Telescopes (IACTs) to detect VHE -rays. Dedicated observations of 32 GRB positions were made in the years 2003–2007 and a search for VHE -ray counterparts of these GRBs was made. Depending on the visibility and observing conditions, the observations mostly start minutes to hours after the burst and typically last two hours.
Results. Results from observations of 22 GRB positions are presented and evidence of a VHE signal was found neither in observations of any individual GRBs, nor from stacking data from subsets of GRBs with higher expected VHE flux according to a model-independent ranking scheme. Upper limits for the VHE -ray flux from the GRB positions were derived. For those GRBs with measured redshifts, differential upper limits at the energy threshold after correcting for absorption due to extra-galactic background light are also presented.
Key Words.:
gamma rays: bursts – gamma rays: observations1 Introduction
Gamma-ray bursts (GRBs) are the most energetic events in the -ray regime. Depending on their duration (e.g. ), GRBs are categorized into long GRBs ( s) and short GRBs ( s). First detected in late 1960s (Klebesadel et al., 1973), GRBs remained mysterious for three decades. Breakthroughs in understanding GRBs came only after the discovery of longer-wavelength afterglows with the launch of BeppoSAX in 1997 (van Paradijs et al., 2000). Multi-wavelength (MWL) observations have proved to be crucial in our understanding of GRBs, and provide valuable information about their physical properties. These MWL afterglow observations are generally explained by synchrotron emission from shocked electrons in the relativistic fireball model (Piran, 1999; Zhang & Mészáros, 2004). A plateau phase is revealed in many of the Swift/XRT light curves, the origin of which is still not clear (Zhang et al., 2006). Observations of GRBs at energies 10 GeV may test some of the ideas that have been suggested to explain the X-ray observations (Fan et al., 2008).
In the framework of the relativistic fireball model, photons with energies up to 10 TeV or higher are expected from the GRB afterglow phase (Zhang & Mészáros, 2004; Fan & Piran, 2008). Possible leptonic radiation mechanisms include forward-shocked electrons up-scattering self-emitted synchrotron photons (SSC processes; Dermer et al., 2000; Zhang & Mészáros, 2001; Fan et al., 2008) or photons from other shocked regions (Wang et al., 2001). Physical parameters, such as the ambient density of the surrounding material (), magnetic field equipartition fraction (), and bulk Lorentz factor () of the outflow, may be constrained by observations at these energies (Wang et al., 2001; Pe’er & Waxman, 2005).
A possible additional contribution to VHE emission relates to the X-ray flare phenomenon. X-ray flares are found in more than 50% of the Swift GRBs during the afterglow phase (Chincarini et al., 2007). The energy fluence of some of them (e.g. GRB 050502B) is comparable to that of the prompt emission. Most of them are clustered at 102–103s after the GRB (see Figure 2 in Chincarini et al., 2007), while late X-ray flares (104s) are also observed; when these happen they can cause an increase in the X-ray flux of an order of magnitude or more over the power-law temporal decay (Curran et al., 2008). The cause of X-ray flares is still a subject of debate, but corresponding VHE -ray flares from inverse-Compton (IC) processes are predicted (Wang et al., 2006; Galli & Piro, 2007; Fan et al., 2008). The accompanying external-Compton flare may be weak if the flare originated behind the external shock, e.g. from prolonged central engine activity (Fan et al., 2008). However, in the external shock model, the expected SSC flare is very strong at GeV energies and can be readily detected using a VHE instrument with an energy threshold of 100 GeV (Galli & Piro, 2008), such as the H.E.S.S. array, for a typical GRB at z1. Therefore, VHE -ray data taken during an X-ray flare may help for distinguishing the internal/external shock origin of the X-ray flares, and may be used as a diagnostic tool for the late central engine activity.
Waxman & Bahcall (2000) and Murase et al. (2008) suggest that GRBs may be sources of ultra-high-energy cosmic rays (UHECRs). In this case, -decays from proton- interaction may generate VHE emission. The VHE -ray emission produced from such a hadronic component is generally expected to decay more slowly than the leptonic sub-MeV radiation (Böttcher & Dermer, 1998). Dermer (2007) suggests a combined leptonic/hadronic scenario to explain the rapidly-decaying phase and plateau phase seen in many of the Swift/XRT light curves. This model can be tested with VHE observations taken minutes to hours after the burst.
Most searches for VHE -rays from GRBs have obtained negative results (Connaughton et al., 1997; Atkins et al., 2005). There may be indications of excess photon events from some observations, but these results are not conclusive (Amenomori et al., 1996; Padilla et al., 1998; Atkins et al., 2000; Poirier et al., 2003). Currently, the most sensitive detectors in the VHE -ray regime are IACTs. Horan et al. (2007) presented upper limits from 7 GRBs observed with the Whipple Telescope during the pre-Swift era. Upper limits for 9 GRBs with redshifts that were either unknown or 3.5 were also reported by the MAGIC collaboration (Albert et al., 2007). In general, these limits do not violate a power-law extrapolation of the keV spectra obtained with satellite-based instruments. However, most GRBs are now believed to originate at cosmological distances, therefore absorption of VHE -rays by the EBL (Nikishov, 1962) must be considered when interpreting these limits.
In this paper, observations of 22 -ray bursts made with H.E.S.S. during the years 2003–2007 are reported. They represent the largest sample of GRB afterglow observations made by an IACT array and result in the most stringent upper limits obtained in the VHE band. The prompt phase of GRB 060602B was observed serendipitously with H.E.S.S. The results of observations before, during, and after this burst are presented in Aharonian et al. (2009).
2 The H.E.S.S. experiment and GRB observation strategy
The H.E.S.S. array111http://www.mpi-hd.mpg.de/hfm/HESS/HESS.html is a system of four 13m-diameter IACTs located at 1 800 m above sea level in the Khomas Highland of Namibia ( S, E). Each of the four telescopes is located at a corner of a square with a side length of 120 m. This configuration was optimized for maximum sensitivity to 100 GeV photons. The effective collection area increases from 10 at 100 GeV to more than at 1 TeV for observations at a zenith angle (Z.A.) of 20. The system has a point source sensitivity above 100 GeV of 1.410 ( of the flux from the Crab nebula) for a detection in a 2 h observation. Each H.E.S.S. camera consists of 960 photomultiplier tubes (PMTs), which in total provide a field of view (FoV) of 5. This relatively large FoV allows for the simultaneous determination of the background events from off-source positions, so that no dedicated off run is needed (Aharonian et al., 2006c). The slew rate of the array is 100 per minute, enabling it to point to any sky position within 2 minutes. The H.E.S.S. array is currently the only IACT array in the Southern Hemisphere used for an active GRB observing programme222http://www.lsw.uni-heidelberg.de/projects/hess/HESS/grbs.phtml.
The trigger system of the H.E.S.S. array is described in Funk et al. (2004). The stereoscopic technique is used, i.e. a coincidence of at least two telescopes triggering within a window of (normally) 80 nanoseconds is required. This largely rejects background events caused by local muons that trigger only a single telescope.
The observations reported here were obtained over the period March 2003 to October 2007. The observations of two GRBs in 2003 were made using two telescopes while the system was under construction. Before 2003 July, each of the two telescopes took data separately. Stereo analysis was then performed on the data, which requires coincidence of events to be determined offline using GPS time stamps. After the installation of the central trigger system in 2003 July, the stereo multiplicity requirement was determined on-line. All observations since 2004 have made use of the completed four-telescope array and the stereo technique (Aharonian et al., 2006c).
Most of the data were taken in 28 minute runs using wobble mode, i.e. the GRB position is placed at an offset, , of or (in R.A. and Decl.) relative to the centre of the camera FoV during observations.
Onboard GRB triggers distributed by the Swift satellite, as well as triggers from INTEGRAL and HETE-II confirmed by ground-based analysis, are followed by H.E.S.S. observations. Upon the reception of a GCN333The Gamma ray bursts Coordinates Network, http://gcn.gsfc.nasa.gov/ notice from one of these satellites (with appropriate indications444which include, e.g., burst position incompatible with known sources, and a high signal-to-noise ratio of the burst that the source is a genuine GRB), the burst position is observed if Z.A.45 (to ensure a reasonably low-energy threshold) during H.E.S.S. dark time555H.E.S.S. observations are taken in darkness and when the moon is below the horizon. The fraction of H.E.S.S. dark time is about 0.2. An automated program is running on site to keep the shift crew alerted of any new detected GRBs in real time. Depending on the observational constraints and the measured redshifts of the GRBs reported through GCN circulars666http://gcn.gsfc.nasa.gov/gcn3_archive.html, observations of the burst positions are started up to 24 hours after the burst time, typically with an exposure time of 120 minutes in wobble mode. The remarkably nearby, bright GRB 030329 was an exceptional case. It was not observed until 11.5 days after the burst because of poor weather, which prohibited observation any earlier.
3 The GRB observations
Thirty-two GRBs were observed with H.E.S.S. during the period from March 2003 to October 2007. After applying a set of data-quality criteria that rejects observation runs with non-optimal weather conditions and hardware status, 22 GRB observations were selected for analysis and are described in this section.
| GRB | Satellite | Trigger | R.A.777R.A., Decl., and the positional errors (90% containment) were taken from GCN Reports (http://gcn.gsfc.nasa.gov/report_archive.html) for GRB 061110A – GRB 071003 and GCN Circulars otherwise. | Decl.a | Errora | Energy band | Fluence888Fluence and data for GRB 050726 – GRB 070612B were taken from Sakamoto et al. (2008) except that of GRB 060505 was taken from Palmer et al. (2006). Fluence and data of GRB 030329 and GRB 030821 were taken from Sakamoto et al. (2005), and those of GRB 041006 from Shirasaki et al. (2008). Other data were taken from GCN Circulars and HETE pages (http://space.mit.edu/HETE/Bursts). | X999X: X-ray, O: optical, R: radio; “” indicates the detection of a counterpart, “” a null detection, and “.” that no measurement was reported in the corresponding energy range, from http://grad40.as.utexas.edu/grblog.php | Oc | Rc | Rank101010The relative expected VHE flux for each GRB is ranked according to the empirical scheme described in Sect. 3.3 | ||
|---|---|---|---|---|---|---|---|---|---|---|---|---|---|
| number | () | (keV) | ( erg cm-2) | (s) | |||||||||
| 071003 | Swift | 292934 | + | 5.7 | 15–150 | 830 | 150 | 1.604111111Perley et al. (2008) | 5 | ||||
| 070808 | Swift | 287260 | + | 1.9 | 15–150 | 120 | 32 | . | 9 | ||||
| 070724A | Swift | 285948 | - | 2.2 | 15–150 | 3 | 0.4 | 0.457121212Cucchiara et al. (2007) | 21 | ||||
| 070721B | Swift | 285654 | - | 0.9 | 15–150 | 360 | 340 | 3.626131313Malesani et al. (2007) | 10 | ||||
| 070721A | Swift | 285653 | - | 2.3 | 15–150 | 7.1 | 3.868 | . | 20 | ||||
| 070621 | Swift | 282808 | - | 2 | 15–150 | 430 | 33 | . | 1 | ||||
| 070612B | Swift | 282073 | - | 4.7 | 15–150 | 168 | 13.5 | . | 15 | ||||
| 070429A | Swift | 277571 | - | 2.4 | 15–150 | 91 | 163.3 | . | 3 | ||||
| 070419B | Swift | 276212 | - | 3.5 | 15–150 | 736 | 236.4 | . | 7 | ||||
| 070209 | Swift | 259803 | - | 168 | 15–150 | 2.2 | 0.09 | . | 0.314?141414Redshift of a candidate host galaxy Berger & Fox (2007). | 22 | |||
| 061110A | Swift | 238108 | - | 3.7 | 15–150 | 106 | 40.7 | . | 0.758151515Fynbo et al. (2007) | 11 | |||
| 060526 | Swift | 211957 | + | 6.8 | 15–150 | 126 | 298.2 | . | 3.21161616Berger & Gladders (2006) | 8 | |||
| 060505 | Swift | 208654 | - | 4.7 | 15–150 | 94.4 | 4 | . | 0.0889171717Ofek et al. (2006) | 18 | |||
| 060403 | Swift | 203755 | + | 5.5 | 15–150 | 135 | 30.1 | . | 16 | ||||
| 050801 | Swift | 148522 | - | 1 | 15–150 | 31 | 19.4 | 1.56181818Redshift according to de Pasquale et al. (2007), based on afterglow modelling | 2 | ||||
| 050726 | Swift | 147788 | - | 6 | 15–150 | 194 | 49.9 | . | 13 | ||||
| 050509C | HETE-II | H3751 | - | 1 | 2–30 | 60 | 25 | 19 | |||||
| 050209 | HETE-II | U11568 | + | 420 | 30–400 | 200 | 46 | . | . | 14 | |||
| 041211B191919Although this burst was referred to as GRB 041211 in various GCN Circulars, the proper name GRB 041211B (e.g., in Pélangeon et al., 2006) should be used to distinguish it from another burst, GRB 041211A (=H3621) which occurred earlier on the same day (Pélangeon, A., private communication). | HETE-II | H3622 | + | 80 | 30–400 | 1000 | 100 | . | . | 4 | |||
| 041006 | HETE-II | H3570 | + | 0.1 | 30–400 | 713 | 20 | 0.716202020Soderberg et al. (2006) | 6 | ||||
| 030821 | HETE-II | H2814 | - | 212121The position error of this burst is large, see Fig. 3 | 30–400 | 280 | 23 | . | . | . | 17 | ||
| 030329 | HETE-II | H2652 | + | 30–400 | 10760 | 33 | 0.1687222222Stanek et al. (2003) | 12 |
3.1 Properties of the GRBs
For each burst, the observational properties as obtained from the triggering satellite are shown in Table 1. These include trigger number, energy band, fluence in that energy band, and the duration of the burst (). Whenever there were follow-up observations in the X-ray, optical, or radio bands, whether a detection has occurred (denoted by a tick ) or not (denoted by a cross ) is also shown. If no observation at a given wavelength was reported, a dot (.) is shown. The reported redshifts () of 10 GRBs are also presented, of which 6 are lower than one. Two observed bursts, GRB 070209 and GRB 070724A, are short GRBs while the rest are long GRBs. The population of short GRBs has a redshift distribution (Berger et al., 2007) significantly less than that of the long GRBs (Jakobsson et al., 2006). Therefore, on average they are likely to suffer from a lower level of EBL absorption.
X-ray flares were detected from three of the GRBs in the H.E.S.S. sample. They occurred at 273s after the burst for GRB 050726, 284s for GRB 050801, and s for GRB 070429A (Curran et al., 2008). Unfortunately, the flares occurred outside the time windows of the H.E.S.S. observations.
3.2 H.E.S.S. observations
For each burst, the start time, , of the H.E.S.S. observations after the burst is shown in Table 2. Since an observing strategy to start observing the burst position up to 24 hours after the burst time is applied, the mean is of the order of 10 hours. The (good-quality) exposure time of the observations using telescopes for each burst is included. The mean Z.A. of the observations is also presented.
3.3 The ranking scheme
As mentioned in the introduction, there is no lack of models predicting VHE emission from GRBs. However, the evolution of the possible VHE -ray emission with time is model-dependent. To give an empirical, model-independent estimate of the relative expected VHE flux of each GRB (which also depends on ), it is assumed that: (1) the relative VHE signal scales as the energy released in the prompt emission, taken as a typical energy measure of a GRB. Hence where is the fluence in the Swift/BAT band. For bursts not triggered by BAT, the measured fluence is extrapolated into this energy band; (2) the possible VHE signal fades as time goes on, as observed in longer wavelength (e.g. X-ray) data. In particular, the VHE flux follows the average decay of the X-ray flux and therefore where denotes the time after the burst and 1.3 is the average X-ray afterglow late-time power-law decay index (Nousek et al., 2006). Since in most cases the exposure time of the observations is much shorter than (the start time of the corresponding H.E.S.S. observations after the trigger), the expected flux at can be used as a measure of the strength of the VHE signal, and therefore of the relative possibility of detecting a VHE signal from that GRB. By setting to , we have
| (1) |
The rank of each GRB according to equation 1 is shown in the last column in Table 1. Note that redshift information (available for only a few GRBs), and thus the corresponding EBL absorption, is not taken into account in the ranking scheme.
4 Data Analysis
Calibration of data, event reconstruction and rejection of the cosmic-ray background (i.e. -ray event selection criteria) were performed as described in Aharonian et al. (2006c), which employs the techniques described by Hillas (1996).
Gamma-like events were then taken from a circular region (on-source) of radius centred at the burst position given in Table 1. The background was estimated using the reflected-region background model as described in Berge et al. (2007), in which the number of background events in the on-source region () is estimated from off-source regions located at the same as the on-source region during the same observation. The number of -like events is given by where is the total number of events detected in the on-source region and the normalization factor.
Independent analyses of various GRBs using different methods and background estimates (Berge et al., 2007) yielded consistent results.
4.1 Analysis technique
Two sets of analysis cuts were applied to search for a VHE -ray signal from observational data taken with three or four telescopes. These are ‘standard’ cuts (Aharonian et al., 2006c) and ‘soft’ cuts232323‘Soft’ cuts were called ‘spectrum’ cuts in Aharonian et al. (2006a). (the latter have lower energy thresholds, as described in Aharonian et al., 2006a). For standard (soft) cuts, (). While standard cuts are optimized for a source with a power-law spectrum of photon index , soft cuts are optimized for a source with a steep spectrum (), and have better sensitivity at lower energies. Since EBL absorption is less severe for lower energy photons, the soft-cut analysis is useful in searching for VHE -rays from GRBs which are at cosmological distances. For example, the photon indices of two blazars PKS 2005-489 (Aharonian et al., 2005) and PG 1553+113 (Aharonian et al., 2008) were measured to be .
An exception to this analysis scheme is GRB 030329. As the central trigger system had yet to be installed when this observation was made, a slightly different analysis technique was used. The description of the image and analysis cuts used for the data from GRB 030329 can be found in Aharonian et al. (2005). For GRB 030821, only the standard-cut analysis (for two-telescope data) was performed (see Sect. 5.4).
The positional error circle of most GRBs, with the exceptions of GRB 030821, GRB 050209, and GRB 070209, is small compared to the H.E.S.S. point spread function (PSF). The 68% -ray containment radius, , of the H.E.S.S. PSF can be as small as 3, depending on the Z.A. and of the observations, and the analysis cuts applied. The 68% containment radius, , of the observations of GRB 050209 and GRB 070209 is about 9 using standard-cut analysis242424 is larger using soft-cut analysis, slightly larger than the corresponding error circles. Therefore, point-source analyses were performed for all GRBs except GRB 030821, the error box of which is much bigger than the H.E.S.S. PSF (see Sect. 5.4 for its treatment).
4.2 Energy threshold
The energy threshold, , is conventionally defined as the peak in the differential -ray rate versus energy curve of a fictitious source with photon index (Konopelko et al., 1999). This curve is a convolution of the effective area with the expected energy spectrum of the source as seen on Earth. Such energy thresholds, obtained by the standard-cut analysis and the soft-cut analysis for each GRB observation, are shown in Table 2, assuming . The energy threshold depends on the Z.A. of the observations and the analysis used. The larger the Z.A., the higher is the energy threshold. Moreover, soft-cut analysis gives a lower value of than that of standard-cut analysis. Note that -ray photons with energies below can be detected by the telescopes.
4.3 Optical efficiency of the instrument
The data presented were also corrected for the long-term changes in the optical efficiency of the instrument. The optical efficiency has decreased over a period of a few years. This has changed the effective area and energy threshold of the instrument. Specifically, the energy threshold has increased with time. Using images of local muons in the FoV, this effect in the calculation of flux upper limits is corrected (c.f. Aharonian et al., 2006c).
5 Results
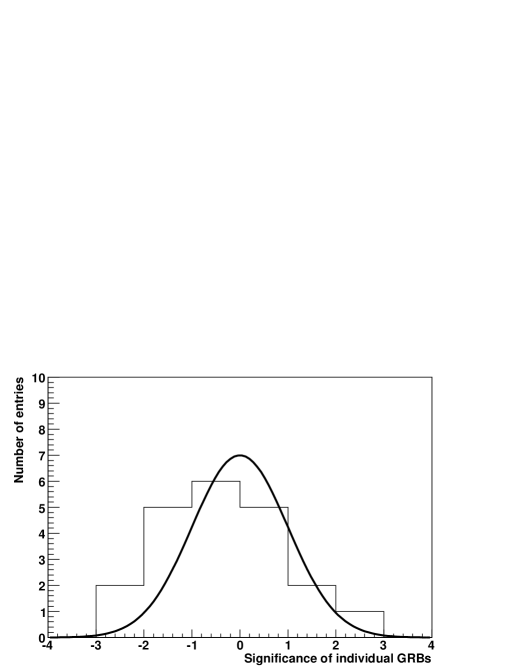
No evidence of a significant excess of VHE -ray events from any of the GRB positions given in Table 1 during the period covered by the H.E.S.S. observations was found. The number of on-source () and off-source events (), normalization factor (), excess, and statistical significance252525calculated by eq. (17) in Li & Ma (1983) of the excess in standard deviations () are given for each of the 21 GRBs in Table 2. The results for GRB 030821 are given in Sect. 5.4. Figure 1 shows the distribution of the significance obtained from the soft-cut analysis of the observations of each of the 21 GRBs. A Gaussian distribution with mean zero and standard deviation one, which is expected in the case of no detection, is shown for comparison. The distribution of the statistical significance is consistent with this Gaussian distribution. Thus no significant signal was found from any of the individual GRBs. A search for serendipitous source discoveries in the H.E.S.S. FoV during observations of the GRBs also resulted in no significant detection. The 99.9% confidence level (c.l.) flux upper limits (above ) have been calculated using the method of Feldman & Cousins (1998) for both standard cuts (assuming ) and soft cuts (assuming ), and are included in Table 2. The limits are as observed on Earth, i.e. the EBL absorption factor was not taken into account. The systematic error on a H.E.S.S. integral flux measurement is estimated to be 20%, and it was not included in the calculation of the upper limits.
For those GRBs with reported redshifts, the effect of the EBL on the H.E.S.S. limits can be estimated. Using the EBL model P0.45 described in Aharonian et al. (2006b), differential upper limits (again assuming ) at the energy threshold were calculated from the integral upper limits obtained using soft-cut analysis. These upper limits, as well as those calculated without taking the EBL into account, are shown in Table 3.
| Standard-cut analysis | Soft-cut analysis | Temporal analysis | ||||||||||||||||||
| GRB262626The GRBs are listed in the order of the ranking scheme described in Sect. 3.3. GRB 030821 is not listed, the results of which are given in Sect. 5.4. | Exposure | Z.A. | Excess | Signi- | Flux ULs | Excess | Signi- | Flux ULs | /d.o.f. | P() | ||||||||||
| (min) | (min) | () | ficance | (GeV) | (cm-2 s-1) | ficance | (GeV) | (cm-2 s-1) | ||||||||||||
| 070621 | 6.5 | 234.6 | 4 | 16 | 204 | 2273 | 0.091 | -2.6 | -0.18 | 250 | 731 | 5903 | 0.13 | -6.9 | -0.24 | 190 | 19.2/28 | 0.89 | ||
| 050801 | 15.0 | 28.2 | 4 | 43 | 13 | 173 | 0.091 | -2.7 | -0.68 | 400 | 46 | 442 | 0.13 | -9.3 | -1.2 | 310 | 0.168/3 | 0.98 | ||
| 070429A | 64 | 28.2 | 4 | 23 | 4 | 78 | 0.091 | -3.1 | -1.2 | 290 | 20 | 203 | 0.13 | -5.4 | -1.0 | 220 | 6.39/3 | 0.094 | ||
| 041211Ba | 567.1 | 14.2 | 3 | 64 | 9 | 87 | 0.11 | -0.67 | -0.21 | 1850 | 27 | 236 | 0.17 | -12 | -1.9 | 1360 | 14.6/14 | 0.40 | ||
| 742.3 | 112.3 | 4 | 44 | 76 | 1247 | 0.063 | -1.9 | -0.21 | 380 | 317 | 4353 | 0.083 | -46 | -2.4 | 280 | |||||
| 071003272727Three- and four-telescope data are presented. | 623.3 | 56.2 | 4 | 35 | 16 | 272 | 0.10 | -11 | -2.2 | 390 | 97 | 785 | 0.14 | -15 | -1.4 | 280 | 32.3/12 | 0.0012 | ||
| 691.1 | 56.2 | 3 | 41 | 25 | 204 | 0.10 | 4.6 | 0.93 | 480 | 79 | 547 | 0.14 | 0.86 | 0.091 | 340 | |||||
| 041006 | 626.1 | 81.9 | 4 | 27 | 80 | 770 | 0.10 | 3 | 0.32 | 200 | 302 | 1974 | 0.14 | 20 | 1.1 | 150 | 8.89/9 | 0.45 | ||
| 070419B | 907 | 56.4 | 4 | 47 | 28 | 391 | 0.091 | -7.5 | -1.3 | 700 | 121 | 1069 | 0.13 | -13 | -1.0 | 520 | 11.9/6 | 0.064 | ||
| 060526 | 284.2 | 112.8 | 4 | 25 | 93 | 1068 | 0.10 | -13.8 | -1.3 | 280 | 492 | 3711 | 0.14 | -38 | -1.6 | 220 | 19.8/12 | 0.072 | ||
| 070808 | 306.2 | 112.8 | 4 | 34 | 49 | 659 | 0.091 | -11 | -1.4 | 310 | 209 | 1733 | 0.13 | -7.6 | -0.49 | 260 | 15.8/12 | 0.20 | ||
| 070721B | 925.7 | 103.8 | 4 | 40 | 59 | 984 | 0.063 | -2.5 | -0.31 | 440 | 237 | 2676 | 0.083 | 14 | 0.89 | 320 | 15.5/11 | 0.16 | ||
| 061110A | 407.68 | 112.8 | 4 | 25 | 76 | 838 | 0.093 | -1.9 | -0.21 | 280 | 314 | 2671 | 0.13 | -20 | -1.0 | 200 | 4.66/11 | 0.95 | ||
| 030329282828A slightly different analysis technique was used, see Sect. 4.1. Soft-cut analysis is not available for this observation. | 16493.5 | 28.0 | 2 | 60 | 4 | 26 | 0.14 | 0.27 | 0.13 | 1360 | 5.93/3 | 0.12 | ||||||||
| 050726 | 772.7 | 112.8 | 4 | 40 | 107 | 1031 | 0.083 | 21 | 2.1 | 320 | 333 | 2619 | 0.11 | 42 | 2.3 | 260 | 14.7/12 | 0.26 | ||
| 050209 | 1208.5 | 168.6 | 4 | 48 | 104 | 1096 | 0.11 | -18 | -1.6 | 480 | 528 | 4204 | 0.14 | -73 | -2.8 | 340 | 36.3/18 | 0.0065 | ||
| 070612B | 901.7 | 112.8 | 4 | 18 | 104 | 1190 | 0.091 | -4.2 | -0.39 | 240 | 415 | 3233 | 0.13 | 11 | 0.51 | 180 | 4.87/12 | 0.96 | ||
| 060403 | 820.4 | 52.8 | 4 | 39 | 33 | 252 | 0.091 | 10 | 1.9 | 440 | 128 | 875 | 0.13 | 19 | 1.6 | 320 | 10.4/6 | 0.11 | ||
| 060505 | 1163 | 111 | 4 | 42 | 99 | 837 | 0.091 | 23 | 2.4 | 520 | 339 | 2740 | 0.13 | -3.5 | -0.18 | 400 | 22.1/12 | 0.036 | ||
| 050509C | 1289 | 28.2 | 4 | 22 | 31 | 344 | 0.083 | 2.3 | 0.41 | 200 | 112 | 965 | 0.11 | 4.8 | 0.43 | 150 | 0.301/3 | 0.96 | ||
| 070721A | 893.5 | 112.8 | 4 | 30 | 90 | 1436 | 0.059 | 5.5 | 0.58 | 320 | 280 | 3837 | 0.077 | -15 | -0.86 | 260 | 6.78/12 | 0.87 | ||
| 070724A | 927.5 | 84.6 | 4 | 23 | 73 | 720 | 0.091 | 7.5 | 0.88 | 260 | 246 | 2042 | 0.13 | -9.3 | -0.55 | 200 | 14.3/9 | 0.11 | ||
| 070209 | 926.7 | 56.4 | 4 | 41 | 37 | 444 | 0.091 | -3.4 | -0.51 | 480 | 185 | 1442 | 0.13 | 4.8 | 0.33 | 370 | 5.35/6 | 0.50 | ||
| GRB | Redshift | (GeV) | 292929Limits are given in units of . | a |
|---|---|---|---|---|
| 060505 | 0.0889 | 400 | 3.9 | 5.8 |
| 030329 | 0.1687 | 1360 | 7.6 | 9.7 |
| 070209 | 0.314 | 370 | 1.2 | 8.7 |
| 070724A | 0.457 | 200 | 2.1 | 1.0 |
| 041006 | 0.716 | 150 | 1.8 | 2.7 |
| 061110A | 0.758 | 200 | 1.7 | 1.7 |
| 050801 | 1.56 | 310 | 2.1 | 303030The limits corrected for EBL absorption are 10 orders of magnitude larger than that observed. |
| 071003313131Only 4-telescope data were used. | 1.604 | 280 | 2.0 | b |
| 060526 | 3.21 | 220 | 1.7 | b |
| 070721B | 3.626 | 320 | 1.1 | b |
| Number | Soft-cut | Standard-cut | |
|---|---|---|---|
| of GRBs | analysis | analysis | |
| Sample A | 10 | -2.13 | -1.81 |
| Sample B | 6 | -0.20 | 1.45 |
| Sample C | 11 | -0.53 | 0.48 |
| all GRBs | 21 | -1.98 | -0.18 |
5.1 Stacking analysis
Although no significant excess was found from any individual GRB, co-adding the excess events from the observations of a number of GRBs may reveal a signal that is too weak to be seen in the data from one GRB, provided that the PSFs of the H.E.S.S. observations are bigger than the error box of the GRB positions (which is the case, see Sect. 4.1). Firstly, stacking of all GRBs (except GRB 030821, which has a high positional uncertainty) in the sample was performed. This yielded a total of 157 excess events and a statistical significance of 1.98 using the soft-cut analysis. Use of standard cuts produced a similar result (see Table 4). Secondly, combining the significance of the results from three selected subsets extracted from the whole sample was performed. The a priori selection criteria were to choose those GRBs with a higher expected VHE flux or a lower level of EBL absorption. The following requirements were used to select three subsets:
- Sample A:
-
the first 10 in the ranking described in Sect. 3.3;
- Sample B:
-
all GRBs with a measured redshift ;
- Sample C:
-
all GRBs with a soft-cut energy threshold lower than 300 GeV and with either a measured redshift or with an unknown redshift.
The result is shown in Table 4. As can be seen, there is no significant evidence of emission in any of these subsets.
5.2 Temporal analysis
As possible VHE radiation from GRBs is expected to vary with time, a temporal analysis to search for deviation from zero excess in the observed data was performed. Soft-cut analysis was used for all GRBs (except GRB 030329) since this analysis has a lower energy threshold and a better acceptance of -rays and cosmic rays and therefore increases the statistics. The -like excess events were binned in 10-minute time intervals for each GRB data set and were compared to the assumption of no excess throughout the observed period. The /d.o.f. value and the corresponding probability are shown in Table 2 for each GRB. Within the whole sample, the lowest probability that the hypothesis that the excess was zero throughout the observation period is correct is (for GRB 071003) and no significant deviation from zero within any of the GRB temporal data was found. Standard-cut analysis produced consistent results.
5.3 GRB 070621: Observations of a GRB with the fastest reaction and the longest exposure time
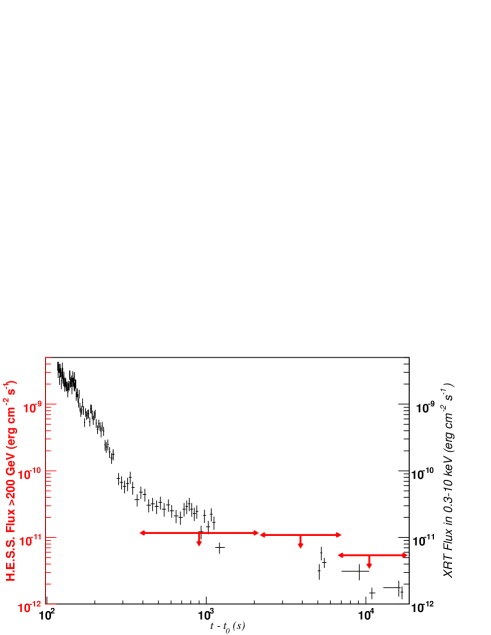
GRB 070621 is the highest-ranked GRB in the sample (Sect. 3.3), i.e. it has the highest relative expected VHE flux at the start time of the observations. The duration of the Swift burst was s, thus clearly classifying the burst as a long GRB. The fluence in the 15–150 keV band was 4.3 erg cm-2. The XRT light curve is represented by an initial rapidly-decaying phase and a shallow phase, with the transition happening around s where denotes the trigger time (Sbarufatti et al., 2007). Despite extensive optical monitoring, no fading optical counterpart was found. The H.E.S.S. observations started at s and lasted for 5 hours, largely coincident with the X-ray shallow phase. These observations were both the most prompt and the longest among those presented. Figure 2 shows the 99.9% H.E.S.S. energy flux upper limits above GeV (using soft-cut analysis), together with the XRT results (Evans et al., 2007). As seen, the limits for this period are at levels comparable to the X-ray energy flux during the same period. Unfortunately the lack of redshift information for this burst prevents further interpretation of the limits.
5.4 GRB 030821: Observations of a GRB with a high positional uncertainty
Some GRBs, such as GRB 030821, have a high uncertainty in position; with a relatively large camera FoV (5), the H.E.S.S. telescopes are able to cover the whole positional error box of such GRBs.
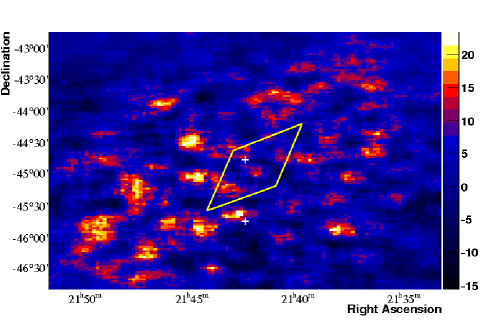
Observations of GRB 030821 started 18 hours after the burst and lasted for a live-time of 55.5 minutes, with a mean Z.A. of 28. The observations were taken when the array was under construction and only two telescopes were operating, resulting in an energy threshold of 260 GeV. The GRB has a relatively high uncertainty in position as determined from IPN (the third Interplanetary Network) triangulation (Hurley et al., 2003), and its error box is bigger than the PSF of H.E.S.S. However, because of the relatively large FoV of the camera, the whole error box, and thus the possible GRB position, is within the H.E.S.S. FoV. The sky excess map overlaid with the error box is shown in Fig. 3. As can be seen, there is no significant excess at any position within the error box. The sky region with the largest number of peak excess events is located in the south-eastern part of the error box. Using a point-source analysis centred at this peak, a flux upper limit (above 260 GeV) of 1.7 cm-2 s-1 was derived. Since an upper limit derived for any location in the error box with fewer excess events is lower than this value323232A larger excess implies a higher value of the upper limit, since the integrated exposure, that depends on Z.A. and of the observations, is largely the same over the whole error box., it may be regarded as a conservative upper limit of the VHE flux associated with GRB 030821 during the period of the H.E.S.S. observations.
6 Discussion
The upper limits presented in this paper are among the most stringent ever derived from VHE -ray observations of GRBs during the afterglow period. In fact, the 99.9% confidence level limits (in energy flux) are at levels comparable to the X-ray energy flux as observed by Swift/XRT during the same period (see, e.g. Fig. 2). Unless most of the GRBs are located at high redshifts and thus their VHE flux is severely absorbed by the EBL (this possibility is discussed below), one expects detection of the predicted VHE component with energy flux levels comparable to those in X-rays in some scenarios (Dermer et al., 2000; Wang et al., 2001; Zhang & Mészáros, 2001; Pe’er & Waxman, 2005; Fan et al., 2008).
On the other hand, the unknown redshifts of many of the GRBs in the sample (including GRB 070621, the highest-ranking, which is discussed in Sect. 3.3) complicate the physical interpretation of the data, because EBL absorption at VHE energies is severe for a GRB with . The mean and median redshift of the 10 GRBs with reported redshifts is 1.3 and 0.7, respectively. If the 12 GRBs without redshift have the same redshift distribution, one would expect 40% of them (5 GRBs) to have . In this case, the EBL absorption may not preclude the detection of the predicted VHE -rays for the GRB sample presented here333333The optical depth of EBL absorption for a 100 GeV photon is 3 at , according to the P0.45 model demonstrated in Aharonian et al. (2006b)..
There is no reported X-ray flare during the H.E.S.S. observational time windows, therefore no conclusion on whether or not X-ray flares are accompanied by VHE flares, as well as the origin of X-ray flares, can be drawn. If UHECRs are generated in nearby GRB sources, as suggested by some authors, a detectable VHE flux is expected from nearby GRBs. Therefore, although the unknown redshifts of a significant fraction of GRBs in our sample (12 out of 22) and the uncertainty in the modeled VHE temporal evolution are surely in play, the results presented here do not indicate (but also not exclude) that GRBs are dominant sources of UHECRs.
7 Outlook
The data from our sample of 22 GRBs do not provide any evidence for a strong VHE -ray component from GRBs during the afterglow phase. EBL absorption can explain the lack of detection in our sample. However, this does not exclude a population of GRBs that exhibit a strong VHE component. While the EGRET experiment did not detect MeV–GeV photons from most BATSE GRBs in its FoV, some strong bursts (e.g. GRB 940217) have proved to emit delayed emission, 1.5 hours after the burst, at energies as high as 20 GeV (Hurley et al., 1994). With Fermi’s observations of GRBs having started in mid-2008, it is likely that our knowledge of the high-energy emission of GRBs will be improved in the near future.
The future prospects for detection at VHE energies rely on the likelihood of observing a GRB with low redshift (e.g. ) early enough. In the cases where there is no detection, sensitive and early upper limits on the intrinsic VHE luminosity of these nearby GRBs will still improve our understanding of the radiation mechanisms of GRBs. The existence of a distinct population of low-luminosity (LL) GRBs was suggested based on the high detection rate of low-redshift LL GRBs such as GRB 980425 and GRB 060218 (e.g. Soderberg et al., 2004). Due to their proximity, they are good targets for VHE observations. Since they are sub-energetic compared to other GRBs, they may be accompanied by a lower VHE luminosity. On the other hand, if most radiation are emitted at high energies, the detection probability would be much higher.
Franceschini et al. (2008) claimed a very small -ray opacity due to EBL absorption. The optical depth is about a factor of three less than the one we used, depending on the energies (Aharonian et al., 2006b). Therefore, on-going GRB observations with H.E.S.S., as well as other ground-based VHE detectors, are crucial to test this model.
8 Conclusions
During 5 years of operation (2003–2007), 32 GRBs were observed during the afterglow phase using the H.E.S.S. experiment. Those 22 GRBs with high-quality data were analysed and the results presented in this paper. Depending on the visibility and observing conditions, the start time of the observations varied from minutes to hours after the burst.
There is no evidence of VHE emission from any individual GRB during the period covered by the H.E.S.S. observations, nor from stacking analysis using the whole sample and a priori selected sub-sets of GRBs. Fine-binned temporal data revealed no short-term variability from any observation and no indication of VHE signal from any of these time bins was found. Upper limits of VHE -ray flux during the observations from the GRBs were derived. These 99.9% confidence level energy flux upper limits are at levels comparable to the contemporary X-ray energy flux. For those GRBs with reported redshifts, differential upper limits at the energy threshold after correcting for EBL absorption are presented.
H.E.S.S. phase II will have an energy threshold of about 30 GeV. With much less absorption by the EBL at such low energies, it is hoped that the H.E.S.S. experiment will enable the detection of VHE -ray counterparts of GRBs.
Acknowledgements.
The support of the Namibian authorities and of the University of Namibia in facilitating the construction and operation of H.E.S.S. is gratefully acknowledged, as is the support by the German Ministry for Education and Research (BMBF), the Max Planck Society, the French Ministry for Research, the CNRS-IN2P3 and the Astroparticle Interdisciplinary Programme of the CNRS, the U.K. Science and Technology Facilities Council (STFC), the IPNP of the Charles University, the Polish Ministry of Science and Higher Education, the South African Department of Science and Technology and National Research Foundation, and by the University of Namibia. We appreciate the excellent work of the technical support staff in Berlin, Durham, Hamburg, Heidelberg, Palaiseau, Paris, Saclay, and in Namibia in the construction and operation of the equipment. P.H. Tam acknowledges support from IMPRS-HD. This work has made use of the GCN Notices and Circulars provided by NASA’s Goddard Space Flight Center, as well as data supplied by the UK Swift Science Data Centre at the University of Leicester.References
- Aharonian et al. (2005) Aharonian, F. A., Akhperjanian, A. G., Aye, K.-M., et al. (HESS collaboration) 2005, A&A, 436, L17
- Aharonian et al. (2006a) Aharonian, F. A., Akhperjanian, A. G., Bazer-Bachi, A. R., et al. (HESS collaboration) 2006a, A&A, 448, L19
- Aharonian et al. (2006b) Aharonian, F. A., Akhperjanian, A. G., Bazer-Bachi, A. R., et al. (HESS collaboration) 2006b, Nature, 440, 1018
- Aharonian et al. (2006c) Aharonian, F. A., Akhperjanian, A. G., Bazer-Bachi, A. R., et al. (HESS collaboration) 2006c, A&A, 457, 899
- Aharonian et al. (2008) Aharonian, F. A., Akhperjanian, A. G., Barres de Almeida, U., et al. (HESS collaboration) 2008, A&A, 477, 481
- Aharonian et al. (2009) Aharonian, F. A., Akhperjanian, A. G., Barres de Almeida, U., et al. (HESS collaboration) 2009, ApJ, 690, 1068
- Albert et al. (2007) Albert, J., Aliu, E., Anderhub, H., et al. (MAGIC collaboration) 2007, ApJ, 667, 358
- Atkins et al. (2000) Atkins, R., Benbow, W., Berley, D., et al. 2000, ApJ, 533, L119
- Atkins et al. (2005) Atkins, R., Benbow, W., Berley, D., et al. 2005, ApJ, 630, 996
- Amenomori et al. (1996) Amenomori, M., Cao, Z., Dai, B. Z., et al. 1996, A&A, 311, 919
- Baring (2006) Baring, M. G. 2006, ApJ, 650, 1004
- Berge et al. (2007) Berge, D., Funk, S., & Hinton, J. A. 2007, A&A, 466, 1219
- Berger & Fox (2007) Berger, E., & Fox, D. 2007, GCN Circular 6101
- Berger & Gladders (2006) Berger, E., & Gladders, M. 2006, GCN Circular 5170
- Berger et al. (2007) Berger, E., Fox, D. B., Price, P. A., et al. 2007, ApJ, 664, 1000
- Böttcher & Dermer (1998) Böttcher, M., & Dermer, C. D. 1998, ApJ, 499, L131
- Butler et al. (2007) Butler, N. R., Kocevski, D., Bloom, J. S., et al. 2007, ApJ, 671, 656
- Chincarini et al. (2007) Chincarini, G., Moretti, A., Romano, P., et al. 2007, ApJ, 671, 1903
- Connaughton et al. (1997) Connaughton, V., Akerlof, C. W., Barthelmy, S., et al. 1997, ApJ, 479, 859
- Cucchiara et al. (2007) Cucchiara, A., Fox, D. B., & Cenko, S. B., et al. 2007, GCN Circular 6665
- Curran et al. (2008) Curran, P. A., Starling, R. L. C., O’Brien, P. T., et al. 2008, A&A, 487, 533
- Dermer et al. (2000) Dermer, C. D., Chiang, J., & Mitman, K. E. 2000, ApJ, 537, 785
- Dermer (2007) Dermer, C. D. 2007, ApJ, 664, 384
- Evans et al. (2007) Evans, P. A., Beardmore, A. P., & Page, K. L., et al. 2007, A&A, 469, 379
- Fan & Piran (2008) Fan, Y.-Z., & Piran, T. 2008, Frontiers of Physics in China, 3, 306
- Fan et al. (2008) Fan, Y.-Z., Piran, T., Narayan, R., & Wei, D.-M. 2008, MNRAS, 384, 1483
- Feldman & Cousins (1998) Feldman, G. J., & Cousins, R. D. 1998, Phys. Rev. D., 57, 3873
- Franceschini et al. (2008) Franceschini, A., Rodighiero, G., & Vaccari, M. 2008, A&A, 487, 837
- Funk et al. (2004) Funk, S., Hermann, G., Hinton, J. A. et al. 2004, Astropart. Phys., 22, 285
- Fynbo et al. (2007) Fynbo, J. P. U, Thoene, C. C. & Malesani, D., et al. 2007, GCN Circular 6759
- Galli & Piro (2007) Galli, A., & Piro, L. 2007, A&A, 475, 421
- Galli & Piro (2008) Galli, A., & Piro, L. 2008, A&A, 489, 1073
- Hillas (1996) Hillas, A. M. 1996, Space Sci. Rev., 75, 17
- Horan et al. (2007) Horan, D., Atkins, R. W., Badran, H. M., et al. 2007, ApJ, 655, 396
- Hurley et al. (1994) Hurley, K., Dingus, B. L., Mukherjee, R., et al. 1994, Nature, 372, 652
- Hurley et al. (2003) Hurley, K., Cline, T., & Mazets, E., et al. 2003, GCN Circular 2359
- Jakobsson et al. (2006) Jakobsson, P., Levan, A., Fynbo, J. P. U., et al. 2006, A&A, 447, 897
- Klebesadel et al. (1973) Klebesadel, R. W., Strong, I. B., & Olson, R. A. 1973, ApJ, 182, L85
- Konopelko et al. (1999) Konopelko, A., Hemberger, M., Aharonian, F. et al. (HEGRA Collaboration) 1999, Astropart. Phys., 10, 275
- Li & Ma (1983) Li, T.-P., & Ma, Y.-Q. 1983, ApJ, 272, 317
- Malesani et al. (2007) Malesani, D., Jakobsson, P., Fynbo, J. P. U., Hjorth, J., & Vreeswijk, P. M. 2007, GCN Circular 6651
- Murase et al. (2008) Murase, K., Ioka, K., Nagataki, S., & Nakamura, T. 2008, Phys. Rev. D, 78, 023005
- Nikishov (1962) Nikishov, A. I. 1962, Sov. Phys. JETP, 14, 393
- Nousek et al. (2006) Nousek, J. A., Kouveliotou, C., Grupe, D., et al. 2006, ApJ, 642, 389
- Ofek et al. (2006) Ofek, E. O., Cenko, S. B., Gal-Yam, A., et al. 2007, ApJ, 662, 1129
- Padilla et al. (1998) Padilla, L., Funk, B., Krawczynski, H., et al. 1998, A&A, 337, 43
- Palmer et al. (2006) Palmer, D., Cummings, J., Stamatikos, M., Markwardt, C., & Sakamoto, T. 2006, GCN Circular 5076
- van Paradijs et al. (2000) van Paradijs, J., Kouveliotou, C., & Wijers, R. A. M. J., 2000, ARA&A, 38, 379
- de Pasquale et al. (2007) de Pasquale, M., Oates, S. R., Page, M. J., et al. 2007, MNRAS, 377, 1638
- Pe’er & Waxman (2005) Pe’er, A. & Waxman, E. 2005, ApJ, 633, 1018
- Pélangeon et al. (2006) Pélangeon, A., Atteia, J.-L., Lamb, D. Q., & Ricker, G. R. 2006, AIPC, 836, 149
- Perley et al. (2008) Perley, D. A., Li, W., Chornock, R., et al. 2008, ApJ, 688, 470
- Piran (1999) Piran, T. 1999, Phys. Rep, 314, 575
- Poirier et al. (2003) Poirier, J., D’Andrea, C., Fragile, P. C., et al. 2003, Phys. Rev. D, 67, 042001
- Razzaque et al. (2004) Razzaque, S., Mészáros, P., & Zhang, B. 2004, ApJ, 613, 1072
- Sakamoto et al. (2005) Sakamoto, T., Lamb, D. Q., Kawai, N., et al. 2005, ApJ, 629, 311
- Sakamoto et al. (2008) Sakamoto, T., Barthelmy, S. D., Barbier, L., et al. 2008, ApJS, 175, 179
- Sbarufatti et al. (2007) Sbarufatti, B., Barthelmy, S. D., Holland, S. T., et al. 2007, GCN Report 67.2
- Shirasaki et al. (2008) Shirasaki, Y., Yoshida, A., Kawai, N., et al. 2008, PASJ, 60, 919
- Soderberg et al. (2004) Soderberg, A. M., Kulkarni, S. R., Berger, E., et al. 2004, Nature, 430, 648
- Soderberg et al. (2006) Soderberg, A. M., Kulkarni, S. R., Price, P. A., et al. 2006, ApJ, 636, 391
- Stamatikos, M., et al. (2007) Stamatikos, M., Barbier, L., Barthelmy, S. D., et al. 2007, GCN Circular 6711
- Stanek et al. (2003) Stanek, K. Z., Matheson, T., Garnavich, P. M. et al. 2003, ApJ, 591, L17
- Wang et al. (2001) Wang, X. Y., Dai, Z. G., & Lu, T. 2001, ApJ, 556, 1010
- Wang et al. (2006) Wang, X. Y., Li, Z., & Mészáros, P. 2006, ApJ, 641, L89
- Waxman & Bahcall (2000) Waxman, E., & Bahcall, J. N. 2000, ApJ, 541, 707
- Zhang & Mészáros (2001) Zhang, B. & Mészáros, P. 2001, ApJ, 559, 110
- Zhang & Mészáros (2004) Zhang, B. & Mészáros, P. 2004, Int. J. Mod. Phys. A., 19, 2385
- Zhang et al. (2006) Zhang, B., Fan, Y.-Z., Dyks, J., et al. 2006, ApJ, 642, 354