Ram pressure stripping of the multiphase ISM in the Virgo cluster spiral galaxy NGC 4438
Ram pressure stripping of the multiphase ISM is studied in the perturbed Virgo cluster spiral galaxy NGC 4438. This galaxy underwent a tidal interaction Myr ago and is now strongly affected by ram pressure stripping. Deep VLA radio continuum observations at 6 and 20 cm are presented. We detect prominent extraplanar emission to the west of the galactic center, which extends twice as far as the other tracers of extraplanar material. The spectral index of the extraplanar emission does not steepen with increasing distance from the galaxy. This implies in situ re-acceleration of relativistic electrons. The comparison with multiwavelength observations shows that the magnetic field and the warm ionized interstellar medium traced by H emission are closely linked. The kinematics of the northern extraplanar H emission, which is ascribed to star formation, follow those of the extraplanar CO emission. In the western and southern extraplanar regions, the H measured velocities are greater than those of the CO lines. We suggest that the ionized gas of this region is excited by ram pressure. The spatial and velocity offsets are consistent with a scenario where the diffuse ionized gas is more efficiently pushed by ram pressure stripping than the neutral gas. We suggest that the recently found radio-deficient regions compared to m emission are due to this difference in stripping efficiency.
Key Words.:
Galaxies: interactions – Galaxies: ISM – Galaxies: kinematics and dynamics – Galaxies: clusters individual: Virgo – Radio continuum: galaxies1 Introduction
The strongly Hi deficient spiral galaxy NGC 4438 is a unique case in the Virgo cluster. The tidal arms of this highly inclined galaxy are evidence of its tidal interaction Myr ago with NGC 4435 (Combes et al. 1988, Vollmer et al. 2005) or M 86 (Kenney et al. 2008). The disk of interstellar matter is severely truncated and extraplanar gas is found to the west of the galaxy center. This extraplanar gas consists of all ISM phases: (i) molecular hydrogen observed in CO (Combes et al. 1988, Vollmer et al. 2005), (ii) atomic hydrogen (Cayatte et al. 1990, Hota et al. 2007), (iii) warm ionized gas observed in H (Kenney et al. 1995, Chemin et al. 2005), (iv) hot ionized gas observed in X-rays (Kotanyi et al. 1983, Machacek et al. 2004), and (v) magnetic fields and cosmic ray electrons observed in the radio continuum (Kotanyi & Ekers 1983, Kotanyi et al. 1983, Hota et al. 2007). While it is agreed that the distortion of the stellar content of NGC 4438 is due to a tidal encounter, different mechanisms were put forward to explain the displacement of all ISM phases: (i) the tidal interaction which extracted the molecular gas from the center and left it to the west of the galaxy (Combes et al. 1988), (ii) a collision between the ISM of the two galaxies (Kenney et al. 1995), and (iii) ram pressure stripping due to the rapid motion of NGC 4438 through the hot intracluster medium (ICM; Kotanyi et al. 1983, Chincarini & de Souza 1985).
Vollmer et al. (2005) combined new CO(1–0) observations with detailed numerical simulations. This lead to the following interaction scenario for the NGC 4438/NGC 4435 system: NGC 4435 passed through the disk of NGC 4438 Myr ago at a radial distance of kpc. The encounter was rapid ( km s-1) and retrograde (see also Combes at al. 1988). With an impact parameter kpc an ISM-ISM collision is unavoidable. Its importance depends on the initial gas distributions in NGC 4435 and NGC 4438. The current extent of NGC 4435’s observed molecular gas disk is kpc. In their simulations the gas disk of NGC 4438 had an initial extent of kpc. Even with this initial extent the influence of an ISM-ISM collision on the final gas distribution and velocities is low compared to that of ram pressure stripping. NGC 4438 evolves on an eccentric orbit within the Virgo cluster. We observe the galaxy Myr after its closest passage to the cluster center ( kpc from M87). Ram pressure plays a key role for the evolution of the gaseous component of NGC 4438 together with the tidal interaction. The displacement of the line profiles to higher velocities in the southwestern region of the galaxy, the lack of CO emission in the eastern optical disk, and the presence of double line profiles in the southwest of the galaxy center are clear signs of ram pressure stripping. In the presence of a tidal interaction ram pressure stripping is more efficient, because tidal effects have moved a significant fraction of NGC 4438’s ISM to larger galactic radii where the galactic gravitational potential is weaker (see also Vollmer 2003 and Kapferer et al. 2008).
Recent deep H observations of the M 86 region (Kenney et al. 2008) revealed a highly complex and disturbed ISM/ICM. NGC 4438 is connected to M 86 by several faint H filaments. This suggests a tidal interaction between the two galaxies. Although the tidal interaction might have occured with M 86 Myr ago, strong ongoing ram pressure is still required to explain the CO(1–0) distribution and kinematics. The timescale and the relative galaxy velocities of the two scenarios (encounter with M 86 or NGC 4435) are about the same. The higher mass of M 86 compared to that of NGC 4435 allows a larger impact parameter for an NGC 4438 – M 86 encounter. Since M 86 has its own intracluster medium, the need for strong ongoing ram pressure affecting the ISM of the inner galactic disk, implies that ram pressure stripping due to M 86 certainly did not remove and might not have significantly affected the ISM of NGC 4438 in this region.
In this article we provide further evidence of ongoing strong ram pressure. In particular, we show that the warm ionized interstellar medium is stripped more efficiently than the cold dense atomic and molecular interstellar medium.
2 Observations
NGC 4438 was observed at 4850 MHz during 8 h in January 2 2006 with the Very Large Array (VLA) of the National Radio Astronomy Observatory (NRAO)111NRAO is a facility of National Science Foundation operated under cooperative agreement by Associated Universities, Inc. in the D array configuration. The band passes were MHz. We used 3C286 as the flux calibrator and 1254+116 as the phase calibrator, the latter of which was observed every 40 min. The 6 cm emission map was made using the Astronomical Imaging Processing System (AIPS) task IMAGR with ROBUST=3. The final cleaned map was convolved to a beam size of . The bright radio source M87 caused sidelobe effects enhancing the rms noise level of NGC 4438. We ended up with an rms level of Jy/beam.
The 21 cm line data were obtained on January 4, 2003 with the VLA in CS configuration as part of the VIVA survey (Chung et al. 2008). The total duration of observations was 4.8 hrs and the pointing was centered on between NGC 4402 and IC 3355 (12h26m29.4s, ), 20.7′ away from the optical center of NGC 4438. 1331+305 (3C 286) was observed every 30 minutes as a phase as well as a flux calibrator. The digital correlator of 3.125 MHz bandwidth was configured to produce 127 channels and two polarizations. Online Hanning smoothing was applied and every other channel was discarded, yielding 63 independent channels with a velocity resolution of roughly 10 km s-1.
The Hi data were reduced using AIPS. After flux and phase calibration, the continuum was subtracted by making a linear fit to the data for a range of line-free channels at both sides of the band using UVLIN. The data were imaged and cleaned using IMAGR with ROBUST=1 to maximize the sensitivity while keeping a fair spatial resolution (Briggs 1995). With our pointing center (between NGC 4402 and IC 3355), NGC 4438 is found just outside of the VLA primary beam at this wavelength, and the image cube was corrected using PBCOR for falling sensitivity at the beam edge. The total Hi map was produced by taking the 0th moment along the frequency axis. The AIPS task MOMNT creates a mask to blank the images at a given cutoff level and estimates moments on the full resolution blanked cube. In creating a mask, we applied Gaussian and Hanning smoothing spatially and in velocity, respectively, to maximize the signal-to-noise. The total Hi flux that we measure is 1.940.24 Jy km s-1, 77% of what Cayatte et al. (1990) reported from the observations centered on NGC 4438.
The 20 cm continuum map was created by averaging the line-free channels. In order to reduce the effects of interfering sources, which cause substantial sidelobes, we have used the AIPS procedure PEELR. It iteratively attempts to calibrate on multiple fields around bright continuum sources (self-calibration), subtract those fields from the self-calibrated data, undo the field-specific calibration from the residual data, and it finally restores all fields to the residual data. The same weighting scheme as the Hi map (ROBUST=1) was used for the continuum map. The 20 cm continuum map was flux calibrated using the observations of Condon (1987), i.e. the VIVA data were convolved to the resolution of Condon’s map () and the ratio of 3.9 between Condon’s and the VIVA peak fluxes of the galaxy’s central source was applied to the VIVA 20 cm map. The final cleaned map has a resolution of and an rms level of 0.2 mJy per beam.
3 Extraplanar non-thermal radio continuum emission
At 20 cm we confirm the findings of Kotanyi & van Gorkom (1983), i.e., we detect the galaxy center and the western extraplanar emission with about the same surface brightness (0.5 mJy/beam; Fig. 1b) as measured by these authors. However, the morphology of our map is different from that of Kotanyi & van Gorkom (1983). It shows an oval structure with a position angle of about .
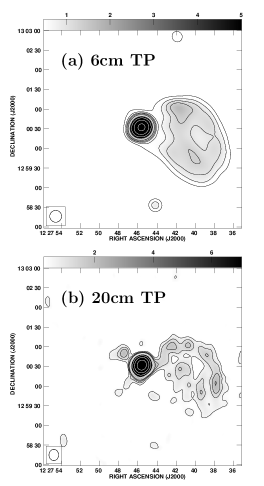
We detect the same structure at 6 cm with a comparable surface brightness (Fig. 1a). The surface brightness within the extraplanar structure only varies by a factor of 2, i.e. it is remarkably uniform. The hole in the center of the extraplanar emission might be due to emission coming from a shell rather than from a sphere.
We determine the following flux densities for the extraplanar region at 6 and 20 cm: mJy and mJy. The flux density from Condon’s 20cm image is consistent with our measurement. At 610 MHz Hota et al. (2007) found a flux density of mJy. This leads to a spectral index between 20 and 6 cm of , between 50 and 20 cm of , and between 50 and 6 cm of . The unusual shape of the spectral energy distribution, which varies too rapidly, and the high degree of polarization at 6 cm ( %; Vollmer et al. in prep.) points to a substantial missing flux density at 20 cm from large scales. This is due to missing zero-spacing information and the presence of the strong radio source M 87 close to the pointing center. If we enhance the 20 cm flux density by a factor of the spectral indices between the three frequencies all become . We thus conclude that the radio continuum emission at all observed frequencies is probably non-thermal, i.e. synchrotron emission. However, the uncertainties in the flux densities do not allow us to definitely exclude a thermal origin of the 6 cm emission.
The spectral index in the extraplanar regions typically steepens due to the rapid energy loss of relativistic electrons with high energies (aging). This is observed in NGC 4522 (Vollmer et al. 2004) and the western radio lobe of NGC 4569 (Chyzy et al. 2006). A spectral index of , as observed in the eastern radio lobe of NGC 4569, means that the relativistic electrons are re-accelerated within the extraplanar region of NGC4438, most probably in shocks induced by ram pressure at the surface of the shell. This scenario is consistent with the enhanced polarized emission at 6 cm at the outer border of the extraplanar region.
4 Multiphase ISM ram pressure stripping
In this section we compare the spatial distribution of the different ISM phases in the extraplanar region (Fig. 2). We use the following data: (i) cold molecular phase – CO, (ii) cool and warm atomic phase – Hi, (iii) warm ionized phase – H, (iv) hot ionized phase – X-rays (Machacek et al. 2004), and (v) magnetic fields and cosmic ray electrons – 6 cm radio continuum emission.
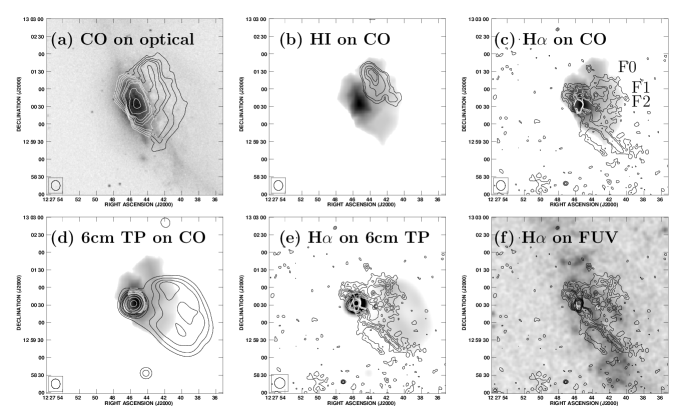
For the H emission we compare a narrow band image containing H and [Nii] emission (from Goldmine; Gavazzi et al. 2003) to the Fabry-Perot image of Chemin et al. (2005) which only contains the H line (Fig. 3). Kenney et al. (1995) describe the H filaments as extended and more diffuse than the few high-brightness H knots located west of the galaxy’s nucleus (F2). The filaments’ apparent widths range between and ( pc to 1 kpc). The emission west of the nucleus consists of two filaments F1 and F2 (Fig. 2c and Fig. 3) of high surface brightness embedded in a more irregular complex of extended emission. The part of F1 near the galaxy nucleus is extended. At the western part of F1, H blobs of higher surface brightness might indicate the presence of Hii regions. In addition, two high surface brightness filaments (F3 and F4) are located southwest of the nucleus. The high [Nii]/H ratio observed in F3 (Fig. 6 of Kenney et al. 1995) indicates that the diffuse ionized gas located in F1–F4, which have high surface brightnesses, is shock excited.
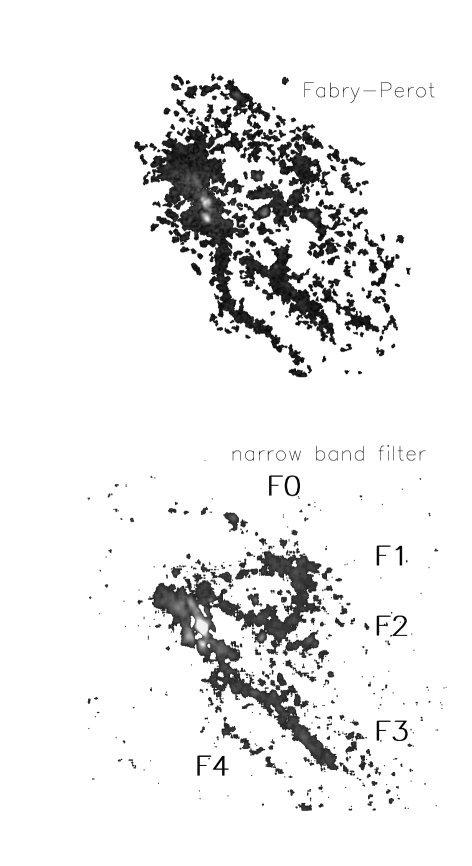
Chemin et al. (2005) detected a new H filament F0 (Fig. 3) north of the extraplanar emission observed by Kenney et al. (1995). They describe this filament as a string of H knots (probably Hii regions) embedded in faint diffuse emission. The very deep narrow band image of Kenney et al. (2008) shows these Hii regions and a very small amount of extended emission, in clear contrast to filaments F1–4. Filament F0 shows velocities close to the systemic velocity of NGC 4438. Thus, in general, the extraplanar warm ionized gas observed in H consists mainly of a diffuse phase with embedded dense Hii regions. The extended high-surface brightness gas is probably shock-excited. Future [Nii]/H line ratios of this region are needed to confirm this conclusion. Machacek et al. (2004) showed that the X-ray emission closely follows the high surface brightness H emission distribution. There is no X-ray emission associated with the H filament F0, consistent with ionization by massive stars.
The multiwavelength comparison shows the following:
-
•
Only the eastern half of the 6 cm extraplanar region is detected in H. This supports our conclusion that the 6 cm radio continuum emission is mostly non-thermal.
-
•
There is no radio counterpart of the southernmost H filament.
-
•
High surface brightness H is emitted from a region where CO and radio continuum emission overlap west of the galaxy nucleus.
-
•
The extraplanar CO emission extends ( kpc) farther to the north than the high surface brightness H and the 6 cm radio continuum emission (F0).
-
•
The northern extraplanar Hii filament F0 coincides with the Hi emission peak. There, the H velocity is consistent with the Hi velocity (Chemin et al. 2005).
-
•
The extraplanar H filament F1 does not have a FUV counterpart and Fig. 3 shows that [Nii] probably dominates the narrow-band emission.
We conclude that the northern part is different from the rest of the extraplanar region. In the former, high surface brightness Hi and faint H emission mainly in the form of Hii regions is found, whereas in the latter, high surface density H, X-ray, and 6 cm radio continuum emission is present. In addition, the H filament F1 has no FUV counterpart, i.e. it is devoid of stars younger than Myr. We attribute the extended low surface brightness H emission of F0 to star formation whereas the extended high surface brightness H emission is most probably due to shocks.
The absence of 6 cm radio continuum, extended high surface brightness H, and X-ray emission in the northern part of the extraplanar region (F0) is probably because the diffuse warm ionized and magnetic fields/cosmic ray electrons are stripped more efficiently than the warm and cold dense neutral gas traced by CO and Hi emission. The Hi and faint H emission in F0 might be interpreted as the outer rim of the molecular clouds which are exposed to the radiation field of the galaxy (UV) and the intracluster medium (X-rays). This leads to the formation of ionized rims and photodissociation regions where atomic hydrogen can be found. In this scenario, the ionized and neutral gas is physically linked to dense gas and should show the same kinematics as the molecular gas. This is true for the H and Hi emitting gas (Chemin et al. 2005) and for the H and CO emitting gas (Sect. 5). On the other hand, the H filament F1 whose eastern part close to the galaxy nucleus is devoid of Hii regions might not be linked to dense gas. If the diffuse warm ionized gas is of low density ( cm-3 instead of cm-3 for the neutral gas) we expect it to be stripped more efficiently by the intracluster medium ram pressure. In this case the H kinematics should be different from the CO kinematics. This will be investigated in the next section.
5 Kinematic evidence of more efficient stripping of ionized gas
To investigate our hypothesis of more efficient stripping of the diffuse ionized phase of the ISM, we compare CO(1-0) and H kinematics. We took the CO(1-0) spectra with a resolution of from Vollmer et al. (2005). Since the H Fabry-Perot data cube of Chemin et al. (2005) is contaminated by night sky line emission, we reconstructed for each CO(1–0) position an H spectrum using the first and second moment maps of the Fabry-Perot data and assuming a constant linewidth of km s-1. The overlays of all CO(1–0) with the regenerated H spectra are shown in Fig. 4.

In general, there is good agreement between the CO(1–0) and H line profiles. In particular, the double line profile which is characteristic of ram pressure stripping and which is detected in position is also present in H (Fig. 4).
To determine a unique velocity difference between the H and CO(1–0) spectra we determined the differences between (i) the maxima and (ii) the barycenters of the lines. We then conservatively took the smallest velocity difference. In Fig. 5 we show these differences on the CO(1–0) emission map.
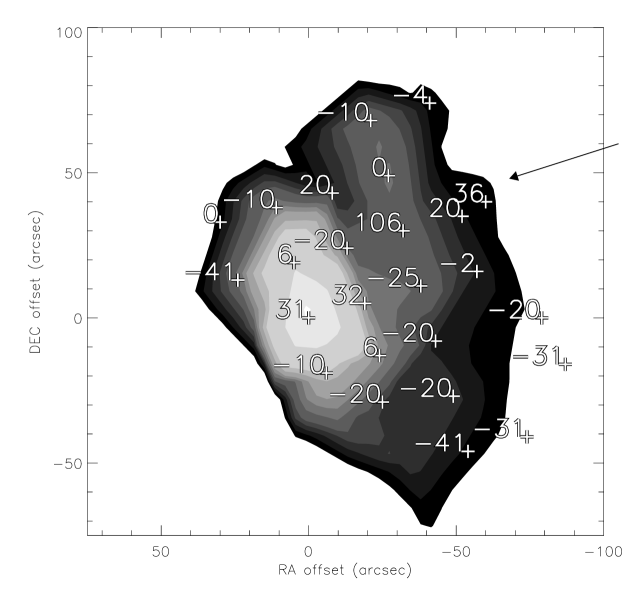
In the galactic disk the relatively high velocity differences of and km s-1 are not reliable due to the complex line profiles and effects of H absorption (see Fig. 4). In the other regions, the absolute of the velocity difference do not exceed km s-1 except in a region northwest from the galactic nucleus which corresponds to the H filament F1 indicated with an arrow on Fig. 5. These three spectra are shown in Fig. 6.

Whereas the velocity difference is small at it is somewhat higher than average ( km s-1) at and unusually high ( km s-1) at . At the latter position, there is also a weak H line associated with the CO(1–0) line. The high H velocity at can be seen as an extraplanar violet region in the H velocity field (Fig. 2 of Chemin et al. 2005). The velocity difference is positive, i.e. towards the velocity of the Virgo cluster ( km s-1). Therefore, this provides more evidence of our suggestion that the diffuse ionized gas in the eastern part of F1 is stripped more efficiently than the warm and cold dense neutral gas. We interpret the faint H line associated with the CO line as due to star formation. It represents a natural continuation of the faint H emission detected in F0 and is associated with the Hi emission of lower surface brightness. The large velocity difference occurs in the eastern part of F1. In the deep narrow band image of Kenney et al. (2008) its elongation is roughly east–west, the same direction as the northern very faint H filament at a declination of . This common direction corresponds exactly to the projected ram pressure wind angle in the model of Vollmer et al. (2005) and thus represents additional evidence of ongoing strong ram pressure acting on NGC 4438’s ISM.
6 A unified picture of multiphase ram pressure stripping
Whereas the origin of NGC 4438’s tidal interaction remains unclear (NGC 4435 or M 86), the interaction timescale is Myr for both scenarios. Despite this uncertainty, the CO and H distribution and kinematics are consistent with and naturally explained by strong ongoing ram pressure stripping of NGC 4438’s ISM.
Different ram pressure stripping efficiencies of different ISM phases can be understood in terms of gas column densities. The acceleration of a gas clump of surface density due to ram pressure is . The surface density of a spherical cloud of mass and radius is . Thus, when a gas clump is heated and expands at constant mass, the surface density drops and the acceleration due to ram pressure increases significantly. We think that this is the basic mechanism for the observed spatial and velocity offset between the high surface brightness H and CO(1–0) emission.
Other observations of Virgo spiral galaxies have already been interpreted in this sense:
-
•
In the northern tidal arm of NGC 4438, which is devoid of atomic gas, Vollmer et al. (2005) detected molecular gas at the velocities of the stars in the tail. These authors interpreted their finding as a decoupling of the dense molecular clouds from the ram pressure wind.
-
•
In NGC 4402 Crowl et al. (2005) observed numerous Hii complexes along the southern edge of the gas disk, possibly indicating star formation triggered by the intracluster medium (ICM) pressure. To the south of the main ridge of interstellar material, where the galaxy is relatively clean of gas and dust, 1 kpc long linear dust filaments were discovered with a position angle that matches the extraplanar radio continuum tail. One of the observed dust filaments has an Hii region at its head. These dust filaments were interpreted as large, dense clouds that were initially left behind as the low-density interstellar medium was stripped but were then ablated by the ICM wind.
-
•
The peculiar velocity of the compact extraplanar Hii region to the north of NGC 4388 (Gerhard et al. 2002) can be explained by a scenario where a stripped gas cloud decoupled from the wind, forms stars, and falls back onto the galactic disk (see Vollmer & Huchtmeier 2003).
All these observations indicate that the stripping efficiency depends on the surface density of the stripped gas clumps.
As for the ram pressure stripping of the cosmic ray gas with its associated magnetic field, the pressure based on the assumption of minimum energy is dyn cm-2 for a magnetic field strength of G. This is a factor of lower than the current ram pressure derived from the dynamical model of Vollmer et al. (2005). Therefore, the cosmic ray gas and its associated magnetic field are easily stripped together with the diffuse warm/hot ionized interstellar medium. The spatial coincidence between the H/X-ray and radio continuum emission in the eastern half of the extraplanar region tells us that the stripping efficiency for the cosmic ray gas and its associated magnetic field is not significantly different from that of the diffuse warm/hot ionized gas. This is consistent with the picture that the galactic magnetic fields are coupled to the diffuse ionized medium (Beck et al. 2005) and not to the dense neutral instellar medium. The observed velocity offset between the two gas phases cannot be explained in a scenario where the magnetic fields are anchored in the dense neutral gas and pervade the adjacent ionized gas, because the less massive ionized gas would have to follow the dense neutral gas.
Murphy et al. (2008a, 2008b) compared Spitzer m emission with 20 cm radio continuum maps. The radio-FIR correlation is used to predict the radio emission from the Spitzer m emission. They found radio deficient regions at the outer edges of the galactic disks where ram pressure is pushing the interstellar medium. Since the m dust emission is associated with molecular gas, the northern part of the extraplanar CO(1–0) emission can be qualified as radio deficient. We therefore suggest that the radio-deficient regions are due to the more efficient ram pressure stripping of diffuse ionized gas (thermal and cosmic ray gas with its associated magnetic field) with respect to the dense molecular gas.
Acknowledgements.
This research has made use of the GOLD Mine Database. This work was supported by the Polish-French (ASTRO-LEA-PF) cooperation program and by the Polish Ministry of Sciences and Higher Education grant 2693/H03/2006/31.References
- (1) Beck, R., Fletcher, A., Shukurov, A., et al. 2005, A&A, 444, 739
- (2) Boselli, A., Boissier, S., Cortese, L. et al. 2005, ApJ, 623, L13
- (3) Briggs, D.S. 1995, Ph.D. thesis, New Mexico Inst. Mining Technol.
- (4) Chemin, L., Cayatte, V., Balkowski, C., et al. 2005, A&A, 436, 469
- (5) Chincarini, G. & de Souza, R. 1985, A&A, 153, 218
- (6) Chung, A., van Gorkom, J.H., Crowl, H., Kenney, J.D.P., Vollmer, B. 2008, Frontiers of Astrophysics: A Celebration of NRAO’s 50th Anniversary ASP Conference Series, Vol. 395. Edited by Alan H. Bridle, James J. Condon, and Garteh C. Hunt., p.364
- (7) Chyzy, K.T., Soida, M., Bomans, D.J., et al. 2006, A&A, 447, 465
- (8) Combes, F., Dupraz, C., Casoli, F., & Pagani, L. 1988, A&A, 203, L9
- (9) Condon, J.J. 1987, ApJS, 65, 485
- (10) Crowl, H.H., Kenney, J.D.P., van Gorkom, J.H., Vollmer, B. 2005, AJ, 130, 65
- (11) Gavazzi, G., Boselli, A., Donati, A., Franzetti, P., Scodeggio, M. 2003, A&A, 400, 451
- (12) Gerhard O., Arnaboldi M., Freeman K.C., & Okamura S. 2002, ApJ, 580, L121
- (13) Hota, A., Saikia, D.J., & Irwin, J.A. 2007, MNRAS, 380, 1009
- (14) Kapferer, W., Kronberger, T., Ferrari, C., Riser, S., & Schindler, S. 2008, MNRAS, 389, 1405
- (15) Kenney, J.D.P., Rubin, V.C., Planesas, P., & Young, J.S. 1995, ApJ, 438, 135
- (16) Kenney, J.D.P., Tal, T., Crowl, H.H., Feldmeier, J., & Jacoby, G.H. 2008, ApJ, 687, L69
- (17) Kotanyi, C.G. & Ekers, R.D. 1983, A&A, 122, 267
- (18) Kotanyi, C., van Gorkom, J.H., & Ekers, R.D. 1983, ApJ, 273, L7
- (19) Machacek, M.E., Jones, C., & Forman, W.R. 2004, ApJ, 610, 183
- (20) Murphy, E., Kenney, J., Helou, G., Chung, A., & Howell, J. 2008a ApJ submitted; eprint arXiv:0812.2922
- (21) Murphy E.J., Kenney J.D.P., Helou G., et al. 2008b, to appear in the proceeding from ”The Evolving ISM in the Milky Way and Nearby Galaxies”, eprint arXiv:0802.2281
- (22) Vollmer, B., Cayatte, V., Balkowski, C., & Duschl, W. J. 2001, ApJ, 561, 708
- (23) Vollmer, B. 2003, A&A, 404, 21
- (24) Vollmer B. & Huchtmeier, W. 2003, A&A, 406, 427
- (25) Vollmer, B., Beck, R., Kenney, J.D.P., & van Gorkom, J.H. 2004, AJ, 127, 3375
- (26) Vollmer, B., Braine, J., Combes, F., & Sofue, Y. 2005, A&A, 441, 473
- (27) Vollmer, B., Soida, M., Beck, R. et al. 2007, A&A, 464, L37