Mid-IR period-magnitude relations for AGB stars
Abstract
Asymptotic Giant Branch variables are found to obey period-luminosity relations in the mid-IR similar to those seen at (2.14m), even at 24m where emission from circumstellar dust is expected to be dominant. Their loci in the , log diagrams are essentially the same for the LMC and for NGC 6522 in spite of different ages and metallicities. There is no systematic trend of slope with wavelength. The offsets of the apparent magnitude vs. log relations imply a difference between the two fields of 3.8 in distance modulus. The colours of the variables confirm that a principal period with log 1.75 is a necessary condition for detectable mass-loss. At the longest observed wavelength, 24m, many semi-regular variables have dust shells comparable in luminosity to those around Miras. There is a clear bifurcation in LMC colour-magnitude diagrams involving 24m magnitudes.
keywords:
Stars: AGB and post-AGB, stars: variables: other, stars: mass-loss, stars: late-type, stars: fundamental parameters1 Introduction
The existence of near-infrared period-luminosity relations in LMC Asymptotic Giant Branch (AGB) stars is now well-known. They have also been found in the NGC 6522 Baade’s Window of the inner Bulge by Glass & Schultheis (2003) and have since been extended to globular clusters and other members of the Local Group. The LMC and the NGC 6522 fields differ markedly in metallicity but contain large numbers of stars at approximately uniform distances, making them highly suitable places for studying population differences.
Among the AGB stars, many of the semi-regular variables have small amplitudes so that, in contrast to the Miras, they can reveal useful distance information from single-epoch observations if their periods are otherwise known. Infrared studies have the additional advantage that the effects of interstellar absorption are minimized; in the mid-IR can be as low as mag.
Examination of the period-luminosity relations of AGB stars offers the possibility of gaining insight into the physics of their outer atmospheres. Many of the semi-regulars exhibit multiple periodicities. The principal peaks in their periodograms lie in the range 10-200 days, usually accompanied by other peaks within a factor of two in period and sometimes with additional periods about 10 times as long as the principal ones. The origin of the long periods is not yet understood. At least one case is known in which a variation of this kind starts as a momentary decrease in amplitude and develops in width over subsequent cycles (Blanco 26; see Glass & Schultheis, 2002).
One of the most important aspects of the long-period variables is their high mass-loss rates. Though Mira variables are major contributors of matter to the interstellar medium, the ISOGAL survey in the galactic plane (Omont et al 2003), which made use of the ISO infrared satellite, showed that many other late-type giants also shed large quantities of dust. The [7] - [15] vs [15] colour-magnitude diagrams that resulted from ISOGAL show a continuous distribution of mass-losing stars from the ‘blue’ end of the colour range to the ‘red’ (Glass et al. 1999). Because these stars are comparatively numerous they rival the Miras in their total dust output. Using an objective prism survey of the NGC 6522 field by Blanco (1986) it was possible to show that the mass-losing stars are all giants of later spectral type than about M5 (Glass & Schultheis 2002). Moreover, thanks to variability data generated as a by-product of the MACHO, OGLE and similar gravitational-lensing experiments, it is also known that they are nearly all semiregular variables, with the addition of a few Miras (Glass & Alves 2000; Alard et al. 2001; Glass & Schultheis 2002).
The Spitzer infrared satellite has now surveyed the Large Magellanic Cloud (SAGE; Meixner et al. 2006) and the NGC 6522 field111As part of the programme ID 2345: ‘A Spitzer Survey of Mass Losing Stars in the Galactic Bulge’, P.I. R. Sahai at mid-infrared wavelengths with sensitivities unobtainable from the ground. Each of these surveys used the IRAC camera at 3.6, 4.5, 5.8 and 8 m and the MIPS camera at 24 m. The SAGE data have been publicly released; the NGC 6522 data were reduced by M. Stute (Uttenthaler et al., in preparation). Because the NGC 6522 field has been so well studied in the past, it was an obvious candidate for a Spitzer survey. It has importance as a fiducial field for application to more heavily extincted areas of the inner Bulge where visible region data are impossible to obtain.
Schultheis, Glass and Cioni (SGC2004) compared the properties of AGB stars in the Milky Way galaxy and Magellanic Clouds. In summary, they formed complete samples by selecting all stars with –5.0 in the relevant areas from the 2MASS Catalog. This limit is about 1.5 mag below the tip of the RGB. The objects they found were carefully cross-identified with the MACHO survey at and . Each MACHO light curve was Fourier analysed to yield its periods and associated amplitudes. The sizes of the two fields of interest in this study, NGC 6522 at 1032 arcmin2 and the LMC at 271 arcmin2, were chosen to yield about 1800 stars from each. The objects were also investigated using 7 m and 15 m photometry from ISO, where available. However, the Spitzer instruments now offer high photometric precision at the faint end and therefore the possibility of continuing the ISOGAL study to stars with lower mass-loss rates. Spitzer also extends the long-wavelength end of the survey from 15 to 24 m, where radiation in excess of that expected from the photospheres should be more clearly apparent.
2 The data
The NGC 6522 and LMC fields discussed here using Spitzer data are sub-fields of those investigated by SGC2004. In the current work, the NGC 6522 vs. MACHO and LMC vs. MACHO lists from SGC2004 were cross-identified with the Spitzer photometry. The IRAC and MIPS fluxes were converted into magnitudes by taking zero-points in the 3.6, 4.5, 5.8, 8 and 24 m bands of 2.809 , 1.797 , 1.15 , 6.41 and 7.14 Jy respectively. The reddening of the NGC 6522 field was assumed to be .
The distance modulus (dm) for the LMC was taken to be 18.5. Following trials of several values for the dm of the NGC 6522 field, 14.7 was adopted (see section 3).
In the LMC our survey covers about 0.00154 times the area of SAGE (Blum et al 2006). Because we only discuss objects listed in the MACHO survey, a number of very red objects detected by Spitzer do not appear in our lists. They range in 24m magnitude from 8.5 to 15.3 and in [3.6] – [24] colour from 4.1 to 9.0. Many of them may be AGB stars with circumstellar shells thick enough to depress their and fluxes to levels below the MACHO detection threshold. At least two objects more luminous than typical AGB stars are present in our sample. One is a listed supergiant (WOH S 286). The most apparently luminous of all, at = –15.25 is an H object (LHA 120-N 132E) which has a MACHO counterpart with log = 2.661 (it is too bright to appear in Fig 1). It should be mentioned, in view of the comparisons we make, that Uttenthaler et al. (in preparation) have reduced the SAGE data using their methods and find no systematic differences with the results of Blum et al (2006).
The NGC 6522 field does not contain any objects more luminous than the Miras nor, unlike the LMC, does it possess any AGB stars with carbon chemistry. Saturation (the criterion being that the aperture and PSF fluxes disagree at 7% level) sets in at 320, 330, 2300 1200 and 220 mJy for the IRAC/MIPS bands, corresponding at dm = 14.7 to magnitudes of –7.34, –7.86, –10.45, –10.36, –3.98. Thus measurements of the brighter stars of the NGC 6522 field in the [3.6] and [4.5] bands, though included in the diagrams, are likely to be somewhat affected.
We have included a number of AGB stars from the Solar Neighbourhood for comparison. Because local AGB giants are too bright to be measured by Spitzer, synthetic IRAC photometry of a number of them has been derived by Marengo, Reiter and Fazio (2008) from ISO-SWS spectra. Periods for these, where available, have been taken from the GCVS as they stand. Hipparcos (The New Reduction) parallaxes (post-September 2008) were obtained from the CDS. Only stars with parallaxes 5 have been included. Most of the stars that satisfied this criterion are M-type; only two C stars appear.
3 Period-magnitude diagrams
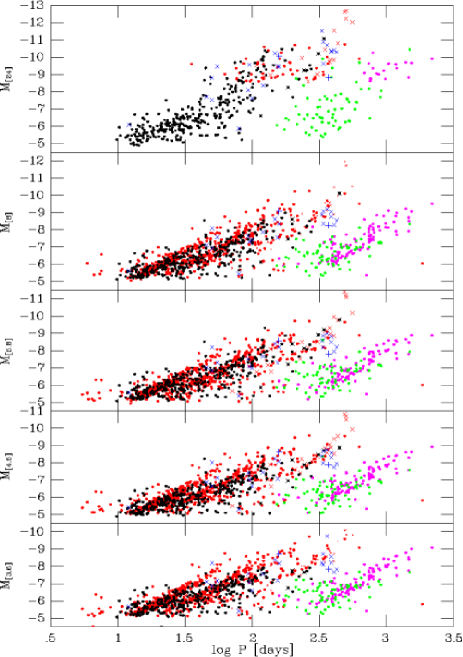
Figure 1 contains the five vs. log diagrams for the two fields, superimposed to show their essential similarity. Dots correspond to the dominant periods. Miras are stars with MACHO amplitudes 1.0. Note that the scatter in absolute magnitudes due to depth effects is much greater in the NGC 6522 than in the LMC field.
Versions of Fig 1 were prepared for several different values of the dm of the NGC 6522 field and compared visually. The fit of the shortest-period SRVs to the corresponding sequence in the LMC appeared to be the clearest discriminant and was best with dm = 14.7 to 14.8. Increasing or decreasing the dm by 0.1 mag produced noticeable deviations. This value appears to be similar to other determinations of the distance modulus of the Galactic Centre based on AGB stars but is higher than those found using other objects and methods. Groenewegen, Udalski & Bono (2008) summarize the current position and find dm = 14.50 based on RR Lyrae variables and Population-II Cepheids. No clear explanation for this discrepancy has yet emerged. It can be remarked that, because they are infrared-based, the AGB-based determinations should be largely unaffected by interstellar reddening.
The five Spitzer period-magnitude diagrams clearly show that the sequences seen in the , log diagrams by SGC2004 also appear at longer wavelengths, though the LMC sample is limited at [24] by the sensitivity of MIPS to brighter than –9. In spite of the presence of dust shells around the longer-period stars at this wavelength, there is still some tendency towards a relation. The fluxes from the shorter-period variables remain photospheric. From to 8 m essentially the same – log sequences are repeated. Though SGC2004 presented a [7] vs log diagram and suggested that the sequences may persist at this wavelength, they were not as obvious as here due to the smaller numbers of stars, the limited depth of the photometry and possibly higher scatter in the colours.
As expected from theoretical models, the LMC stars, being of lower metallicity, tend to reach higher luminosities than the galactic ones. This effect was previously remarked on by SGC2004 for the band. Groenewegen and Blommaert (2005) point out also that the LMC contains higher mass stars than the NGC6522 field. There are many additional subtle differences between the , log relations which are unfortunately difficult to quantify because of the increased scatter due to depth effects in NGC 6522.
In the case of the Solar Neighbourhood sample, 24m magnitudes are not available and absolute 25m magnitudes derived from IRAS are plotted instead.
3.1 Slopes of the relations
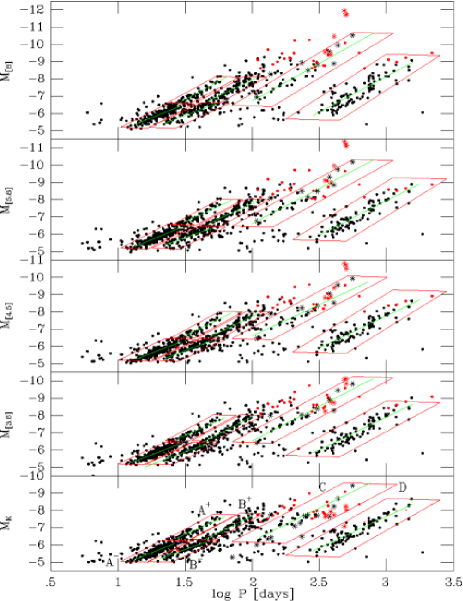
In order to determine whether the slopes of the period-magnitude relations change with wavelength, straight lines were fitted to several of the sequences visible in Fig. 1. The periods were assumed free of errors. The nomenclature of the sequences is based on that of Ita et al. (2004). Only the LMC data were used for this part of the investigation since they show the clearest separations. Not all of Ita’s sequences are separate enough to include in this analysis. Even among those that are included, B+ and B- are rather poorly defined and may be contaminated. The parts of period-magnitude space used for fitting are shown in Fig. 2 and the results are given in Table 1. The vs. data for LMC stars given by SGC2004 have been included in the analysis for completeness.
As in Fig. 1, stars with MACHO amplitudes greater than 1.0 were taken to be Miras. This level was chosen to include carbon Miras, which tend to have lower amplitudes than M-types (see e.g. Glass & Lloyd Evans 2003). Most Miras fall in the C region, though smaller amplitude stars are also included. Objects with were assumed to be carbon stars (though this is not an infallible criterion) and were not included in the linear fits. Previous work such as that of Glass et al. (1987) and Feast et al. (1989) suggested that O- and C-type Miras obey essentially the same relations at , though differing at and and consequently in . The carbon Miras in Fig. 2 seem to lie below the M-star linear fit at but to be above it at longer wavelengths. However, it should be noted that the sample is a small one and that the and IRAC data were not taken simultaneously.
Table 1 shows that the stars show little scatter () around the derived period-magnitude relations, especially in the A and B sequences. The SRVs of these sequences have the smallest amplitudes; the C sequence, however, contains some large-amplitude variables (Miras) and can be expected to show more scatter.
For each of the sequences A+, A-, B+, B-, C and D there is no systematic change in slope with wavelength.
| Seq. | Slope | Const. term | No | |
| -band | ||||
| A- | -3.11.11 | -1.67.14 | 214 | 0.13 |
| A+ | -3.46.19 | -1.43.29 | 67 | 0.15 |
| B- | -2.78.14 | -1.57.22 | 96 | 0.14 |
| B+ | -3.85.16 | 0.19.29 | 70 | 0.13 |
| C | -3.56.29 | 0.86.66 | 34 | 0.29 |
| D | -3.61.18 | 3.20.51 | 90 | 0.29 |
| 3.6m band | ||||
| A- | -2.99.10 | -1.99 .14 | 207 | 0.13 |
| A+ | -3.50.19 | -1.58 .29 | 59 | 0.14 |
| B- | -2.89.17 | -1.56 .26 | 89 | 0.15 |
| B+ | -4.05.17 | 0.17 .31 | 76 | 0.15 |
| C | -4.00.26 | 1.46 .59 | 40 | 0.29 |
| D | -3.78.19 | 3.44 .53 | 88 | 0.30 |
| 4.5m band | ||||
| A- | -2.95.10 | -1.92 .13 | 240 | 0.14 |
| A+ | -3.75.25 | -1.00 .39 | 48 | 0.16 |
| B- | -2.90.17 | -1.42 .26 | 109 | 0.17 |
| B+ | -3.81.17 | -0.14 .31 | 72 | 0.14 |
| C | -3.62.25 | 0.63 .56 | 43 | 0.31 |
| D | -3.74.19 | 3.43 .54 | 89 | 0.30 |
| 5.8m band | ||||
| A- | -3.22.11 | -1.68 .14 | 230 | 0.14 |
| A+ | -3.58.20 | -1.36 .32 | 53 | 0.14 |
| B- | -2.71.18 | -1.74 .28 | 101 | 0.18 |
| B+ | -3.67.20 | -0.46 .36 | 83 | 0.19 |
| C | -4.08.25 | 1.542 .57 | 41 | 0.30 |
| D | -3.98.21 | 4.01 .58 | 87 | 0.33 |
| 8m band | ||||
| A- | -3.11.13 | -1.87 .17 | 184 | 0.15 |
| A+ | -4.21.23 | -0.50 .36 | 49 | 0.14 |
| B- | -2.80.17 | -1.72 .26 | 92 | 0.17 |
| B+ | -3.75.21 | -0.44 .39 | 71 | 0.17 |
| C | -4.35.26 | 1.98 .58 | 36 | 0.28 |
| D | -4.15.25 | 4.32 .68 | 86 | 0.38 |
Note: ‘No’ is number of stars in sample.
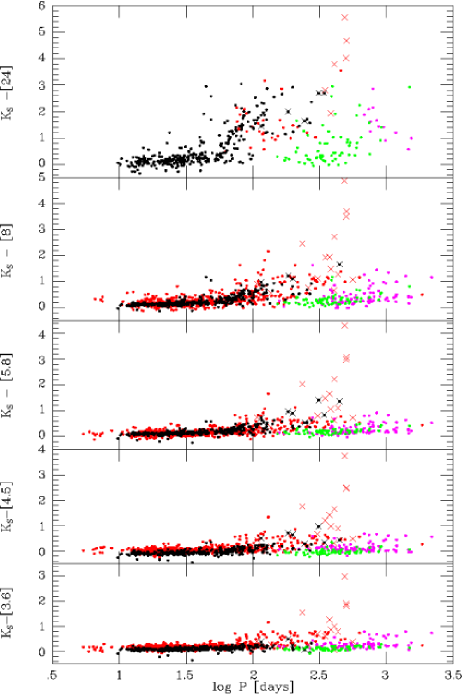
4 Period-colour diagrams
The colours of the samples are plotted against the principal and the very long periods in Fig. 3. The most conspicuous trend is noticed in the log vs. - [24] diagram, where the SRVs show a very sharp onset of excess radiation at 60d. This is, in effect, an exaggerated version of what is seen in the 15m excess vs. log diagram of Alard et al. (2001). Noteworthy again is the tendency for many SRVs to have very red infrared colours, comparable to, or even greater than, those of the shorter-period Miras. It should be noted, however, from Fig 1 that they are not necessarily as luminous.
The SRVs with secondary very long periods show clear evidence, particularly at 24 m, for the existence of dust shells. Unfortunately, the LMC sample is limited to the most luminous cases by the sensitivity of MIPS.
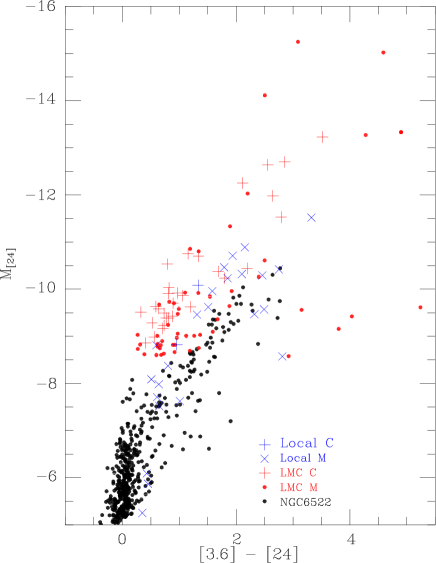
5 The [3.6] – [24] vs. colour-magnitude diagram
In this diagram (Fig 4), AGB stars from both the LMC and NGC 6522 fields are shown, together with the local sample. As earlier, LMC stars with are taken to be C-type and the remainder M-type.
The LMC points (red) are conspicuously bifurcated in the range –8.5 [24] –11. Those on the right side of the fork (redder colours) are mainly O-rich and comparable in position to the NGC 6522 stars. The left fork contains many carbon stars.
The carbon stars are clearly separated from oxygen-rich ones in the sense of being less red in [3.6] – [24] colour for a given . A similar effect is seen whichever – [24] colour is used on the abscissa but not if say is used as the ordinate instead of . Though the difference may arise in part from the higher luminosities of the carbon stars, there is a lack of emission from carbon-rich dust in the region covered by the 24m band. The IRAS [25] – [60] vs. [12] – [25] colour-colour diagram (e.g. van der Veen and Habing, 1988) shows quite clearly that galactic C-rich stars separate from O-rich ones at 25m. In the latter case, this part of the spectrum corresponds to the broad 18m silicate feature.
A similar trend was previously observed by SGC2004 in ISO data. In their work, only 7 and 12m photometry was available for the Magellanic Clouds and 7 and 15m for the NGC 6522 field. The present use of identical bands obviates any suggestion that the difference between the two fields arises from the different spectral responses of ISO in the 12 and 15m bands.
Again, for local AGB stars, 25m magnitudes from IRAS have been used. These objects appear to lie slightly to the left of their NGC 6522 counterparts. It is not clear whether this is due to the use of the IRAS [25] band instead of the MIPS [24], to a calibration error or to a truly physical effect such as higher luminosities in the Marengo et al. (2008) sample. The two local C stars lie to the left of the M stars; larger samples would of course be required to confirm this result.
A recent study of variables found by comparing two epochs of the entire SAGE survey (Vijh et al. 2008) presents a [24] vs. [4.5] - [24] magnitude-colour plot (their Fig. 4). This is, however, dominated by the class of ‘extreme AGB stars’; SRVs would occupy mainly the bottom left corner (low-luminosity and moderately red variables) and would be extremely numerous if all were detected.
6 Acknowledgments
We thank Dr. M. Marengo for providing us with his detailed synthetic photometry results. We acknowledge the use of the Simbad and Vizier on-line resources of CDS, Strasbourg. ISG’s travel was supported by the CNRS/NRF agreement. Dr. M. Groenewegen kindly commented on an earlier version of the ms.
MSt is supported by the European Community’s Marie Curie Actions - Human Resource and Mobility within the JETSET (Jet Simulations, Experiments and Theory) network under contract MRTN-CT-2004 005592. The data reduction of the NGC6522 Spitzer data was carried out by MSt in collaboration with RS at the Jet Propulsion Laboratory, California Institute of Technology, under a contract with the National Aeronautics and Space Administration. RS received partial support for this work through JPL/Caltech Spitzer Space Telescope GO award MN0710076.
References
- [] Alard C. et al, 2001, ApJ, 552, 289
- [] Blanco V.M., 1986, AJ, 91, 290
- [] Blum R.D. et al, 2006, AJ, 132, 2034
- [] Feast M.W., Glass I.S., Whitelock P.A., Catchpole R.M., 1989, MNRAS, 241, 375
- [] Glass I.S. et al, 1999, MNRAS, 308,127
- [] Glass I.S., Alves D.R., 2000, In ISO Surveys of a Dusty Universe, eds Lemke D. Stickel M. Wilke K., Springer Lecture Notes in Physics 548.
- [] Glass I.S., Catchpole R.M., Feast M.W., Whitelock P.A., Reid, I.N., 1987, in Kwok S., Pottasch S. (eds), Late Stages of Stellar Evolution, Reidel, Dordrecht
- [] Glass I.S., Lloyd Evans T., 2008 MNRAS, 343, 67
- [] Glass I.S., Schultheis M., 2003, MNRAS, 345, 39
- [] Glass I.S., Schultheis M., 2002, MNRAS, 337, 519
- [] Groenewegen M.A.T., Blommaert J.A.D.L., 2005, A&A, 443, 143
- [] Groenewegen M.A.T., Udalski A., Bono G. 2008, A&A, 481, 441
- [] Ita Y. et al, 2004, MNRAS, 353, 705
- [] Marengo M., Reiter M., Fazio G.G., 2008, AIP Conference Proceedings, 1001, 331
- [] Meixner M. et al, 2006, AJ, 132, 2268
- [] Omont A. et al, 2003, A&A, 403, 975
- [] Schultheis M., Glass I.S., Cioni M.-R., 2004, MNRAS, 427, 945 (SGC2004)
- [] Van der Veen W.E.C.J., Habing H., 1988, A&A, 194, 125
- [] Vijh U.P. et al, 2008, arXiv 0811-0408v1