Conductance Anomaly and Fano Factor Reduction in Quantum Point Contacts
Abstract
We report an experimental study on the shot noise as well as the dc transport properties of a quantum point contact (QPC) whose conductance anomaly can be tuned electrostatically by the gate electrodes. By controlling the single QPC so that it has no anomaly or an anomaly at , or (), we prove that the anomaly always accompanies the Fano factor reduction due to the asymmetric transmission of the two spin-dependent channels for the conductance lower than . For the QPC tuned to have the anomaly at the channel asymmetry is found to be as large as 67 % with the spin gap energy gradually evolving as the conductance increases.
pacs:
73.50.Td,73.23.-b,73.23.AdThe conductance of electron () through a quantum point contact (QPC) is a beautiful manifestation of the Landauer formula WeesPRL1988 ; WharamJPC1988 . Just before the pinch-off only the transmission of the last conducting mode () contributes to the conductance resulting in , where . In spite of a naive expectation that monotonously behaves as a function of the opening of QPC, there often appears a shoulder structure (“anomaly”) at ThomasPRL1996 . A number of conductance measurements have suggested that this “0.7 anomaly”, which may appear between at and at , is caused by the lifting of the spin degree of freedom even in a zero magnetic field ThomasPRL1996 ; ThomasPRB1998 ; KristensenPRB2000 ; CronenwettPRL2002 ; RochePRL2004 ; DiCarloPRL2006 , while its microscopic origin remains to be clarified in spite of intensive theoretical efforts WangPRB1996 ; BruusPE2001 ; MeirPRL2002 ; MatveevPRL2004 ; ReillyPRB2005 ; RejecNature2006 ; GolubPRL2006 ; LasslPRB2007 ; SzaferPRL1989 . When the spin is explicitly taken into account, the Landauer formula for the last conducting mode yields , where is the transmission of the last channel with spin (). The above argument means that the single particle picture that does not hold true in the anomaly case so that two spin-dependent channels asymmetrically contribute to the conductance to cause the anomaly. The conductance measurement alone, however, is not sufficient to address this issue as it only gives the averaged transmission.
The quantum shot noise is a powerful probe to provide more detailed information on the transmission as it results from the partition process of electrons BlanterPR2000 . When the DC current is fed to QPC the shot noise yields the current fluctuation in the zero-temperature zero-frequency limit, where is the Fano factor to characterize the above partition process. The mesoscopic scattering theory BlanterPR2000 predicts for and therefore simply equals when the spin is degenerated. While the pioneering works ReznikovPRL1995 ; KumarPRL1996 ; LiuNature1998 including recent ones GershonPRL2008 ; HashisakaPRB2008 overall confirmed the theory LesovikJETP1989 ; ButtikerPRL1990 ; MartinPRB1992 , some recent measurements RochePRL2004 ; DiCarloPRL2006 reported that is smaller than this value at the 0.7 anomaly. This is clear evidence of the asymmetric contribution of the two spin-dependent channels to the conductance and the shot noise, because the inequality always holds for RochePRL2004 ; DiCarloPRL2006 . In other words, the channel asymmetry is finite. Although here the electron correlation is only included in the Hartree-Fock level in the framework of the Landauer-Büttiker formalism, the Fano factor reduction due to the asymmetry serves as an important signature of the correlation. While the recent first-principle calculation successfully proves a finite asymmetry for the QPC with a given potential shape RejecNature2006 , there have been no experiments to address how large it can be depending on the actual potential shapes of QPC.
Here we report an experimental study on the relation between the Fano factor reduction and the conductance anomaly. By using the QPC whose anomaly can be tuned between at and electrostatically, we show that the conductance anomaly accompanies with the Fano factor reduction and the zero-bias peak in the differential conductance. We also show that when there is no anomaly, the Fano factor perfectly agrees with the conventional shot noise theory. The asymmetry and the spin gap between the spin-dependent channels of QPC when are discussed.
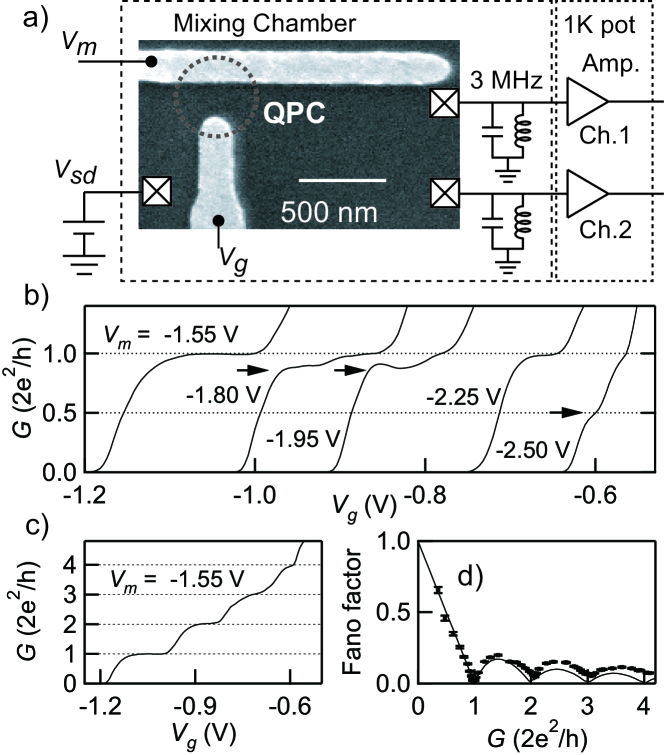
Figure 1a shows the scanning electron micrograph of our QPC fabricated on the two-dimensional electron gas (2DEG) in the AlGaAs/GaAs heterostructure and the experimental setup for the shot noise measurement. The current fluctuation at 3.0 MHz defined by the resonant (inductor-capacitor) circuit is measured through the home-made cryogenic amplifier to obtain the shot noise DiCarloPRL2006 ; HashisakaPRB2008 . To increase the resolution of the noise spectrum, the cross-correlation technique is used RochePRL2004 ; KumarPRL1996 with two sets of the resonant circuit and the amplifier DiCarloPRL2006 . The experiment was performed in the dilution refrigerator whose base temperature is 45 mK and the electrical temperature () in the equilibrium states was calibrated to be 125 mK by measuring the thermal noise. A slight magnetic field (0.2 T) was applied perpendicular to the 2DEG as performed before CronenwettPRL2002 ; DiCarloPRL2006 ; KumarPRL1996 .
The present QPC is defined by the main gate and the side gate to which the voltages and are applied, respectively (Fig. 1a). By modifying the two gate voltages the curvature of QPC is varied; when is negatively large, the constriction potential of QPC has a large curvature with small and vice versa. Figure 1b shows the QPC profile as a function of for several ’s. In going from the small curvature ( V) to the large one ( V), the conductance plateau becomes shorter as expected from the saddle point model for QPC ButtikerPRB1990 . While there is no anomaly for and -2.25 V, an anomaly appears at V and -1.95 V around and at V around .
The current fluctuation at the source-drain voltage () was analyzed based on the following formula BlanterPR2000
| (1) |
where is the Boltzmann constant. For example, the obtained Fano factor as a function of the conductance for V, where the four conductance plateaus are clearly observed (Fig. 1c), is plotted in Fig. 1d. The result satisfactorily agrees with the standard theory of the quantum shot noise expected for a simple QPC BlanterPR2000 ; ButtikerPRL1990 ; CommentOnHeating .
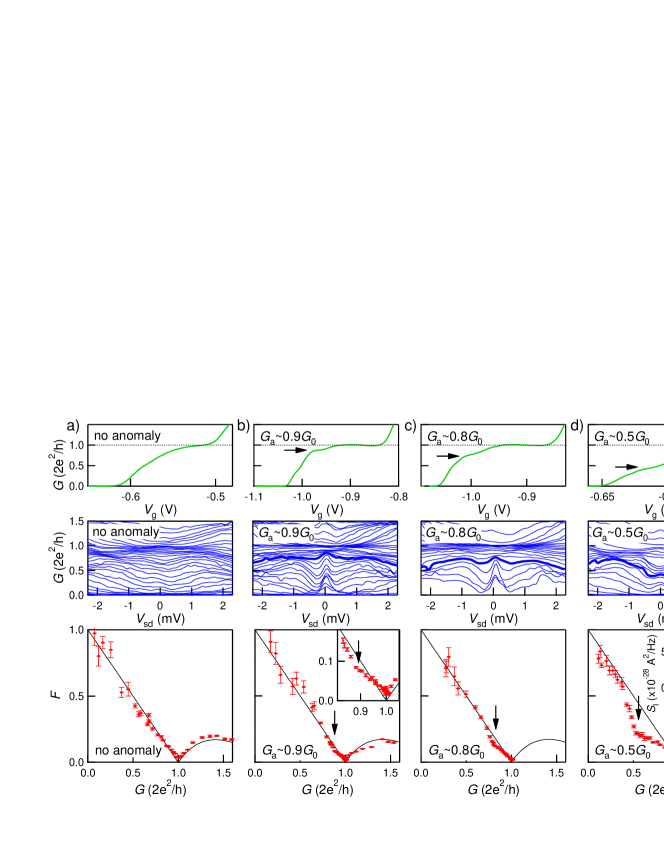
From now on we focus ourselves on the four kinds of conductance profiles obtained for the present QPC by varying ; the QPC with “no anomaly”, the ones with the anomaly at , at and at as shown in solid curves in the top panels of Figs. 2a, 2b, 2c, and 2d, respectively. In the middle panels are shown the corresponding differential conductance plots obtained at finite for different ’s. The Fano factor as a function of is plotted in points for the four cases in the bottom panels of Figs. 2a, 2b, 2c, and 2d. In all four cases, not only the conductance quantization is observed but also the Fano factor is very close to zero at , which ensures that only the last conducting mode contributes to the conductance when .
For the “no anomaly” case shown in Fig. 2a, the conductance profile is monotonous as a function of and the differential conductance has no particular structure around mV. The Fano factor increases according to (shown in a solid line) as the conductance decreases from ; the standard shot noise theory is satisfactorily valid BlanterPR2000 ; ButtikerPRL1990 . On the other hand, for the case (Fig. 2b), the peak structure around mV appears in the non-linear differential conductance as the conductance decreases from across the anomaly at . This observation is consistent with the well-known zero-bias peak as often reported for the QPC anomaly KristensenPRB2000 ; CronenwettPRL2002 ; DiCarloPRL2006 . While the Fano factor obeys the theoretical curve (shown in a solid curve) for , it has a clear dip structure around as seen in the inset of the bottom panel of Fig. 2b. The reduction of the Fano factor at the anomaly is consistent with the previous reports RochePRL2004 ; DiCarloPRL2006 .
Importantly, a similar observation holds true for the and cases; the reduction of the Fano factor is most prominent around and the zero-bias peak in the differential conductance emerges there. Thus, the conductance anomaly, the zero-bias peak in the differential conductance and the reduction of the Fano factor are all synchronous. In the inset of the bottom panel of Fig. 2d shown is the shot noise (excess noise on top of the thermal noise) at for the case as a function of . The solid circles represent the experimental data with the fitted curve by Eqn (1). The shot noise is indeed remarkably reduced with from the theoretical value ().
By combining the results of the conductance and the Fano factor , we decompose the transmission to the two channels on the assumption that the conductance below is composed of two spin-dependent channels whose transmission are given by and ReillyPRB2005 ; DiCarloPRL2006 . In the bottom panel of Fig. 3 are shown the decomposed transmissions obtained from the data shown in Fig. 2d. The channel asymmetry is also shown in the middle panel. At the conductance plateau , the transmissions of both channels are close to unity and hence within the experimental accuracy. As the conductance decreases, the finite asymmetry occurs and takes the maximum value of 67 3 % around the anomaly . As the conductance decreases, rapidly decreases to zero again, although cannot be sufficiently precisely determined for due to the low resolution of the Fano factor at the lower conductance region. In spite of this limitation, the value as large as 67 % has enough accuracy. For the cases of (Fig. 2b) and (Fig. 2c), takes its maximum around the conductance anomaly to be 20 2 % and 26 3 %, respectively.
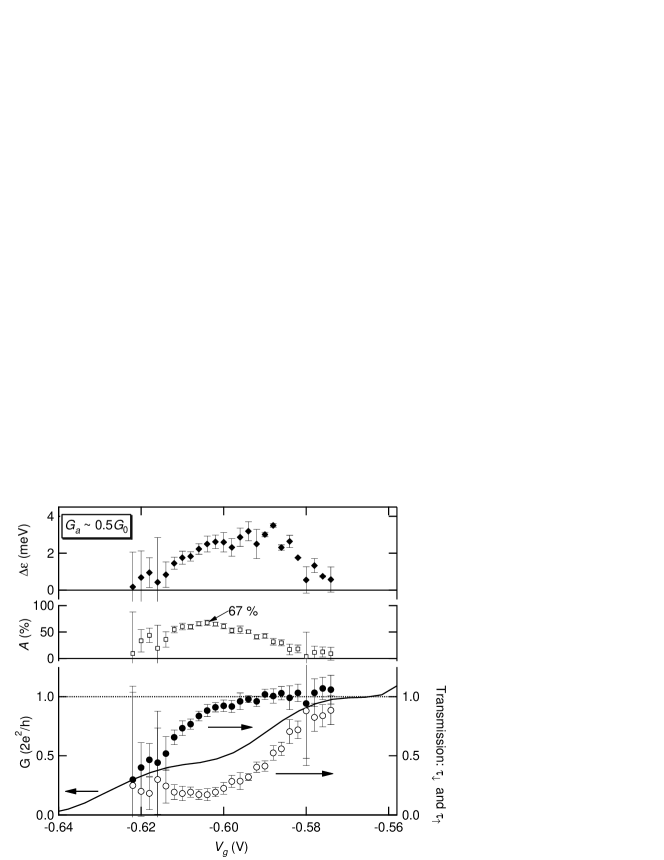
The gap energy between the two channels is estimated by assuming the energy-dependent transmission DiCarloPRL2006 , which is appropriate for the saddle point potential with the curvature parallel to the current defined by ButtikerPRB1990 ; SaddlePointNote . is obtained by fitting the conductance profile for and the energy gap is calculated from and (Fig. 3), where the lever arm extracted from the transconductance data (in the middle panel of Fig. 2d) is used to convert to the energy. The obtained is plotted in the top panel of Fig. 3. In the case ( meV), almost linearly increases as a function of from 0 meV (at ) to 3.5 meV (at ), being in agreement with the phenomenological model with the energy gap depending on the gate or the electron density ReillyPRB2005 . At , meV much larger than , which agrees with our observation that the conductance profile is only weakly dependent on the temperature below 1 K and the magnetic field below 3 T when the conductance profile has an anomaly around . In the same way meV at for the case ( meV), and meV at for the case ( meV). For comparison, meV at for the previous experiment DiCarloPRL2006 .
The obtained values of the asymmetry is remarkably large especially for the case since the similar analysis gives % at the conductance anomaly for the data reported before DiCarloPRL2006 . Some theories discuss that the QPC anomaly is attributed to the spontaneous spin polarization due to the exchange interaction in QPC WangPRB1996 ; LasslPRB2007 . If it would be the case, as is the case in QPC in the two-dimensional hole gas RokhinsonPRL2006 , the asymmetry would give the spin polarization of the electrons at QPC. In this case, 67 % is comparable to that of the typical ferromagnets like permalloy. On the other hand, other theoretical approaches BruusPE2001 ; MeirPRL2002 ; MatveevPRL2004 ; GolubPRL2006 do not require a finite magnetic moment at QPC; for example, the Kondo mechanism successfully reproduces the shot noise behavior for the 0.7 anomaly case GolubPRL2006 . To determine which the case is, the frequency dependence of the shot noise in the higher frequency range is necessary.
To conclude, we show that the anomaly accompanies the Fano factor reduction and the zero-bias peak in the differential conductance. After proving that the Fano factor is close to zero at , we discuss the asymmetric transmission of the two spin-dependent channels for . The asymmetry for the anomaly case is as large as 67 % with the spin gap energy gradually evolving from 0 to 3.5 meV as the conductance increases. Further clarification on the relation between the asymmetry and the QPC potential will open up a new strategy to tune the spin-dependent transport in low-dimensional systems.
We appreciate fruitful comments from Y. Avishai, M. Büttiker, Y. C. Chung, C. J. B. Ford, L. Glazman, R. Leturcq, T. Martin, Y. Meir, P. Roche, C. Texier, Y. Tokura, and M. Ueda. This work is supported by KAKENHI, Yamada Science Foundation, and Matsuo Science Foundation.
References
- (1) B. J. van Wees, et al. Phys. Rev. Lett. 60, 848 (1988).
- (2) D. A. Wharam et al., J. Phys. C 21, L209 (1988).
- (3) K. J. Thomas et al., Phys. Rev. Lett. 77, 135 (1996).
- (4) K. J. Thomas et al., Phys. Rev. B 58, 4846 (1998); K. J. Thomas, et al., Phys. Rev. B 61, R13365 (2000).; S. Nuttinck et al., Jpn. J. Appl. Phys. 39, L655 (2000); D. J. Reilly et al., Phys. Rev. Lett. 89, 246801 (2002); R. Crook et al., Science 312, 1359 (2006); Y. Yoon et al., Phys. Rev. Lett. 99, 136805 (2007); Y. Chung et al., Phys. Rev. B 76, 035316 (2007).
- (5) A. Kristensen et al., Phys. Rev. B 62, 10950 (2000).
- (6) S. M. Cronenwett et al., Phys. Rev. Lett. 88, 226805 (2002).
- (7) P. Roche et al., Phys. Rev. Lett. 93, 116602 (2004).
- (8) L. DiCarlo et al., Phys. Rev. Lett. 97, 036810 (2006).
- (9) C. K. Wang and K. F. Berggren, Phys. Rev. B 54, R14257 (1996); P. Jaksch, I. Yakimenko, and K.-F. Berggren, Phys. Rev. B 74, 235320 (2006); A. A. Starikov, I. I. Yakimenko, and K.-F. Berggren, Phys. Rev. B 67, 235319 (2003).
- (10) H. Bruus, V. V. Cheianov, and K. Flensberg, Physica E (Amsterdam) 10, 97 (2001).
- (11) Y. Meir, K. Hirose, and N. S. Wingreen, Phys. Rev. Lett. 89, 196802 (2002); K. Hirose, Y. Meir, and N. S. Wingreen, Phys. Rev. Lett. 90, 026804 (2003).
- (12) K. A. Matveev, Phys. Rev. Lett. 92, 106801 (2004).
- (13) D. J. Reilly, Phys. Rev. B 72, 033309 (2005).
- (14) T. Rejec and Y. Meir, Nature 44, 2900 (2006).
- (15) A. Golub, T. Aono, and Y. Meir, Phys. Rev. Lett. 97, 186801 (2006).
- (16) A. Lassl, P. Schlagheck, and K. Richter, Phys. Rev. B 75, 045346 (2007).
- (17) Although a similar structure is known to occur depending on the constriction shape of the QPC due to the resonance [A. Szafer and A. D.Stone, Phys. Rev. Lett. 62, 300 (1989)], this mechanism is not enough to explain the present anomaly problem.
- (18) Y. M. Blanter, M. Büttiker, Phys. Rep. 336, 1 (2000).
- (19) M. Reznikov, M. Heiblum, H. Shrtikman, and D. Mahalu, Phys. Rev. Lett. 75, 3340 (1995).
- (20) A. Kumar et al., Phys. Rev. Lett. 76, 2778 (1996).
- (21) R. C. Liu, B. Odom, Y. Yamamoto, and S. Tarucha, Nature 391, 263 (1998).
- (22) G. Gershon et al., Phys. Rev. Lett. 101, 016803 (2008).
- (23) M. Hashisaka et al., Phys. Rev. B 78, 241303(R) (2008); Physica Status Solidi (c) 5, 182 (2008).
- (24) G. B. Lesovik, Pis’ma Zh. Eksp. Teor. Fiz. 49, 513 (1989) [JETP Lett. 49, 592 (1989)].
- (25) M. Büttiker, Phys. Rev. Lett. 65, 2901 (1990); M. Büttiker, Phys. Rev. B 46, 12485 (1992).
- (26) Th. Martin and R. Landauer, Phys. Rev. B 45, 1742 (1992).
- (27) M. Büttiker, Phys. Rev. B 41, 7906 (1990).
- (28) The deviation of the observed Fano factor from the theory for is attributed to the electron heating KumarPRL1996 .
- (29) As the potential shape defined by the gate electrodes is smooth on 2DEG the harmonic potential approximation is expected to be valid in the present QPC to give a correct energy scale of .
- (30) L. P. Rokhinson, L. N. Pfeiffer, and K. W. West, Phys. Rev. Lett. 96, 156602 (2006); J. Phys.: Condens. Matter 20, 164212 (2008).