SUMER observations of the inverse Evershed effect in the transition region above a sunspot
Abstract
Aims. We analyse SUMER spectral scans of a large sunspot within active region NOAA 10923, obtained on 14 – 15 November 2006, to determine the morphology and dynamics of the sunspot atmosphere at different heights/temperatures.
Methods. The data analysed here consist of spectroheliograms in the continuum around 142.0 nm and in the Si iv 140.2 nm, O iii 70.3 nm, N iv 76.5 nm, and O iv 79.0 nm spectral lines. Gaussian-fitting of the observed profiles provides line-of-sight velocity and Doppler-width maps.
Results. The data show an asymmetric downflow pattern compatible with the presence of the inverse Evershed flow in a region within roughly twice the penumbral radius at transition-region temperatures up to 0.18 MK. The motions, highly inhomogeneous on small scales, seem to occur in a collar of radially directed filamentary structures, with an average width less than the 1 Mm spatial resolution of SUMER and characterised by different plasma speeds. Assuming that the flows are directed along the field lines, we deduce that such field lines are inclined by 10∘ to 25∘ with respect to the solar surface.
Key Words.:
Sun: transition region – Sun: magnetic fields – sunspots1 Introduction
One of the most peculiar spectroscopic signatures of sunspots is the observed opposite shift and/or asymmetry of spectral lines observed in (disc) centreward and limbward penumbral areas. The effect was discovered in photospheric lines by Evershed (1909a) and named after him. In the photosphere, the line shifts are, ever since Evershed, generally interpreted in terms of nearly horizontal flows directed outward from the umbra. Such flows reach speeds of a few kilometres per second and appear to be mainly associated with dark penumbral channels when observed at high () spatial resolution (e.g., Wiehr & Degenhardt, 1994; Solanki, 2003). In fact, the magnetic field topology is inhomogeneous on small scales, and the exact geometry of single flow channels is still under debate.
Evershed (1909b) also gave the first hint that the deduced direction of motion reverses its sign in the chromosphere. This “inverse Evershed effect” appears more extended than its photospheric counterpart, with radial velocities peaking beyond the external penumbral rim and with a larger vertical component (e.g., Dere et al., 1990).
The persistence of the “inverse Evershed effect” at transition-region (TR) temperatures was first observed by Nicolas & Kjeldseth-Moe (1981). Such flows have greater radial speeds, exceeding by almost one order of magnitude those observed in the chromosphere (e.g., Dere et al., 1990) and reach their maximum further out from the penumbra. In fact, due to the different scales and densities involved, and due to the oppositely directed flow, the “inverse Evershed effect” has little direct relationship with the photospheric Evershed effect. Here we use the term “inverse Evershed effect” to indicate a system of inwardly directed flows distributed all around the spot and distinct from, but not necessarily unrelated to, the strong downflows associated with sunspot plumes.
Observations with high spatial and spectral resolution in TR lines also revealed many multi-component profiles indicating supersonic downflows in sub-arc-second fine structures above umbrae (Kjeldseth-Moe et al., 1993). It is not clear whether such supersonic downflows are related mainly to sunspot plumes or (also) to the inverse Evershed flow.
In this paper, we present a series of raster scans of a large sunspot taken over a period of two days. The high spectral and spatial resolution of the data allowed us to determine the characteristics of the inverse Evershed flow in the sunspot TR. The photospheric Evershed flow of this sunspot has been studied in detail by Ichimoto et al. (2007).
2 Observations and data reduction
Raster scans were repeatedly taken by SUMER (Wilhelm et al., 1995) aboard SOHO in two spectral regions on 14 and 15 Nov. 2006, following AR 10923 from the time it crossed the central meridian to a longitude of about 15∘ West. Data were acquired with detector B and the 1″ 300″ slit. In the short wavelength scans (type N iv in Table 1), we analysed selected 0.22 nm wide spectral windows centred on the N iv 76.5 nm ( MK) and O iv 79.0 nm ( MK) TR lines.
A step of 1.5′′ was commanded after each 30 s exposure. The long wavelength (type Si iv) scans (exposure time 45 s and 1.12′′ step size) contained Si iv 140.3 nm ( MK), O iii 70.4 nm (observed in the second order of diffraction at 140.8 nm, MK), and a continuum band at 142.0 nm, which lacks any prominent emission line, both in the first and the second order (Curdt et al., 2001). Calculations by Vernazza et al. (1981) indicate that the continuum around 142.0 nm is formed in the low chromosphere at a height of roughly 200 km above the temperature minimum between the solar photosphere and chromosphere. More observational details are given in Table 1. Data were reduced by applying standard procedures from SolarSoft.
| # | type | centre/′′ | size/′′ | /∘ | (Day) time/UTC |
|---|---|---|---|---|---|
| 1a | Si iv | 90,-122 | 225300 | 8.9 | (14) 19:24-22:05 |
| 1b | N iv | 117,-122 | 300300 | 9.9 | (14) 22:26-00:56 |
| 2a | Si iv | 149,-122 | 225300 | 11.5 | (15) 01:27-04:07 |
| 2b | N iv | 185,-122 | 300300 | 12.4 | (15) 04:07-06:37 |
| 3a | Si iv | 212,-122 | 225300 | 14.0 | (15) 06:57-09:37 |
| 3b | N iv | 244,-122 | 300300 | 15.2 | (15) 10:02-12:32 |
Magnetograms and filtergrams of the observed region were obtained by MDI (Scherrer et al., 1995) aboard SOHO and SOT-SP (Tsuneta et al., 2008) aboard Hinode. The alignment between SUMER and MDI data was performed in two steps. First, the solar rotation was subtracted from the raster increment. Then, the SUMER scans in the continuum at 142.0 nm were correlated to the nearest (in time) map of the absolute magnetic flux. We estimate the final alignment to be accurate within 1′′. Finally, the SOT-SP data were aligned with MDI to within 1′′.
3 Data analysis
The aim of the observations discussed here was to obtain a high signal-to-noise ratio (S/N) in the bright structures (i.e., plages, sunspot plumes) associated with a sunspot. However, due to the strong contrast between these bright structures and the quiet areas south of the sunspot, the spectral profiles in these darker areas have a low S/N that prevents a satisfactory analysis. For this reason, the data sets were selectively re-binned. For all profiles having less than five counts at line peak (about 25 counts in the line), a box of profiles centred on the selected location was defined, and the profile was replaced by the sum of all profiles in the box having less than five counts at line top. The spectra were then fitted with a single Gaussian plus a linear background to retrieve line positions and widths. Note that radiance maps, in contrast, are at full resolution and are obtained by simple subtraction of the nearby continuum. In the case of the long wavelength scans, a 300 s full detector readout was taken directly before the scan and was used to calibrate our wavelength scale through several lines of neutral and singly ionised species that characterise the solar spectrum above 90 nm (see, e.g., Teriaca et al., 1999). However, this reference spectrum was taken over the sunspot where chromospheric flows of few kilometres per second may affect this calibration. Hence, we estimate our zero velocity to be accurate within . In the short-wavelength spectra, no calibration lines are available and the zero velocity of a line refers to its position averaged over the whole raster. We also note that the lower spectral resolving power at these wavelengths leads to larger uncertainties in the retrieved line parameters. Maps of the line width (, where is the speed of light in vacuum) were obtained (but not shown) after correcting the measured line widths for the SUMER instrumental profile111function CON_WIDTH_FUNCT_4.pro from SolarSoft..
4 Results and conclusions
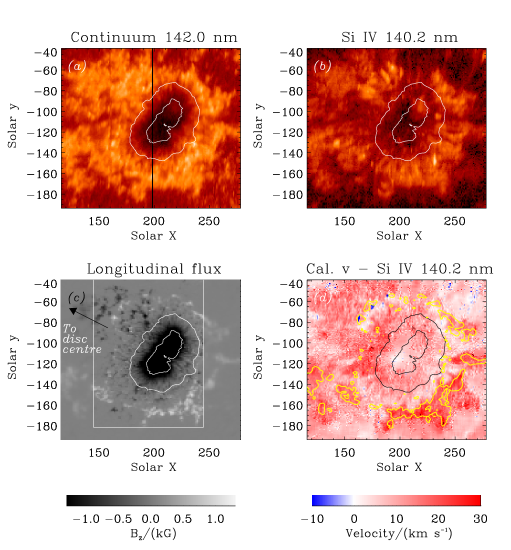
Figure 1 shows a selection of the radiance and line-of-sight (los) velocity (vlos) maps (dataset #3a).
Closer inspection of the Si iv vlos map in Fig. 1 reveals the limbward (lw) edge of the penumbral region to be less red-shifted than the centreward (cw) edge, a signature compatible with the inverse Evershed effect. The first question to consider is why we see redshifts on both the cw and lw sides of the penumbra and superpenumbra, unlike the photospheric Evershed flow (redshift on the lw side and blueshift on the cw side; e.g., Solanki et al., 2006). One important factor is that the field lines traced by the TR emission are significantly inclined with respect to the solar surface. Because our observations were carried out close to disc centre (∘), an inclination of the field lines ∘ is sufficient to show only redshift at all positions. The figure also shows that the inverse Evershed flow seems to end at patches of opposite magnetic polarity surrounding the sunspot and particularly visible on the lw side of the sunspot. The opposite polarity is actually related to strong downflows that are difficult to explain in the context of the inverse Evershed effect. (For inward flows along radially directed loops, upflows would be expected at the outer footpoints.) Although a detailed investigation requires a field extrapolation and will be part of an upcoming paper, we can already speculate that the “inverse Evershed flows” are most likely occurring along long-reaching loops that have the outer footpoints outside the penumbra, possibly outside the FOV. The emission from these long loops would dominate above the umbra and the penumbra leading to the observed inverse Evershed signature. Further out, plage emission would dominate over that of the long-reaching downflowing loops and would be characterised by the mostly redshifted emission typical of the solar TR, both quiet and active. In an active region Teriaca et al. (1999) found an average downflow of about 16 in Si iv and O iv, while a value of 17.6 was found by Achour et al. (1995) in O iv. These values compare well with the 21 downflow (practically constant through all data sets) observed in the plage area south east of the spot. The masking effect could also be enhanced by the fact that only the lower part of such loops could be cold enough to emit significantly in TR lines.
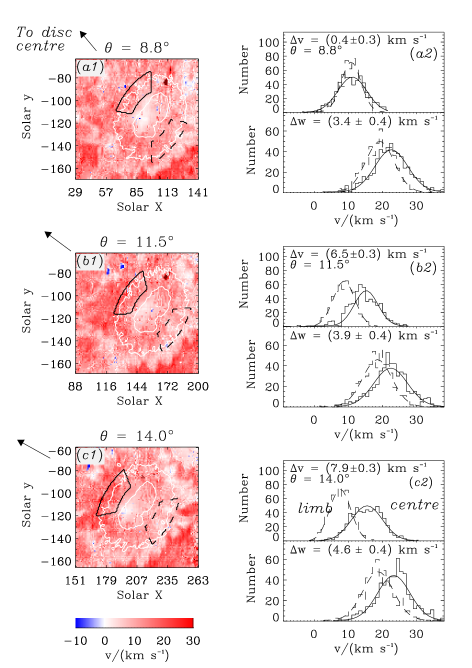
Extracts from Si iv vlos maps around the spot for datasets #1a, #2a, and #3a are shown in Fig. 2 confirming these findings and showing that the effect appears to increase with increasing angle, as expected. To study this aspect, two areas along the external part of the penumbra were selected in each vlos and line width map. As an example, for each of the Si iv vlos maps in Fig. 2, the two selected regions are outlined on panels from a1 to c1. Distributions of the Si iv vlos (top of panels a2 to c2) and line widths (bottom of panels a2 to c2) within these areas were computed for each dataset. The separation between cw and lw distributions increases with increasing angle. Figure 3 shows that the difference between the central positions of Gaussian fits to the cw and the lw vlos distributions for all lines increase, to first order linearly, as a function of .
Important is that the lw line width distributions are shifted towards smaller values than the cw distributions (Fig. 2). If is the distance between the centroids of the width distributions then, at ∘, for Si iv and for O iii. Moreover, we note in Fig. 2 that the vlos distributions are narrower on the lw side. However, the average standard uncertainties of vlos in the cw distributions are greater than those in the lw distributions (e.g., 3 versus 2.1 for Si iv) because of lower average radiances in the cw sector. This leads to greater broadening of the cw distribution. The “de-noised” widths of the vlos cw () and lw () distributions, obtained by subtracting the squared uncertainty from the squared measured distribution widths, are roughly comparable: for Si iv and for O iii (average and standard deviation of the differences at the three angular distances).
We explain these results by considering that the cw field lines form a smaller angle with the los direction than the lw field lines. We now assume that inverse Evershed motions occur along multiple thin flux tubes roughly aligned with each other (in analogy to the picture of the photospheric penumbral field, Solanki & Montavon, 1993; Schlichenmaier et al., 1998). If each of these is characterised by a different velocity, then the integral over several tubes (also along the los for an optically thin plasma) would naturally produce a broader distribution of velocities when looking at an angle closer to the main direction of the field lines. If the flux-tube diameters are smaller than the 1 Mm of the SUMER spatial resolution, then the associated sub-resolution velocity distributions contribute to the observed line widths that become larger when looking more parallel to the field lines. If the flow structures are resolved by SUMER, we expect , while we expect for unresolved structures. Our results, given above, are consistent with the second case, indicating that the inverse Evershed flow is inhomogeneous at scales below the SUMER spatial resolution of 1 Mm.

The knowledge of the absolute velocities (vlos) of Si iv and O iii allows estimating the average field inclination (see Fig. 3) that, assuming a flow velocity of 33 , results to be about 14∘ in the cw direction and 26∘ in the lw direction. The relatively large inclination at the lw side also explains why we see only reduced redshift on the lw side of the penumbra and not blueshift. The latter would eventually become visible when the spot rotates more than 26∘ away from disc centre.
These results confirm the inverse Evershed effect to be visible in the TR up to temperatures of about 0.18 MK (where O iv is formed). Its spatial extent appears to be no more than twice the penumbra for the studied sunspot and is nearly the same in all lower and mid TR lines. The flux channels have diameters on average somewhat smaller than 1 Mm and an inclination relative to the solar surface that can be estimated as about 10∘ to 25∘.
Acknowledgements.
The SUMER project is financially supported by DLR, CNES, NASA, and the ESA PRODEX programme (Swiss contribution). Hinode is a Japanese mission developed and launched by ISAS/JAXA, with NAOJ as domestic partner and NASA and STFC (UK) as international partners. It is operated by these agencies in co-operation with ESA and NSC (Norway). The authors thank H. Peter and K. Wilhelm for valuable comments and suggestions, and U. Schühle and D. Germerott for their help in acquiring the data.References
- Achour et al. (1995) Achour, H., Brekke, P., Kjeldseth-Moe, O., & Maltby, P. 1995, ApJ, 453, 945
- Curdt et al. (2001) Curdt, W., Brekke, P., Feldman, U., et al. 2001, A&A 375, 591
- Dere et al. (1990) Dere, K.P., Schmieder, B., & Alissandrakis, C.E., 1990, A&A 233, 207
- Evershed (1909a) Evershed, J., 1909a, MNRAS 69, 454
- Evershed (1909b) Evershed, J., 1909b, The Observatory 32, 291
- Ichimoto et al. (2007) Ichimoto, K., Shine, R.A., Lites, B., et al. 2007, PASJ 59, 593
- Kjeldseth-Moe et al. (1993) Kjeldseth-Moe O., Brynildsen, N., Brekke, P., et al. 1993, Solar Phys. 145, 257
- Nicolas & Kjeldseth-Moe (1981) Nicolas, K.R., & Kjeldseth-Moe O., 1981, in: The Physics of Sunspots, eds. Cram, L. E. and Thomas, J. H., pp 336
- Scherrer et al. (1995) Scherrer, P.H., Bogart, R.S., Bush, R.I., et al. 1995, Sol. Phys., 162, 129
- Solanki (2003) Solanki, S.K., 2003, A&ARv 11, 153
- Solanki et al. (2006) Solanki, S. K., Inhester, B., & Schüssler, M. 2006, Reports of Progress in Physics, 69, 563
- Solanki & Montavon (1993) Solanki, S.K., & Montavon, C.A.P. 1993, A&A 275, 283
- Schlichenmaier et al. (1998) Schlichenmaier, R., Jahn, K., Schmidt, H.U. 1998, A&A 337, 897
- Teriaca et al. (1999) Teriaca, L., Banerjee, D., Doyle, J.G. 1999, A&A 349, 636
- Tsuneta et al. (2008) Tsuneta, S., Suematsu, Y., Ichimoto, K., et al. 2008, Sol. Phys. in press
- Vernazza et al. (1981) Vernazza, J. E., Avrett, E. H., & Loeser, R. 1981, ApJS, 45, 635
- Wiehr & Degenhardt (1994) Wiehr, E., & Degenhardt, D., 1994, A&A 287, 625
- Wilhelm et al. (1995) Wilhelm, K., Curdt, W., Marsch, E., et al. 1995, Sol. Phys., 162, 189