The Near-IR Luminosity Function and Bimodal Surface Brightness Distributions of Virgo Cluster Galaxies
Abstract
We have acquired deep, H-band, imaging for a sample of 286 Virgo cluster galaxies with B mag and extracted surface photometry from optical ,,, Sloan Digital Sky Survey images of 742 Virgo Cluster Catalog galaxies, including those with H-band images. We confirm the detection of a dip in the luminosity function indicative of a discontinuity in the cluster galaxy population; the dip is more pronounced at redder wavelengths. We find, in agreement with earlier works of Tully & Verheijen and ours for Ursa Major cluster galaxies, a clear dichotomy between high and low surface brightness galaxy disks. The difference between the low and high brightness peaks of Virgo disk galaxies is 2 H-mag arcsec-2, significantly larger than any systematic errors. The high surface brightness disk galaxies have two distinct classes of high and low concentration bulges, while low surface brightness galaxies have only low concentration bulges. Early-type galaxies exhibit a similar structural bimodality though offset from that of the spiral galaxies towards higher surface brightnesses. Both the early- and late-type structural bimodalities are uncorrelated with colour or any other structural parameter except, possibly, circular velocity. Random realizations of realistic surface brightness profiles suggest that a bimodal distribution of effective surface brightness is unexpected based on normal distributions of bulge and disk parameters. Rather, the structural bimodality may be linked to dynamical properties of galaxies. Low angular momentum systems may collapse to form dynamically important disks with high surface brightness, while high angular momentum systems would end up as low surface brightness galaxies dominated by the dark halo at all radii. The confirmation of structural bimodality for gas-rich and gas-poor galaxies in the high-density Virgo cluster as well as the low-density UMa cluster suggests that this phenomenon is independent of environment.
1 Introduction
The range of surface density profiles for galaxies in a cluster is a telltale of its dynamical history. For instance, an excess of cuspy profiles over, say, the mean field galaxy distribution, is indicative of recent merger activity. Conversely, extended exponential profiles are representative of quiescent evolution over long timescales (e.g., Toth & Ostriker 1992). The study of galaxy light profiles has a rich history with seminal early contributions from de Vaucouleurs (1948; 1959), Sérsic (1968), and Freeman (1970). De Vaucouleurs (1948) established that the surface brightness (hereafter SB) profiles of early type stellar systems may follow a strongly concentrated distribution now referred to as the “de Vaucouleurs” or “” profile. De Vaucouleurs (1959) later reported the ubiquity of exponential SB profiles in disk galaxies while Sérsic (1968) proposed a generalized fitting function that encompasses the exponential and de Vaucouleurs profiles.
Based on photographic images for 36 disk and S0 galaxies, Freeman (1970) postulated that the distribution of disk central surface brightness (hereafter CSB), defined as the intercept of an exponential disk fit at , peaks at =21.65 B mag arcsec-2. Deep, wide-field CCD, galaxy surveys have since revealed a rather continuous distributions of CSBs from high surface brightness (HSB) to low surface brightness (LSB) galaxies (de Jong & Lacey 2000)111Besides the small number statistics, Freeman’s study was biased by the low threshold of photographic plates to bright galaxies.. Simulations and observations of galaxy structure have thus far suggested a continuous range of properties over, rather than fundamental departures from, the HSB and LSB regimes. However, based on near-infrared (NIR) observations of the Ursa Major (UMa) cluster, Tully & Verheijen (1997; hereafter TV97) inferred that the distribution of disk central surface brightnesses could be bimodal.
Based on a sample of 62 Ursa Major cluster galaxies observed at optical and NIR bands, TV97 argued that the distribution of disk central surface brightnesses, , was not continuous as expected from simple structure formation models, but rather bimodal. The bimodality of the distribution was not convincingly observed at optical (BRI) bands, which TV97 argued might be due to extinction effects at optical bands. At K′222The K′ filter was described by Wainscoat & Cowie (1992). It resembles the 2MASS Ks, with the primary difference being that it excludes the longest wavelength part of the K atmospheric window in order to reduce thermal emission., TV97 could assert the existence of two peaks in the SB distribution at 17.28 K′ for HSB galaxies (corresponding to “Freeman’s law”) and at 19.69 K′ in the LSB regime. The surface brightness of the gap was centered at 18.5 K′ . Inclination and extinction corrections to the optical surface brightness profiles would bring a CSB bimodality to light in these bands as well. TV97 stressed, however, that the SB bimodality at optical bands could plausibly be an artifact of their extinction correction which applies only to HSB galaxies. Still, the fact that the K′-band is nearly insensitive to dust and that the distribution of values is clearly bimodal is a strong case for TV97’s argument of structural bimodality in spiral galaxies.
TV97 divided their sample into galaxies with and without a significant near-neighbour, to identify an environmental effect. The small UMa membership however means that the isolated and crowded sub-samples contain only roughly 30 galaxies each. Despite the statistical limitations, TV97 reported evidence for an enhancement of the bimodality in the isolated sub-sample. The majority of galaxies with intermediate measurements were found to have near neighbours. This led TV97 to suggest the existence of two stable dynamical configurations of baryonic and dark matter, likely induced by the environment, leading to the distinct LSB and HSB populations.
Comparing light distributions with total mass distributions inferred from HI synthesis maps allowed TV97 to further classify these two states. In LSB galaxies, dark matter dominates the potential at all radii; gas and stars have sufficient angular momentum that they have not settled to the core and are orbiting in response to the dark matter distribution. In HSB galaxies, baryonic matter has dissipated its energy and transferred angular momentum sufficiently to become self-gravitating over the central exponential disk scale lengths (Courteau & Rix 1999; Dutton et al. 2007, hereafter D07). A gap between LSB and HSB galaxies may suggest that galaxies avoid a situation where baryonic and dark matter have comparable dynamical influence in the inner disk. The higher incidence of intermediate surface brightness (hereafter ISB) galaxies with near neighbors suggests that tidal influences might drive a galaxy from the LSB to the HSB state.
Although TV97’s study provided several valid arguments for a structural bimodality of cluster galaxies, it still suffered a few shortcomings. First, the UMa cluster membership is small. With only 62 galaxies, a structural study is plagued by statistical uncertainty (Bell & de Blok 2000). Second, TV97 estimated the disk central surface brightness, , by fitting an exponential profile to the outer disk in order to avoid the bulge component. The uncertainty in this “marking-the-disk” technique depends on the subjective interpretation of the bulge size and the disk fit baseline. This caveat was however examined carefully by McDonald et al. (2008) and found not to be the cause of the observed bimodality. Finally, TV97’s result could be unique to the UMa cluster and not representative of the true nature of disk galaxies in clusters or the field (de Jong & Lacey 2000). Because the UMa cluster lacks early type galaxies, the observed bimodality could simply be due to a missing morphological class of galaxies. It is, however, our impression that none of these objections are stronger or more convincing than the claim of bimodality itself, as we shall verify below for Virgo cluster galaxies.
Following the release of the Sloan Digital Sky Survey (York et al. 2000; hereafter SDSS), there have been many reports of bimodality in the distributions of galaxy color, star formation and clustering properties (Strateva et al. 2001; Blanton et al. 2003; Kauffmann et al. 2003; Baldry et al. 2004; Brinchmann et al. 2004; Balogh et al. 2004) and even reports of trimodality in galaxy concentrations (Bailin & Harris 2008). Colors, star formation and clustering of galaxies are all intimately linked with a transition baryonic (light-weighted) mass of 31010M⊙ (Kauffmann et al. 2003). Red galaxies, at the upper end of the mass scale typically have low current star formation rates and are found primarily in cluster or high-density environments, while the less massive blue galaxies have high star formation rates and are found primarily in the field (Dressler 1980). These results have catalyzed several new variants of galaxy formation models and evolution. For instance, an appealing explanation for any star formation bimodality involves two phases of gas accretion in galaxies via hot and cold modes (Birnboim & Dekel 2003; Dekel & Birnboim 2006). The hot mode is the standard picture of gas that is shock heated to the virial temperature during gravitational collapse of the gas and halo. This shock-heated gas eventually cools and settles into a galaxy (Rees & Ostriker 1977; White & Rees 1978; White & Frenk 1991). The cold mode consists of cold filaments penetrating far inside the halo (Birnboim & Dekel 2003). These can occur in low-mass halos where virial shocks are absent and cold gas is accreted quasi-spherically. For halos with larger masses, the gas is shock heated to the virial temperature everywhere except where cold, dense gas filaments penetrate the virial radius. As the mass increases, only filaments of increasingly dense cold gas can penetrate the halo without being shock-heated. Kereš et al. (2005) used semi-analytic models to predict that the transition halo mass where hot accretion becomes more efficient than cold accretion is M⊙. This concords with the transition baryonic mass, M⊙, in the color/SFR bimodality, assuming a universal baryonic to dark matter ratio of 10% (Zavala et al. 2003). Kereš et al. (2005) also found that low-mass halos in dense environments have enhanced hot accretion. The cold mode would thus apply mostly to late-type, disk galaxies while the hot mode pertains mostly to early-type, spheroidal, galaxies. This simplistic picture appears to match observations well, but realistic star formation prescriptions are needed for more robust data-model comparisons.
1.1 Plan of action
We now wish to test TV97’s claim of structural bimodality in a different environment and using a larger sample. Thanks to its proximity, large size, and broad morphological coverage, the Virgo cluster is the next logical cosmic structure to consider as we revisit TV97’s analysis. If confirmed, we can also assess whether the reported bimodality of surface brightnesses, for spiral galaxies at least, is in any way related to the SDSS color bimodality discussed above and whether the global trimodality of galaxy concentrations for all Hubble types (Bailin & Harris 2008) is also observed.
The organisation of this paper is as follows: In §2, we discuss briefly our database for the 742 Virgo Cluster Catalog (Binggeli et al. 1985; hereafter VCC) that are found in the SDSS 6th Data Release (Adelman-McCarthy et al. 2008; hereafter DR6). Out of these, we have defined a complete, magnitude-limited, sample of 286 VCC galaxies with for which deep H-band photometry was obtained. The full description of our data set, and details about the data acquisition and reduction methods are given in McDonald et al. (2009; hereafter “data paper”). We introduce in §3 specific parametric and non-parametric quantities that will permit a comprehensive understanding of the structure of Virgo cluster galaxies of all types. In Appendix A, we determine the effects of various errors on the distributions of various non-parametric quantities in §A. We present final results in §4, and examine their possible interpretations in §5.
We assume in this paper a distance to all Virgo cluster galaxies of 16.5 Mpc or m-M=31.18 (Mei et al. 2007). At that distance, = 80 pc.
2 Virgo Sample
The study of the unbiased distribution of galaxy surface brightness requires volume completeness. A solution to this issue is to study galaxies at a common distance in a cluster. Our sample is drawn from the Virgo Cluster catalogue (Binggeli et al. 1985; hereafter VCC). The VCC catalogue contains 2096 galaxies within an area of 140 deg2 on the sky, centered on the galaxy M87 at 12h25m and 13∘. The VCC is asserted to be complete down to a limiting absolute magnitude of and to contain many objects as faint as (Binggeli et al. 1985).
Our first task was to acquire deep, optical, photometry for as many VCC galaxies as could be found in the SDSS/DR6. A further spatial cut was made following Trentham & Tully (2002) to reject 40% of the cluster that is contaminated by the W, W’ and M background groups. The W, W’ and M groups were identified by de Vaucouleurs (1961) and Ftaclas et al. (1984), respectively. W and M lie about twice as far away as Virgo and W’ lies about 50% further than Virgo. These and related structures in the Virgo Southern Extension all lie in a flattened plane close to the supergalactic equator, contaminating the western edge of the Virgo Cluster. Trentham & Tully (2002) discuss this problem and describe how the projected area of the cluster can be separated between zones with negligible and serious contamination.
Images from the SDSS/DR6 were extracted for a total of 742 VCC galaxies obeying these spatial cuts. We will refer to this sub-sample as the “VCC/SDSS” sample.
In order to ensure that our Virgo catalog reaches below the LSB peak of UMa (TV97), we must achieve completeness at least down to mag (assuming a distance of 15.5 Mpc to UMa). In order to ensure that no intermediate surface brightness galaxies are missed, we can define a complete sub-sample that includes all VCC galaxies with mag (i.e. ). We also make an additional two spatial cuts to ensure that we only include bound cluster members: 1) all galaxies identified as “background” by Binggeli et al. (1985) are removed and 2) all galaxies further than from the center of the cluster, defined as the position of M87, are removed. These magnitude and spatial cuts leave us with a total of 303 VCC galaxies centered on M87. A further 8 VCC galaxies (1068,1217,1258,1355,1665,1768,1889 and 2096) with recessional velocity measurements, 3000 km s-1, and the galaxies VCC0723 and VCC0991, with significant foreground stars, were also excluded. The following seven VCC galaxies (530,950,1052,1287,1571,1822 and 1992) could also not be detected at H-band (see §2.2), and were left out of the sample (this has no effect on our final conclusions). We are left with a final, complete, sub-sample of 286 VCC galaxies with , covering a wide range of luminosities and morphologies. For reasons that will soon be clear, we will refer to this complete sub-sample as our “H-band” sample.
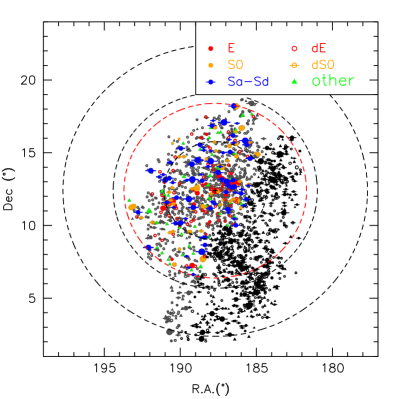
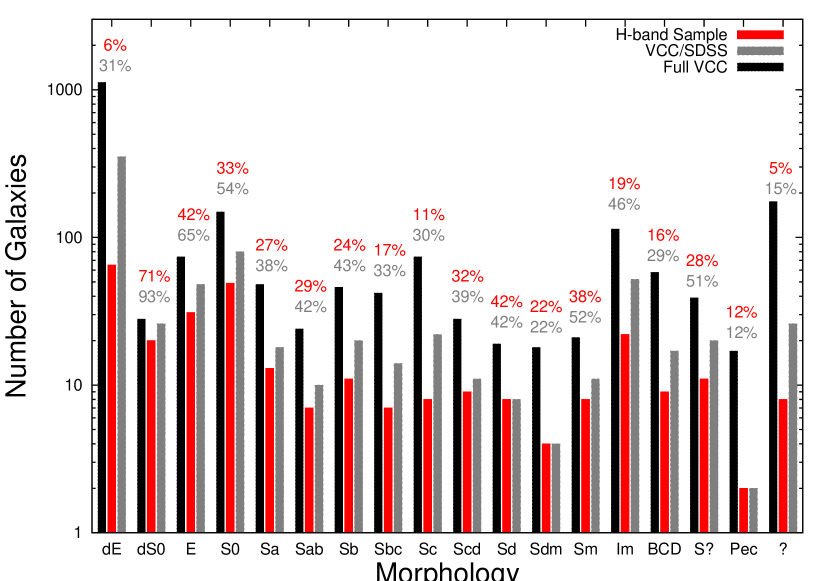
Fig. 1 shows the distribution of all VCC galaxies in black, as well as the 742 VCC/SDSS galaxies in grey, and the H-band sample in multi-colors. Fig. 2 shows the distribution of galaxy morphologies, as taken from the NASA Extragalactic Database (hereafter NED). The broad morphological coverage is important to ensure that no distribution of galaxy structural parameter is biased by morphological segregation. Fig. 2 shows that Virgo is intrinsically rich in dE, S0 and Im galaxies (see also Mei et al. 2007). This is not due to a bias in our sample but simply to the nature of the Virgo cluster (as represented by the VCC).
The gas-rich VCC galaxies are represented at approximately the same levels in our VCC/SDSS and H-band samples relative to the full VCC with completeness between 11% and 42%. The bright magnitude limit of the H-band sample also implies a higher number of early-type galaxies relative to the later types. However, we will show in §4 that the bimodality of surface brightnesses is detected in each morphological bin (early or late type) and that it is thus unlikely due to the morphological make-up of this specific cluster or our sampling of it.
Following TV97’s study of the UMa cluster, we have sought to obtain optical and especially near-IR photometry as well as dynamical measurements for all of our H-band sample galaxies. The SDSS imaging for this sample will yield a distribution of luminosities, surface brightnesses, scale lengths and concentrations, as a function of optical wavelength. The optical colors will enable a comparison of any surface brightness bimodality, if present, with the observed SDSS galaxy color bimodality (e.g., Strateva et al. 2001) and the ability to determine if one is simply a consequence of the other. The near-IR images are however essential to uncover the true distribution of galaxy surface brightnesses, luminosities, and other galaxy parameters largely free of extinction by dust. We describe the extraction of the optical and NIR imaging data below.
While most critical, our collection of dynamical parameters for VCC galaxies is still in progress and will be reported elsewhere.
2.1 SDSS Photometry
We have extracted calibrated images from the SDSS/DR6 for 742 VCC galaxies, including the 286 galaxies in our “H-band” sample. Surface brightness profiles and total luminosities were obtained for these galaxies in all five SDSS bands by, first, performing isophotal ellipse fitting to the -band images according to the methods of Courteau (1996), and then, applying the -band isophotal solutions to the images in the other SDSS bands. The latter ensures that color gradients extracted from all SDSS images are computed from the same matching isophotes (MacArthur et al. 2003). -band images were consistently shallower than the bands and were thus discarded. Sky levels for background subtraction and the photometric zero-points for calibration were obtained from the SDSS image headers and the SDSS archives, respectively. The remainder of the profile extraction technique is identical to that used for the near-IR photometry, as described below.
2.2 NIR Image Collection
Due to practical constraints, new, deep, H-band imaging that would sample well below the putative surface brightness bimodality scale of TV97 could only be obtained for a smaller sample of VCC galaxies. This is the magnitude-limited “H-band” sample of 286 VCC galaxies with SDSS imaging described above.
Deep H-band imaging for some VCC galaxies is already available from the Two Micron All-Sky Survey (Skrutskie et al. 2006; hereafter 2MASS333http://www.ipac.caltech.edu/2mass/releases/allsky/) and from the GOLDMine444http://goldmine.mib.infn.it/ database (Gavazzi et al. 2003). We were able to secure H-band imaging for the remainder of the H-band sample with the detectors ULBCAM at the UH 2.2-m telescope, WFCAM at UKIRT and WIRCAM at CFHT over the period 2005-2008. Some deep K-band imaging was also available for a few galaxies in 2MASS and GOLDMine.
H-band images from GOLDMine were kindly provided by G. Gavazzi. Calibrated 2MASS galaxy images were extracted from the online database. Many of the 2MASS and GOLDMine images were not deep enough for our purposes. Whilst adequate for large HSB galaxies, the high 2MASS brightness threshold (typically mag arcsec-2. Bell et al. 2003; Courteau et al. 2007; Kirby et al. 2008) limits the use of those data bases for deep extragalactic studies. Likewise, just a handful of GOLDMine images were deep enough to properly separate the bulge and disk light. We have defined the relative depth criterion, , as the ratio of the maximum extent of the H-band surface brightness profile divided by that of the SDSS -band profile: , where is the radius where the surface brightness error exceeds 0.15 (see McDonald et al. 2008 for details). Wherever possible, we impose for our NIR data. Ultimately, 20 2MASS and 79 GOLDMine galaxy profiles were deemed useable for our study. A final 187 Virgo cluster galaxies needed new observations. These new and existing observations are summarized in Table 1.
| Tel - Camera | Targets | Collected | Avg Seeing |
|---|---|---|---|
| UH88 - ULBCAM | 52 | 04/2005 | 1.2 0.2 |
| UH88 - ULBCAM | 16 | 04/2006 | 1.5 0.3 |
| UH88 - ULBCAM | 31 | 04/2007 | 1.3 0.2 |
| UH88 - ULBCAM | 23 | 03/2008 | 1.0 0.2 |
| UKIRT - WFCAM | 31 | 07/2008 | 1.1 0.1 |
| CFHT - WIRCAM | 34 | 02-06/2008 | 1.1 0.1 |
| GOLDMine | 79 | - | 2.2 0.9 |
| 2MASS | 20 | - | 2.6 0.1 |
The surface brightness profiles for the deep GOLDMine and 2MASS images were measured using the same techniques as our new NIR images to ensure uniformity for the entire database. Further details regarding the data reduction process and quality are presented in McDonald et al. (2008; 2009).
3 Surface Brightness Profile Analysis
Surface brightness profiles were extracted for the 742 VCC/SDSS galaxies at bands and for the 286 H-band galaxies. In this section, we examine the various parametric and non-parametric properties derives from these profiles.
McDonald et al. (2008) already considered the parametric (i.e. model dependent) analysis of UMa spiral galaxies in order to test, and ultimately confirm, TV97’s claim of bimodality. The current, larger, Virgo cluster sample however includes galaxies of all morphologies. While a parametric approach to model the shape of complex light profiles involves a multi-component decomposition (e.g., MacArthur et al. 2003; McDonald et al. 2008), a non-parametric approach is free of model assumptions and reveals different aspects of galaxy structure. We explore both approaches below and it will be shown later that surface brightness bimodality is essentially independent of the method of light profile analysis.
3.1 Parametric Quantities
Spheroidal and flattened galaxy systems have traditionally been modeled as the sum of a bulge and disk components (see MacArthur et al. 2003; McDonald et al. 2008 for more details). The 1D light profile of a galaxy disk is typically parametrized as an exponential function:
| (1) |
where and are the disk central surface brightness and scale length, respectively. Meanwhile, the projected 1D bulge light profile is better modeled as a Sérsic function (Sérsic 1968):
| (2) |
where is the half-light radius, is the surface brightness at that radius, and is the Sérsic shape parameter. With , the Sérsic function reduces to the exponential function.
In addition to the bulge and disk, we consider other components that may affect the light profile such as compact nuclei, spiral arms and disk truncations. Ignoring these may result in large errors in the bulge and disk parameters (McDonald et al. 2008).
B/D decompositions were performed only for the H-band and optical light profiles of the 286 galaxies in the “H-band” sample (McDonald et al. 2009).
3.2 Non-Parametric Quantities
Non-parametric quantities are measured directly from the surface brightness profile, with no prejudice for any assumed model. The only assumptions inherent to the non-parametric measurements below are: (i) that the total galaxy light is an extrapolation of the light profile to infinity, and (ii) that inclination estimates and extinction corrections are valid. Non-parametric quantities allow a direct, unbiased comparison of galaxies across the full Hubble sequence.
3.2.1 Concentration,
The galaxy light concentration is a measure of the relative light fraction between the inner and outer parts of the galaxy. Unlike the B/D ratio, which relies on a model for the light distribution, is a straightforward, model-independent morphological indicator. The concentration, is defined as (e.g., Kent 1985; Courteau 1996):
| (3) |
where and are the radii enclosing 80 and 20 percent of the total light. For a pure exponential function ( in Eq. (2)), =2.8.
Concentration indices are a function of wavelength and while fractional radii depend on inclination and extinction corrections, we expect the ratio / to be roughly independent of projection effects. We justify this assumption below.
3.2.2 Fractional Radii and Surface Brightness
Fractional parameters refer to specific quantities measured at radii that contain specific fractions of the total galaxy light. The effective radius, , is the radius that encloses half of the total light. While was already introduced in the context of a parametric profile function (Eq. 2), it is formally defined in a non-parametric way as:
| (4) |
The effective surface brightness, , is the surface brightness at ; (log). Unlike the extrapolated central surface brightness of the disk, , the effective surface brightness is non-parametric, making it ideal for the comparison of mean surface brightness levels for galaxies of varying morphology; (or ) applies to all galaxy types rather than (or ) which is restricted to spiral disks ( for pure disks). Our discussion about the variations in galaxy surface brightness profiles will indeed rely on and .
Another fiducial light marker is the fractional radius defined as:
| (5) |
where contains some percentage () of the total light. is the surface brightness in at . A final, non-parametric, measure of surface brightness is the average surface brightness interior to some radius , , defined as:
| (6) |
is the magnitude equivalent of .
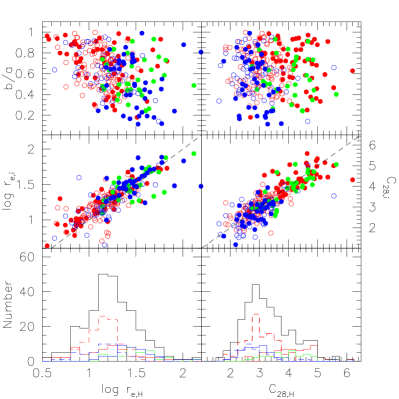
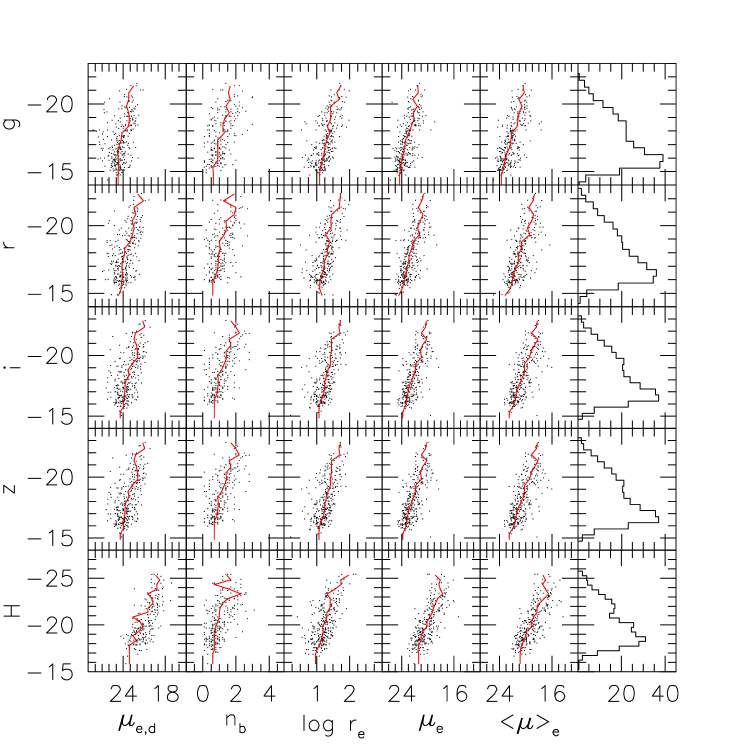
Fig. 3 shows the dependence of the H-band and on the -band axial ratio, for the H-band sample. There appears to be a correlation between and , but it is driven largely by the spheroidal nature (high axial ratios) of compact galaxies (small ). Any correlation between and is significantly weakened if compact galaxies are excluded. The insensitivity of to projection effects (top right window) is even clearer. The respective corrections for projection on and roughly cancel out. We also see in Fig. 3 that there is a good linear correlation between - and H-band scale radii and concentrations.
Ultimately, concentrations, fractional radii and surface brightnesses were computed for all 742 VCC/SDSS at wavelengths and for all 286 “H-band” galaxies at H-band.
4 Results
We now examine the distribution of structural parameters of Virgo cluster galaxies, starting with an analysis of the gas-rich systems in the H-band sample for comparison with TV97’s similar analysis. We then derive the distribution of effective surface brightnesses and the optical and NIR luminosity functions for the full H-band and VCC/SDSS samples, with all morphologies considered.
We will find for the Virgo gas-rich galaxies in the H-band sample, a bimodal distribution of the extrapolated disk central surface brightness, , and thus bolster the similar claim for UMa galaxies by TV97. For the complete sample of gas-rich and gas-poor Virgo galaxies, we determine the distribution of effective surface brightness, (independent of B/D decompositions) and find compelling evidence for brightness bimodality in each morphological group. We present in §4.1 the distributions of and, in §4.2, various fractional and average surface brightness measures. We compute in §4.3 the optical and NIR luminosity functions and compare these to the recently published optical luminosity function of Virgo (Rines and Geller, 2008) and field NIR luminosity function from UKIDSS (Smith et al. 2008). In §4.4, we present the distributions of various scale radii and the galaxy concentration, . The latter is compared to the distribution of concentrations for SDSS galaxies by Bailin and Harris (2008). In §4.5 we examine the bivariate distributions for most of the structural parameters addressed in this section.
4.1 Disk Central Surface Brightness
In order to compare with the study of UMa cluster galaxies by TV97 and McDonald et al. 2008, we restrict our H-band sample to disk galaxies. B/D decompositions, as in McDonald et al. (2008), were performed for this sub-sample of 166 VCC disk galaxies. The B/D fits, which include optional bulge, nucleus and spiral arm components, were applied to each and H-band SB profiles. The derived values were corrected for projection effects to their face-on value in the absence of extinction. Thus, we write: , where is the measured axial ratio of the outermost isophote at a given band in each galaxy. We take =1 for the dust transparent case. This is likely a fair assumption at H-band, the focus of our analysis, but less adequate for the bands. We keep our analysis free of dust correction for now.
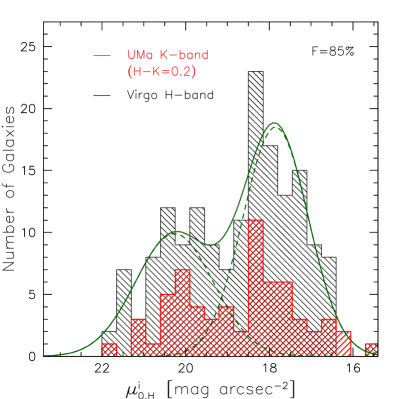

The distribution of inferred values is shown in Fig. 4. There is a clear dearth of galaxies at 19 mag arcsec-2. This result for later-type VCC galaxies matches very well that determined by TV97 and ourselves for UMa disk galaxies with a minimum in the number of galaxies at mag arcsec-2. Similarly, we find excellent agreement with TV97 in the location of the HSB and LSB peaks at =17.850.15 mag arcsec-2 and =20.270.4 mag arcsec-2, respectively, with a peak separation of =2.4 mag arcsec-2. Considering a typical H-K0.2 for galaxy disks, the distributions for in the Virgo and UMa clusters are very similar.
Using a statistical F-test, we can reject the hypothesis of a normal distribution for in favor of a bimodal distribution with a confidence level of 85%. Fig. 5 shows which galaxies contribute mostly to different surface brightness levels. As expected, early-type disk galaxies dominate the HSB peak, while late-type disk galaxies and irregulars are present in both the HSB and LSB peaks.
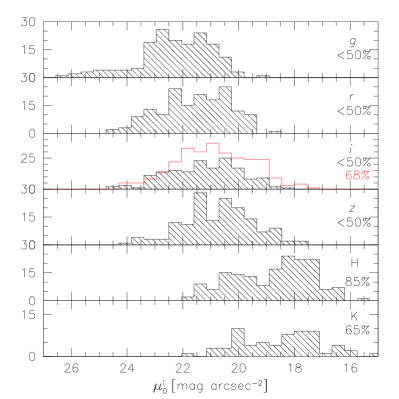
Let us now examine the distribution of inclination-corrected with wavelength. Fig. 6 shows the different distributions from (top) to K (bottom). The gap between the two SB peaks grows as a function of wavelength since the HSB peak brightens at a faster rate with wavelength than the LSB peak. This is explained by the higher dust content in HSB galaxies, in contrast with their relatively transparent () LSB counterparts (TV97), as well as the relative colors of the constituent stars (HSB galaxies tend to be redder than LSB galaxies). Dust obscuration is less effective at longer wavelengths and, as a result, we see more deeply along any given line-of-sight thus increasing the observed surface brightness. Recall that we have not applied any correction for obscuration (Cλ=1) to surface brightnesses and the bimodality disappears as we consider shorter wavelengths. It is possible that the correct choice of Cλ would restore the bimodality at optical wavelengths, as suggested by TV97, but any such complications can be avoided by restricting our analysis to NIR wavelengths only, as we do here.
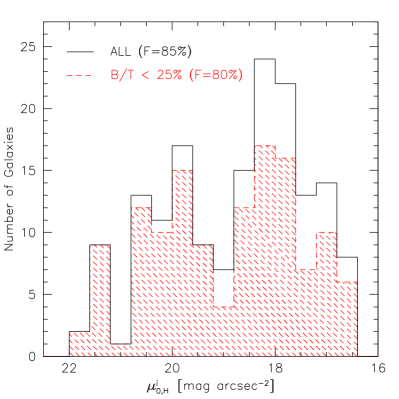
We can ask if the bimodality in the disk CSB is correlated with any bulge structure. Fig. 7 shows the same distribution as in Fig. 4 but now with a second distribution including only galaxies with small bulges. We define a “small” bulge as one which contributes % of the total galaxy light. Indeed, we see that if we remove those galaxies with bulges which contribute more than 25% of the total luminosity, bimodality is preserved. Though the F-test confidence level drops, this is primarily due to the reduction in sample size - the ISB gap is very well preserved.
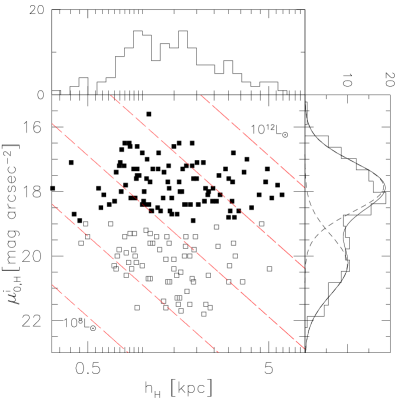
Fig. 8 shows the relationship between and disk scale length, , at H-band. At intermediate luminosity, there can be both HSB and LSB galaxies, depending on the disk surface density (faint/high & large or bright/low & short ). The fact that two galaxies with the same luminosity can have wildly different surface brightnesses leads to the belief that some mechanism likely related to the initial halo angular momentum (Dalcanton et al. 1997) prevents LSB systems from collapsing to the same densities as the HSBs. This figure makes clear that for a given luminosity the LSB galaxy must be more extended than the HSB galaxy and that no LSB galaxy exceeds 1011L⊙. The distribution of disk scale lengths also shows some evidence of multiple peaks, though the statistical significance is low (68%), none of which are correlated with the structure in .
We have shown thus far that the NIR central surface brightnesses, of disk galaxies in the Virgo and UMa clusters are distributed bimodally. Our B/D decompositions confirm a result that is already well-known - that galaxy bulges come in two types: cuspy (high concentration) and cored (low concentration). HSB disks harbour both types of bulges, while LSB disks only harbour low-concentration bulges.
We now expand our analysis to take full advantage of the diverse Virgo cluster population by considering early-type and dwarf galaxies as well.

4.2 Effective Surface Brightness
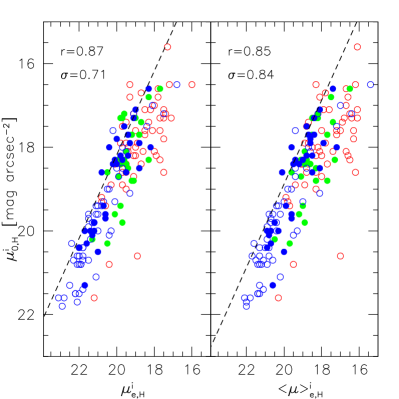
Unlike the UMa cluster of galaxies, Virgo is rich in giant and dwarf early-type galaxies. The mean density of Virgo is 5 times that of UMa. Many of the VCC galaxies have no observable disk component and therefore our analysis of galaxy properties based on would be moot. We consider instead two more versatile quantities: , the galaxy effective surface brightness and , the mean surface brightness, defined as the average surface brightness within (§4.2.2). These non-parametric quantities can be measured for all galaxies. Fig. 9 shows the comparison for the 166 gas-rich VCC galaxies of with and . There is a strong correlation between and with the expected zero-point offset () for pure exponential disks). The scatter increases for earlier-type galaxies. This scatter is further examined in Fig.10, where we confirm that the differences between ,, and are a function of morphology or, for simplicity, concentration. That is, for higher concentration the scatter in the and relations increases.
We have also considered the average surface brightness within , , as a measure of a galaxy’s characteristic surface brightness. Use of this parameter is motivated by a study of late-type field galaxies by de Jong & Lacey (2000; hereafter DL00). DL00 studied the distribution of for 1000 Sb-Sdm field and cluster galaxies which, they reported, is not bimodal. The right side of Fig. 9 shows that correlates well with , though with slightly larger scatter than . From this point on, we will adopt as our standard measure of surface brightness for three reasons: 1) For spiral galaxies, scales directly with , 2) can be measured for any galaxy morphology, and 3) is independent of any assumptions about the shapes of the galaxy bulges (if any) and disks. We also adopt a geometric correction for in all galaxies: , where is the axial ratio at the effective radius. Regardless of what surface brightness measure we use, and how we correct for projection effects, we will show in §6 that the overall shape of the distribution of surface brightnesses is preserved.
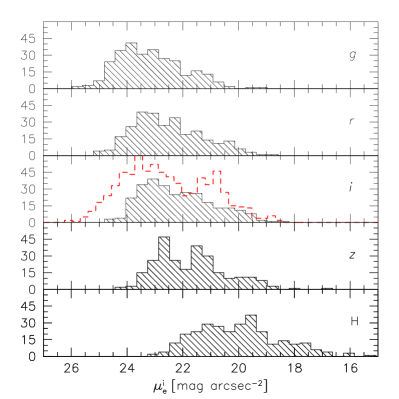
We show in Fig. 11 the distribution of with wavelength for all 286 H-band VCC galaxies. The differential effects of extinction with wavelength are well known (though poorly understood) and likely the cause for the smoother contributions at shorter wavelengths. The distribution of the nearly dust-free LSB galaxies should not change drastically from to H, modulo a color term due to stellar populations. The HSB peak from to H will, however, be altered by effective dust obscuration. The faint tail of the HSB peak will thus be stretched to fainter values, effectively filling any intrinsic trough between the HSB and LSB peaks (as shown by TV97 for UMa galaxies). For this reason, we shall now rely solely on NIR surface brightness measurements for the remainder of our analysis.
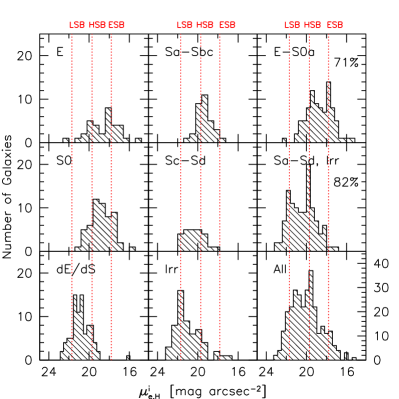
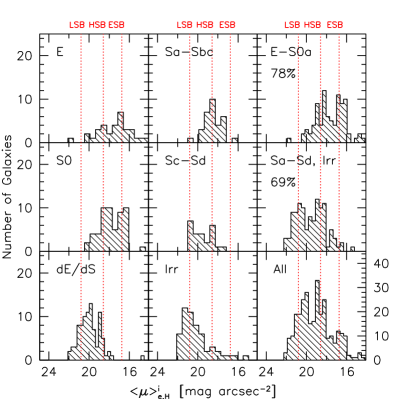
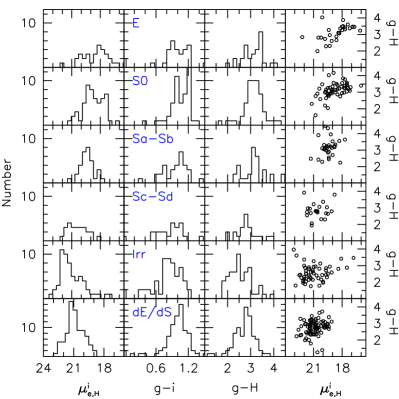
Fig. 12 shows the distribution of measurements for our sample of 286 H-band VCC galaxies. Characteristic structure can be seen in most of the morphological bins, as well as in the sample as a whole. The separate distributions of E and S0 galaxies are each weakly bimodal. The combination of these morphological types (top right panel of Fig. 12) gives a stronger bimodality for . The bimodality of for gas-rich galaxies emerges clearly from the HSB and LSB peaks for the early-type (Sa-Sbc) and irregular galaxies; the distribution of Sc-Sd galaxies shows the least features and is least abundant of all VCC types. This results in a strong bimodality for all the gas rich galaxies (middle-right panel of Fig. 12). If we compare the distributions of for gas-poor and gas-rich galaxies, the lower surface brightness spheroids line up with the HSB peak for late-type and dwarf galaxies. This results in an apparent trimodality of for the complete H-band sample (lower right panel of Fig. 12). However, we stress that the trimodality is in fact a superposition of an early- and late-type SB bimodality. The distribution of in Fig. 13, shows similar trends. However, Fig. 13 illustrates the sensitive nature of binning for this sort of argument. For instance, the distribution of for Sc-Sd is here roughly bimodal when it was flat in Fig. 12. This illustrates the need for large samples. We are still reassured that the distributions for or for the sum of both the gas-rich and gas-poor galaxies show very similar (bimodal) features. Figs. 12-13 show that a structural bimodality is present in both early and late-type galaxies with a tail towards the brightest galaxies. A statistical F-test confirms the rejection of a single peak in favor of two distinct peaks with 71% and 82% confidence for early- and late-type galaxies, respectively. We can consider another significance test. In order to fill the early and late-type brightness gaps, an additional 15 and 29 intermediate SB galaxies would be needed, respectively. However, the current number of galaxies in these troughs is 24 and 39, respectively, so the required additions to achieve flat SB distributions would correspond to 3 and 4.5 standard deviations. This argument, based only on Poisson statistics, complements nicely the F-test (which assumes a Gaussian shape).
Figs. 12-13 tell an exciting story; not only is a structural bimodality present in spiral galaxies, but also in spheroids. Equally intriguing is that spheroids of lower surface brightness have identical surface brightnesses as HSB spirals, possibly pointing to a common formation and/or structural mechanisms. In order to better understand this result, we now examine the correlation of surface brightness with various other parameters and what role it plays in fundamental structural relations. But first, let us introduce another unexpected result, this time in the NIR luminosity function, to shed more light on the structural bimodality in both gas-poor and gas-rich galaxies.
4.3 Near-IR and Optical Luminosity Functions
McDonald et al. (2008) showed that the K-band luminosity function for Ursa Major has a noticeable dip at intermediate luminosities. We now examine this claim for Virgo galaxies with both optical and near-IR luminosities. Fig. 14 shows the luminosity functions of our 286 VCC galaxies in the ,,, and H bands. There appears to be a dip in the luminosity function at optical wavelengths, which develops into a broad trough at H-band. This trough clearly separates two distinct luminosity classes.
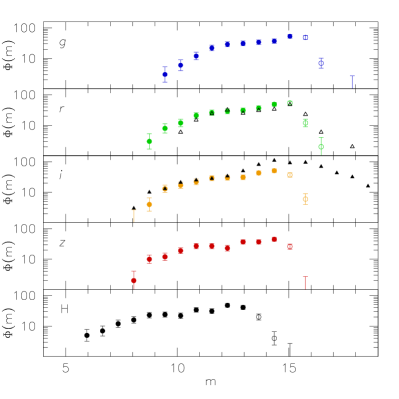
Rines and Geller (2008) obtained the same result for their study of the faint end of the Virgo LF (see black triangles in -band window of Fig. 14), but dismissed it on grounds that SDSS data may be flawed at luminosities where the dip is observed. It would however be challenging to think of such a systematic bias in the SDSS pipeline reductions. Furthermore, our luminosities are measured from SDSS images but fully independent of any other SDSS data product (e.g., Petrosian luminosities and radii555Rines and Geller (2008) used “model” luminosities from the SDSS pipeline.). The dip in the Virgo luminosity function is also observed at H-band which further confirms that it is not an artifact of the SDSS pipeline. Our luminosity function and that of Rines & Geller are a striking confirmation of each other, establishing the reality of the dip in the luminosity function of Virgo cluster galaxies.
The dip in the NIR luminosity is not reproduced in the UKIDSS luminosity function for field galaxies (Smith et al. 2008). This could indeed mean that there is no trough in the luminosity function of field galaxies and that the lack of intermediate-luminosity galaxies in UMa and Virgo is purely a cluster-driven phenomenon. However, the UKIDSS luminosity function suffers incompleteness at luminosities fainter than , while the low-luminosity peak in the UMa luminosity function is at . This fact, along with the difficulty of achieving volume completeness in field galaxy samples, could conspire to hide any putative trough in the NIR luminosity function if it is, in fact, independent of environment.
We will see in §4.5 and Fig. 22 that the high-luminosity peak is comprised of “extreme” surface brightness (hereafter ESB) galaxies and the low-luminosity peak is comprised of LSB galaxies. However, the HSB galaxies are distributed bimodally in luminosity, implying a bimodality in sizes for these galaxies since they all have nearly the same surface brightness. The combination of Figs 12 and 14 shows that the majority of the low-luminosity HSB galaxies are compact dE galaxies, while the majority of the high-luminosity HSB galaxies correspond to traditional HSB spirals.
Finally, Fig. 15 shows the multi-dimensional variation of various structural parameters with optical and NIR luminosity for the full sample of 286 VCC galaxies. The dumbbell-shaped distribution of points in all plots of luminosity versus or shows clearly the separate galaxy populations. The L- relation appears to be very similar whether we use or , although the scatter is somewhat reduced at . Finally, there is a strong evolution of most of these scaling relations with wavelength that will be studied elsewhere.
4.4 Concentration
In Appendix A, we have attempted to predict the observed distribution of based on normal distributions of , , , and . In Fig. 16 we show the distribution of measured concentrations for the 286 VCC galaxies binned by morphology as well as for the complete H-band sample. For comparison, we show the predicted distribution from our models (Appendix A).
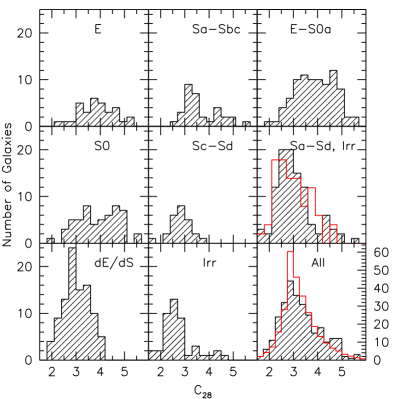
The predicted and observed distributions are remarkably similar, though the observation of a second peak at high concentration with C was not predicted by our simulations of isolated galaxies. The overall distribution peaks at C, corresponding to pure exponential disks. The distribution terminates rather sharply at C, suggesting a lower limit for how centrally concentrated the baryons in a galaxy can be. In order to understand the high- peak, let us look at the distribution of for different morphological types. Fig. 16 shows that the Sc-Sd, Irr and dE galaxies populate a single peak at , while E, S0 and Sa-Sbc galaxies occupy two distinct peaks near and . Thus, there is a concentration
bimodality only in early-type (bulge-dominated) galaxies. The difference between the model and observed distributions is due in large part to the fact that our model distribution of bulge surface brightness is normal, while the one we observe is bimodal. The transition at represents the transition from LSB to HSB bulges. We combine Figs. 12 and 16 in Fig. 17 to examine whether the early-type bimodality in concentration corresponds to the bimodality in surface brightness.
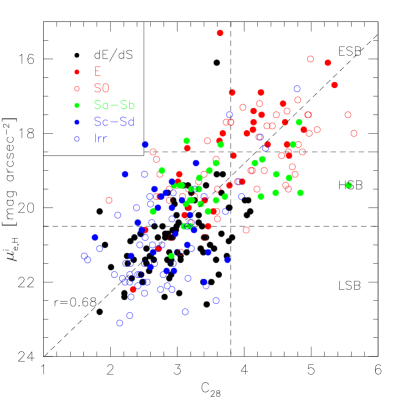
We see again in Fig. 17 that the two HSB peaks are comprised primarily of E, S0 and Sa galaxies, while the LSB peak is comprised primarily of dwarf, irregular and late-type spiral galaxies. Most importantly, we see two isolated clouds: one containing high-concentration HSB and ESB galaxies and the other containing low-concentration HSB and LSB galaxies. Again, LSB galaxies never have high concentration and ESB galaxies never have low concentration. This provides some insight into the structural bimodality in spheroids. It is possible that galaxies with C can only form through major mergers, which naturally explains the lack of both LSB and star-forming galaxies in the high concentration peak. We can also verify that the trimodality observed in SDSS concentrations by Bailin & Harris (2008) is not detected here.
4.5 Bivariate Distributions
In order to assess if the brightness bimodality extends to, or even stems from, other galaxy parameters, we now construct a number of bivariate distributions for vs other fundamental structural parameters such as color, luminosity and dynamical mass.
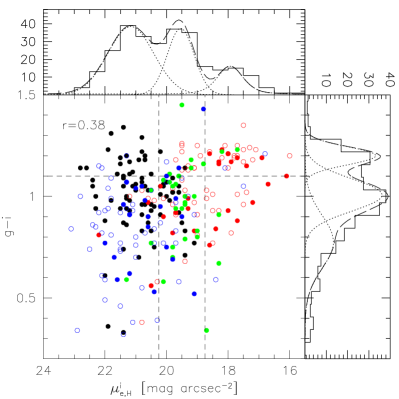
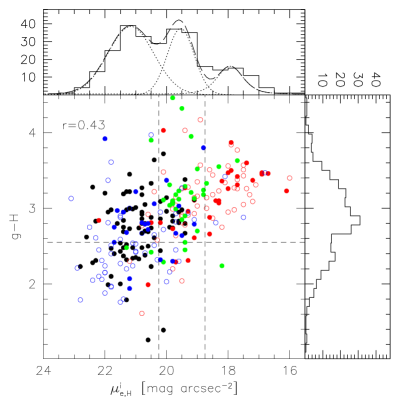
The color-surface brightness bivariate distribution is certainly of great interest in light of the color bimodality of SDSS galaxies (e.g., Strateva et al. 2001). It is of obvious interest to ask if the transition in galaxy colors matches the transition in galaxy surface brightnesses. A careful examination of Fig 18 defuses this idea. The fact that the blue and red peaks each include all three SB peaks demonstrates that the structural bimodality is indeed different from the color bimodality. The same distribution but for -H colors (Fig. 19) reveals a different color bimodality (resulting from stellar population effects that will be investigated elsewhere). The fact that the red peak alone is comprised of all three SB classes again confirms that surface brightness trends and color bimodality are independent phenomena. We summarize our findings in Fig. 20 with the distributions of , H and for individual morphologies. There is a strong correlation between color and surface brightness for elliptical galaxies (and weaker for S0s), with redder ellipticals having higher surface brightness than blue ellipticals. There appears to be no correlation between color and surface brightness for the other types, suggesting again that the surface brightness bimodality is independent of stellar populations.


The correlation of with rotational velocity gives greater hope of establishing a link with the observed bimodality in . Indeed, we note in Fig. 21 hints of bimodality for Virgo galaxies in the distribution of the maximum galaxy rotational velocity, Vmax. With high-quality, heterogeneous (combination of HI linewidths and H rotation curves) dynamical information available from HyperLEDA (Paturel et al. 2003) for only 102 of the 286 VCC galaxies, the observed weak correlation (r=0.53) between Vmax and may not be surprising. A homogeneous collection of resolved rotation curves for the complete sample of galaxies will be needed to establish a dynamical extension of the galaxy structural bimodality. In a similar vein, TV97 found for a subsample of 35 UMa galaxies that the surface brightness correlated strongly with the slope of the rotation curve, a subject we address in Appendix 2. Yet again, a much larger sample is needed for a conclusive analysis.
Finally, we observe the distribution of luminosities vs in Fig. 22. There is a clear trend between luminosity and surface brightness, as expected. Although there is scatter in both variables, any bimodality in , as observed in Fig. 21 ought to be reflected in by virtue of the velocity-luminosity relation of galaxies. Furthermore, since , and we would expect the bimodality to be reflected in the distribution of luminosities, unless the SB bimodality is due to the relation . Fig. 22 shows a mild bimodality in L, but which is uncorrelated with the stronger bimodality in .
We have analyzed bivariate distributions involving color, rotation velocity, luminosity and surface brightness. From Figs. 18-22, we find no strong correlation between the structure seen in the distribution of surface brightnesses and that of any other structural parameter. There is no correlation between surface brightness and color, with both HSB and LSB galaxies occupying the red and blue peaks. Figs 21 & 30 suggest that the source of the bimodality in surface brightness may be linked to galaxy dynamics and not stellar populations. TV97 also proposed a dynamical explanation for the structural bimodality. In the following section we offer a tentative explanation for this exciting result in a more global context.
5 Discussion
In §4, we have verified that the distribution of surface brightnesses is bimodal in UMa and Virgo cluster galaxies. Before we discuss possible explanations for this effect, let us investigate any possible biases in the data measurements and calibrations that could conspire to produce the observed bimodalities. Environment, which we discuss below, may also play a role in the structural bimodality. Various angles to address any cause for bimodality - field vs cluster galaxies or optical vs IR data, or both - will then be explored. We conclude with plausible explanations for the observed galaxy surface brightness bimodality.
5.1 An Artificial Bimodality?
We here investigate any potential source of bias from our measurement and calibration techniques. In our data paper (McDonald et al. 2009), we quote estimates for the error induced by our photometric calibration of 0.1 H-. In Figs. 4a and 12, we observed that the separation between the LSB and HSB peaks is 2 H-mag arcsec-2. In order to artificially cause this gap, a surface brightness error greater than 0.5 H- on both LSB and HSB peaks must be invoked. This error would also be systematic in order to “evacuate” ISB galaxies: bright LSB galaxies would have to be made fainter and/or faint HSB galaxies would have to be made brighter. We will examine below three possible processes that could induce such a large error: inclination correction, sky subtraction, and surface brightness measurements. We will attempt to show that, although far from negligible, these errors can be controlled and should not bias the shape of surface brightness distributions. Finally, we will examine the possibility that either of the SB bimodalities are due to regions with clustered HSB or LSB galaxies (i.e. an infalling group).
5.1.1 Sky Subtraction Errors
In Appendix A, we demonstrated how a sky measurement error of 0.01% can result in an artificial truncation or upturn in a deep surface brightness profile. However, while LSB galaxies are highly sensitive to sky errors, a systematic over- or under- subtraction of the sky could hardly enhance the ISB gap. In Fig. 23, we show the distribution of if the images for all the sample galaxies are systematically over- or under-subtracted by 0.05% (a huge error at H-band). It is clear that, the net effect is to shift all galaxies towards LSB, not to create a gap.
5.1.2 Inclination Corrections
In §4.1, we discussed deprojection corrections to measured surface brightness quantities. At NIR wavelengths, galaxies are nearly transparent and the correction for deprojection is purely geometric.
Since is measured from the disk fit, the geometric correction is trivial, provided the inclination of the disk is known. However, the quantity , which depends on both bulge and disk light, is less easily corrected. We thus make use of two different methods to correct for projection. First, we can write the corrected effective surface brightness of the whole galaxy, , as:
| (7) |
where is the axial ratio at the effective radius, . This correction (Method A) is straightforward, since we know the ellipticity as a function of radius from isophotal fits (§3.2.3).
The second inclination correction (Method B) requires the decomposition of the SB profile into bulge and disk components and deprojection of the two components separately. Knowing the inclination of the disk, we can deproject the disk fit (assuming full transparency). We further assume that the bulge requires no deprojection. This yields the correction for the global :
| (8) |
where is the axial ratio of the outermost isophote. The effective radius is measured from the total light profile and the contributions from the individual bulge and disk profiles at this radius are used. This correction is intuitively appealing as the bulge should require less of a deprojection correction than the disk. The assumption of a spherical bulge may however be inadequate, especially in the presence of a bar. However, we find that the isophotes in the central regions of most of our galaxies that exhibit bulges are, in fact, fairly round.
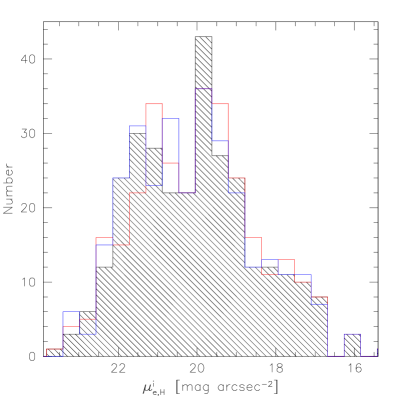
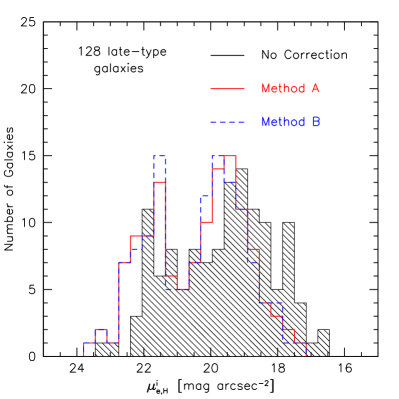
Fig. 24 shows the result of applying the two aforementioned inclination corrections. We find very little difference between methods A & B. As expected, the corrected values to face-on orientation for are systematically fainter. Most importantly, regardless of the correction used, bimodality is always preserved. As there is little difference in the resulting distributions, we prefer Method A for its simplicity and empirical, rather than parametric, quality. Furthermore, Method B is less desirable since it may yield large errors in cases when the disk fit is unreliable or if the assumption of spherical bulge is unwarranted.
5.1.3 Surface Brightness Measurements
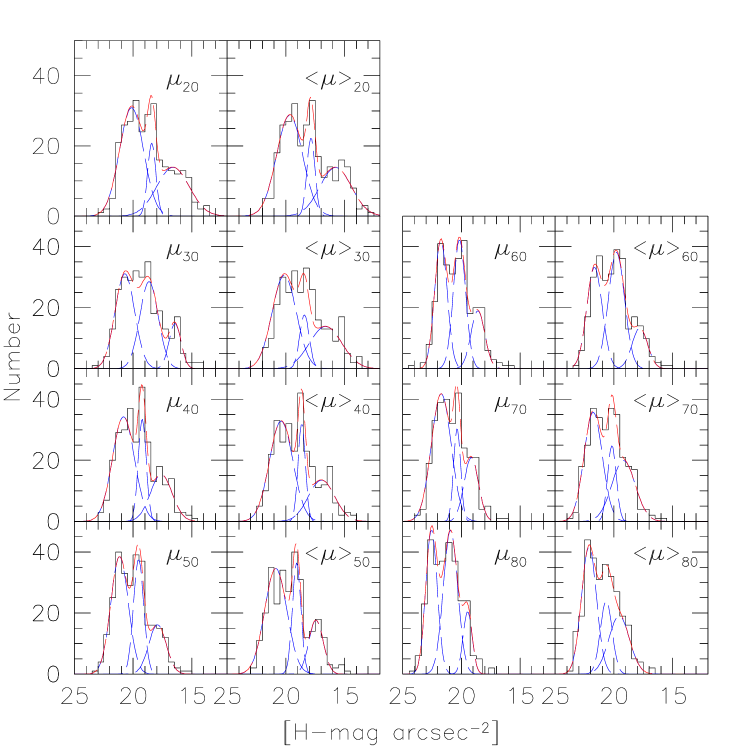
Ideally, we wish to avoid any sensitivity to the bulge light as well as to localized radial structure. Such a parameter for pure disks is , but we do not have an analog for both disks and spheroids. Indeed, is affected by local structure while encompasses bulge light. Of interest to us is to investigate if the use of a local vs global estimator of surface brightness at different galactocentric radii should cause bimodality. We can compute and as in §3.2.2. At short radii, we expect both and to be biased by any bulge or bar, while at large radii should suffer mostly from SB fluctuations and sky subtraction errors. Fig. 25 and Table 2 show the results of our exercise for all 286 VCC galaxies in our sample at H-band. The result is interesting: regardless of the specific measure of surface brightness, whether local or global, computed at small or large radii, the three SB peaks are always preserved.
| SB Measured | ESB | HSB | LSB | E-H | H-L |
|---|---|---|---|---|---|
| 16.61 | 18.42 | 20.14 | 1.81 | 1.72 | |
| 16.44 | 18.65 | 20.71 | 2.16 | 2.06 | |
| 17.61 | 19.23 | 20.83 | 1.62 | 1.60 | |
| 17.93 | 19.54 | 21.16 | 1.61 | 1.62 | |
| 18.59 | 20.16 | 21.74 | 1.57 | 1.58 | |
| 19.15 | 20.36 | 21.76 | 1.21 | 1.41 | |
| 19.46 | 20.92 | 22.54 | 1.46 | 1.62 | |
| 15.76 | 17.86 | 19.68 | 2.10 | 1.82 | |
| 16.61 | 18.42 | 20.14 | 1.81 | 1.72 | |
| 16.96 | 18.65 | 20.40 | 1.69 | 1.75 | |
| 17.43 | 19.08 | 20.86 | 1.65 | 1.78 | |
| 17.80 | 19.79 | 21.66 | 1.99 | 1.87 | |
| 19.19 | 20.18 | 21.77 | 0.99 | 1.59 | |
| 19.56 | 20.66 | 22.13 | 1.10 | 1.47 |
As can be seen from Table 2, the separations between the ESB and HSB peaks, and the HSB and LSB peaks are roughly equal. The remarkable result that the peak separations ESB-HSB and HSB-LSB are nearly identical at most SB levels suggests that there may be a single mechanism responsible for all three peaks.
Thus, we have shown that both the early- and late-type structural bimodality persist regardless of the surface brightness measurement, inclination correction, and sky subtraction error. Let us then address possible causes for the observed galaxy bimodalities, convinced that they are not an artifact of our methodology.
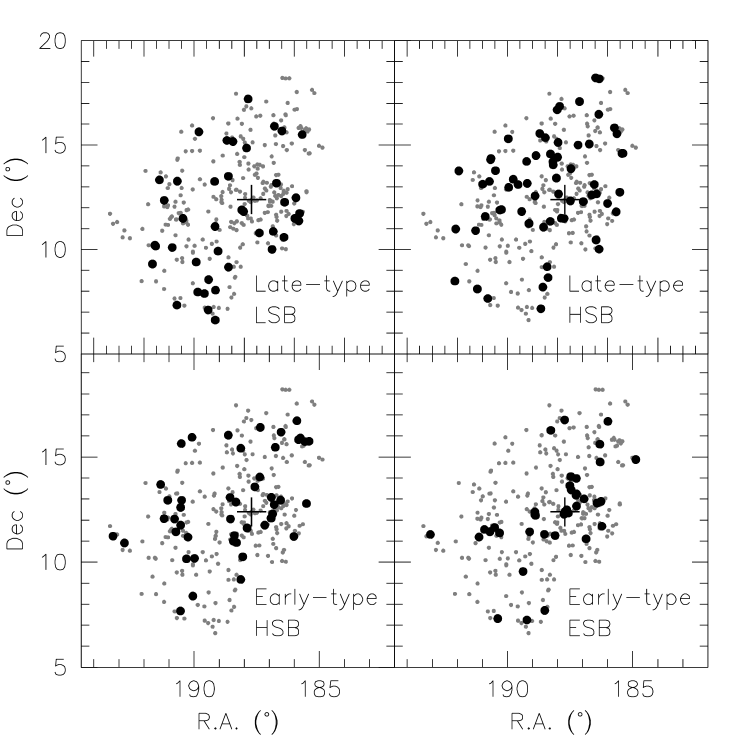
5.1.4 Spatial Surface Brightness Distributions
It is conceivable that one of the three surface brightness peaks could be due to the infall of a small group of galaxies with a narrow surface brightness distribution. In order to investigate this issue we turn to Fig. 26, which shows the spatial distribution of galaxies in the four different SB peaks: HSB & LSB early-type galaxies, and HSB & LSB late-type galaxies. It is clear from Fig. 26 that both the HSB and LSB spiral and irregular galaxies are spread uniformly throughout the cluster. Likewise, most of the spheroids are distributed uniformly throughout the cluster, with an overabundance of HSB spheroids near the cluster center. Thus, although there is a constant infall of galaxies into the Virgo cluster, it does not appear that this is causing an artificial peak in the surface brightness distribution.
5.2 Cluster vs Field Distributions
Freeman’s law (1970) in its modern form is understood as the maximum surface brightness any galaxy disk can have666Freeman’s original sample was heavily biased towards high surface brightness systems, hence the narrow reported range of surface brightnesses., but it does not preclude the existence of fainter systems. The general picture today is that the surface brightness function of galaxies has a tail at low surface brightnesses that extends to arbitrarily low values (de Jong & Lacey 2000). Previous studies that have attempted to quantify the distribution of galaxy surface brightnesses have focused mostly on field systems (e.g., McGaugh & de Blok 1995; de Jong & Lacey 2000; Driver et al. 2005). The effect of environment on galaxy surface brightnesses, if any, would thus be missed.
In their pioneering study, TV97 observed that the structural bimodality is strengthened if their UMa sample is restricted to isolated galaxies. For UMa, an isolated galaxy was defined as a galaxy that has not encountered another galaxy during the lifetime of the cluster. Since UMa is dynamically young, this definition is a reasonable one. However, since the crossing time of the Virgo cluster is less than one-tenth of a Hubble time (Trentham & Tully 2002), it is unreasonable to perform a similar analysis for Virgo cluster galaxies. Every galaxy in the cluster should have had at least one significant encounter within the last Gyr, which means that we cannot divide the sample into isolated and non-isolated galaxies.
Various studies have reported that LSB galaxies form primarily in isolated environments (e.g., Rosenbaum & Bomans 2004) likely from 1-2 peaks in the initial density fluctuation spectrum. However, these authors found that local LSBs are almost exclusively found in clusters and filaments. If LSB galaxies form from 1-2 peaks, they would migrate from voids to high-density regions. This does not explain how dynamically young galaxy clusters, such as UMa, could have a high abundance of LSB galaxies. Instead, perhaps the cluster environment enhances LSB formation which would explain the current location of the LSB population as well as the SB bimodality seen in UMa and Virgo.
For the UMa and Virgo clusters, there is a bimodality of disk surface brightness in spiral galaxies as well as bimodality in effective surface brightness for early-type galaxies. Since previous studies of field galaxies have not shown any evidence for bimodal surface brightness distributions, we might therefore think of structural bimodality as a cluster effect. However, it should be noted that most of the studies of the surface brightness distribution of field galaxies have focused strictly on optical imaging for lack of available complete similar data bases at IR wavelengths. We showed in Figs. 6 & 11 that the bimodality in disk and total surface brightnesses is enhanced in the NIR, due to uncertain and significant corrections for dust at optical wavelengths. None of the major NIR data bases available today (e.g., de Jong 1996; Jarrett et al. 2003; Grauer et al. 2003; MacArthur et al. 2003; Smith et al. 2008) cover the full range of surface brightness to sample the LSB peak. For this reason, it is unclear whether the structural bimodality observed at NIR wavelengths is indeed a cluster effect since it has only been observed in galaxy clusters thus far, or whether it is inherent to galaxies in all environments. Since we see structural bimodality in the most isolated galaxies of the UMa cluster as well as in the denser environment of Virgo, it appears that this effect is independent of environment. New data from field NIR surveys such as PanSTARRS and UKIDSS (e.g., Smith et al. 2008) will be needed to revisit this question for field galaxies (provided careful assessment of completeness for field samples).
We now entertain possible physical interpretations for structural bimodality.
5.3 Differences Between Cluster and Field Galaxies
Dressler (1980) first demonstrated the existence of strong correlations between various galaxy properties and environment. Red sequence galaxies live preferentially in dense environments, whilst blue, star-forming galaxies are predominantly found in isolation. This dependence on environment was reinforced as a major cause for the observed SDSS color and star formation bimodality. Not surprisingly, the local density of galaxies causes a strong morphological bias. Merging and tidal interactions, which are more common in dense environments (Moss & Whittle 1993; Gnedin 2003), can deplete the gas content of spiral and irregular galaxies, turning them into ellipticals and possibly S0s (Toomre & Toomre 1972; Farouki & Shapiro 1981; Barnes 1999). An intracluster gas can also strip gas from late-type galaxies, reducing star formation drastically (Gunn & Gott 1972). Processes such as galaxy-galaxy harassment, tidal stripping, and starvation, which are more efficient in dense environments, will all reduce the amount of active star formation. It is then not surprising that there should be a correlation between color, star formation and environment in this context.
There are also several properties for the dark halo that appear to be dependent on environment. The mass, shape, spin and formation time of dark matter halos formed in denser environments that become clusters or filaments appear to be significantly different than those formed in isolation (Hahn et al. 2007). Simulations suggest that galaxy halos with masses M M∗, where M∗ is the galaxy halo mass at which the mass function turns over, have parameters that correlate strongly with environment, while those with M M∗ do not. Hahn et al. (2007) find that low mass halos are older and have higher angular momenta when formed in proto-cluster environments, while low mass halos in the field form later and have lower angular momenta. The dependence of halo properties on environment could explain part of the observed differences in cluster and field galaxies.
However, using a sample of 329 nearby cluster and field star forming galaxies, Vogt et al. (2004) failed to find any correlation between stellar mass-to-light ratios or circular velocities with environment. More observational and theoretical studies of environmental effects on galaxies will be needed.
5.4 Theoretical Interpretation
We have found so far that the gas-poor and the gas-rich UMa and Virgo cluster galaxies each exhibit a surface brightness bimodality. It is unclear whether this result is unique to clusters, since there is no complimentary NIR survey of field galaxies that reaches the same depth in surface brightness. However, UMa very much resembles the field due to its low density (see TV97), whilst Virgo is a much richer cluster, suggesting that environment may not play a strong role.
This surprising result requires an explanation which current models of galaxy formation fail to provide. However, our results may suggest routes for further investigation and allow the rejection of certain hypotheses. We now address various explanations for the structural bimodality in light of the available data and current theoretical ideas.
-
1.
Stellar Populations: Previous studies based on SDSS imaging for very large number of galaxies have shown bimodal distributions of color and star formation rate (e.g., Strateva et al. 2001), which is largely the result of two galaxy populations: blue, star-forming spiral galaxies and red, quiescent spheroidal galaxies. We showed in §4.5 that color is uncorrelated with the observed surface brightness bimodalities of cluster galaxies; stellar populations are thus unlikely to be a factor.
-
2.
LSB Formation Enhanced in Clusters: If the structural bimodality is only present in clusters, it could result from more efficient tidal torquing in dense environments (Barnes & Efstathiou 1987; Bett et al. 2007; Hahn et al. 2007). If dark matter halos acquire more angular momentum in a proto-cluster environment, then LSB galaxies (which halt their collapse early due to high angular momentum) would preferentially be formed in these dense environments. In this scenario, higher surface brightness galaxies could form from the merging of lower SB galaxies if they contain gas that can dissipate energy before forming stars. One would thus expect a “smearing” of the LSB peak towards HSB, but a discrete gap is still unaccounted for. It has been well documented that there is a maximum surface brightness that galaxy disks will not exceed (Freeman 1970). If this maximal disk surface density is obeyed, then galaxies which evolve at various rates from low to high surface brightnesses via merging may ultimately halt their evolution at a disk surface density equal to the Freeman value, thus enhancing the HSB peak. This scenario does not preclude the formation of ISB galaxies via the merging of two LSB galaxies or other such events, but simply suggests that the ISB case might be a rapid transition stage for galaxies as they merge and evolve towards the Freeman limit. Indeed, we do not see an absence of ISB galaxies in clusters, but rather a relative excess of HSB and LSB galaxies.
Our group is currently studying the velocity function (and thus the distribution of angular momenta) of Virgo cluster galaxies which will provide further insight into this problem. More studies like that of Hahn et al. (2007) would help elucidate the role of environment on the distribution of various dynamical properties.
-
3.
Specific Stable Radial Configurations: Expanding upon the ideas of Mestel (1963), TV97 suggested that galaxy disks could settle into one of two stable radial configurations: disks with a dynamically important baryonic component in the center and those without (also known as maximal and minimal disks). They suggested that intermediate surface brightness galaxies are transient phenomena in high-density environments where interactions re-arrange the baryons. This is supported by the fact that, in UMa, most intermediate surface brightness galaxies have significant neighbors and thus the bimodality is enhanced for isolated systems. However, the lack of ISB galaxies in the densest regions of the Virgo cluster suggests the opposite result.
If the structural bimodality is unaffected by environment then there may be a more fundamental mechanism preventing the stability of ISB galaxies. The ISB regime may correspond to an unstable dynamical configuration, possibly implying a bimodality in the spin parameter, , for disk galaxies.
-
4.
Gas Depletion in Clusters Halts Evolution: The amount of gas retained by cluster and field galaxies differ due to various factors such as high frequency of tidal interactions in clusters (Moss & Whittle 1993; Gnedin 2003) and the dense intracluster medium which can cause gas stripping (Gunn & Gott 1972). If ISB galaxies form primarily via passive evolution and HSB galaxies form primarily via mergers, then the cluster environment would act to prevent LSB-to-ISB evolution and enhance LSB-to-HSB evolution.
Without being able to pinpoint the role that environment plays in the observed structural bimodalities, it is difficult to provide an explanation for their existence. It is likely that no single hypothesis above fully explains the surface brightness bimodality and that the separate bimodalities in early-type and late-type galaxies will require their own explanations (although their alignment and equal spacing, as seen in Table 2, suggests something fundamentally similar!). It is difficult to speculate further without a proper analysis of the distribution of for field galaxies, a complimentary dynamical analysis of the Virgo cluster, as well as detailed numerical simulations for the effects of external processes, such as tidal stripping and mergers, or internal processes, such as outflows, on surface brightness profiles of cluster and field galaxies.
6 Conclusion
We have constructed the deepest complete sample of near-IR photometry of Virgo cluster galaxies to date and with it, we were able to achieve a detailed analysis of the distribution of surface brightness profiles and luminosities for 286 Virgo cluster galaxies. We also extracted photometry from the SDSS for comparative analysis with a larger sample of 742 VCC galaxies. This Virgo cluster study also follows from our re-analysis of similar data for the smaller UMa cluster (McDonald et al. 2008). Our main findings are:
-
•
There exists a structural bimodality in each of the early and late type galaxy populations of the UMa and Virgo clusters. From NIR images of these galaxies, we observe surface brightness peaks at =21.7 and =19.7 for late-type galaxies, and =19.7 and =17.8 mag arcsec-2 for early-type galaxies. These three peaks are independent at a confidence level 90%.
-
•
The observed structural bimodalities in each galaxy class (early or late) is independent of the observed color bimodality.
-
•
The NIR luminosity function for Virgo has a prominent dip at intermediate luminosities which is also seen, to a lesser extent, in the optical SDSS data.
The fact that the dichotomy between HSB and LSB galaxies is independent of color and morphology implies a possible dynamical connection. We have detected a weak, but non-negligible, correlation between and , but more data will be needed to strengthen any dependence. The range of densities from UMa to Virgo also suggests that the mechanism for producing HSB and LSB galaxies is independent of environment. Without a sample of true field galaxies it would, however, be unwise to speculate about any environmental effect on . Unfortunately, current studies of the distribution of surface brightnesses of field galaxies are either hampered by dust extinction in the optical or have not achieved deep and complete enough coverage at NIR wavelengths. Thus, most reasonable scenarios for field/cluster galaxy evolution are still plausible.
The most obvious and relevant test for the hypothesis of different -distributions in cluster and field environments, as proposed by Hahn et al. (2007), is to assemble a complete sample of resolved rotation curves for cluster galaxies. This would enable new constraints on the distribution of the spin parameter, , which may be responsible for setting (e.g., Dutton et al. 2007). Hahn et al. (2007) predict a distribution that is skewed towards high values of in clusters and filaments. A complete sample of resolved dynamical data for cluster and field galaxies should allow a full assessment of the observed structural bimodality in terms of unbiased parameters such as dynamical mass and the slope of the rotation curve.
It has been over ten years since the discovery of the surface brightness dichotomy in disk galaxies by TV97. We have now extended that study to a broader environment to establish the presence of three separate peaks in the distribution of effective surface brightnesses in all galaxies with 90% confidence, and two peaks in the distribution of disk central surface brightnesses in disk galaxies with 95% confidence. The next few years should see significant improvements in the size and scope (e.g., range of surface brightness) of galaxy NIR surveys and in studies into the effect of environment on . The theoretical interpretation for these results however awaits a better determination of for galaxies in the field and in clusters, and a better interpretation of the combined effects of merging and stripping to the overall surface brightness of galaxies.
7 Acknowledgements
We acknowledge valuable conversations with Jeremy Bailin, Aaron Dutton, Julianne Dalcanton, Roelof de Jong, Lauren MacArthur, Hans-Walter Rix, Frank van den Bosch, and Sylvain Veilleux. Many thanks also to Guiseppe Gavazzi for providing precious GOLDMine galaxy images, to Yucong Zhu for providing SDSS luminosities for the VCC/SDSS sample, and to Joel Roediger for his stellar mass-to-light ratios for the Virgo “H-band” galaxies. We are also grateful to Jon Loveday for his careful referee report which led to an improved presentation of our paper.
SC would like to acknowledge financial support via a Discovery Grant from the National Science and Engineering Council of Canada. RBT acknowledges support from US National Science Foundation award AST 03-07706.
This research has made use of the NASA/IPAC Extragalactic Database (NED) which is operated by the Jet Propulsion Laboratory, California Institute of Technology, under contract with the National Aeronautics and Space Administration, as well as NASA’s Astrophysics Data System; the (SDSS). Funding for the creation and distribution of the SDSS Archive has been provided by the Alfred P. Sloan Foundation, the Participating Institutions, the National Aeronautics and Space Administration, the National Science Foundation, the U.S. Department of Energy, the Japanese Monbukagakusho, and the Max Planck Society. The SDSS Web site is http://www.sdss.org/. The SDSS is managed by the Astrophysical Research Consortium (ARC) for the Participating Institutions. the database (http://leda.univ-lyon1.fr).
References
- [Adelman-McCarthy et al.(2008)] Adelman-McCarthy, J. K., et al. 2008, ApJS, 175, 297
- [Andredakis et al.(1995)] Andredakis, Y. C., Peletier, R. F., & Balcells, M. 1995, MNRAS, 275, 874
- [Smith et al.(2008)] Smith, A., Loveday., J, Cross., N. 2008, arXiv:0806.0343v1
- [Bailin & Harris(2008)] Bailin, J., & Harris, W. E. 2008, MNRAS, 385, 1835
- [Baldry et al.(2004)] Baldry, I. K., Glazebrook, K., Brinkmann, J., Ivezić, Ž., Lupton, R. H., Nichol, R. C., & Szalay, A. S. 2004, ApJ, 600, 681
- [Balogh et al.(2004)] Balogh, M. L., Baldry, I. K., Nichol, R., Miller, C., Bower, R., & Glazebrook, K. 2004, ApJ, 615, L101
- [Barnes & Efstathiou(1987)] Barnes, J., & Efstathiou, G. 1987, ApJ, 319, 575
- [Barnes(1999)] Barnes, J. E. 1999, The Evolution of Galaxies on Cosmological Timescales, 187, 293
- [Bell & de Blok(2000)] Bell, E. F., & de Blok, W. J. G. 2000, MNRAS, 311, 668
- [Bell et al. 2003] Bell, E. F., McIntosh, D. H., Katz, N., & Weinberg, M. D. 2003, ApJS, 149, 289
- [Bett et al.(2007)] Bett, P., Eke, V., Frenk, C. S., Jenkins, A., Helly, J., & Navarro, J. 2007, MNRAS, 376, 215
- [Binggeli et al.(1985)] Binggeli, B., Sandage, A., & Tammann, G. A. 1985, AJ, 90, 1681 [VCC]
- [Birnboim & Dekel(2003)] Birnboim, Y., & Dekel, A. 2003, MNRAS, 345, 349
- [Blanton et al.(2003)] Blanton, M. R., et al. 2003, ApJ, 594, 186
- [Brinchmann et al.(2004)] Brinchmann, J., Charlot, S., White, S. D. M., Tremonti, C., Kauffmann, G., Heckman, T., & Brinkmann, J. 2004, MNRAS, 351, 1151
- [Courteau (1996)] Courteau, S. 1996, ApJS, 103, 363
- [Courteau et al.(1996)] Courteau, S., de Jong, R. S., & Broeils, A. H. 1996, ApJ, 457, L73
- [Courteau(1997)] Courteau, S. 1997, AJ, 114, 2402
- [Courteau & Rix(1999)] Courteau, S., & Rix, H.-W. 1999, ApJ, 513, 561
- [Courteau et al.(2007)] Courteau, S., Dutton, A. A., van den Bosch, F. C., MacArthur, L. A., Dekel, A., McIntosh, D. H., & Dale, D. A. 2007, ApJ, 671, 203
- [Dalcanton et al.(1997)] Dalcanton, J. J., Spergel, D. N., & Summers, F. J. 1997, ApJ, 482, 659
- [de Jong(1996)] de Jong, R. S. 1996, A&A, 313, 45
- [de Jong & Lacey(2000)] de Jong, R. S., & Lacey, C. 2000, ApJ, 545, 781
- [de Vaucouleurs(1948)] de Vaucouleurs, G. 1948, Annales d’Astrophysique, 11, 247
- [de Vaucouleurs(1959)] de Vaucouleurs, G. 1959, Handbuch der Physik, 53, 311
- [de Vaucouleurs(1961)] de Vaucouleurs, G. 1961, ApJS, 6, 213
- [Dekel & Birnboim(2006)] Dekel, A., & Birnboim, Y. 2006, MNRAS, 368, 2
- [Dressler(1980)] Dressler, A. 1980, ApJ, 236, 351
- [Driver et al.(2005)] Driver, S. P., Liske, J., Cross, N. J. G., De Propris, R., & Allen, P. D. 2005, MNRAS, 360, 81
- [Dutton et al.(2007)] Dutton, A. A., van den Bosch, F. C., Dekel, A., & Courteau, S. 2007, ApJ, 654, 27
- [Efstathiou(2000)] Efstathiou, G. 2000, MNRAS, 317, 697
- [Efstathiou et al.(1982)] Efstathiou, G., Lake, G., & Negroponte, J. 1982, MNRAS, 199, 1069
- [Fall & Efstathiou(1980)] Fall, S. M., & Efstathiou, G. 1980, MNRAS, 193, 189
- [Farouki & Shapiro(1981)] Farouki, R., & Shapiro, S. L. 1981, ApJ, 243, 32
- [Ferguson & Clarke(2001)] Ferguson, A. M. N., & Clarke, C. J. 2001, MNRAS, 325, 781
- [Foyle et al. 2008] Foyle, K. , Courteau, S., R. Thacker 2008, MNRAS, in print
- [Freeman(1970)] Freeman, K. C. 1970, ApJ, 160, 811
- [Ftaclas et al.(1984)] Ftaclas, C., Struble, M. F., & Fanelli, M. N. 1984, ApJ, 282, 19
- [Gavazzi et al.(1996)] Gavazzi, G., Pierini, D., Baffa, C., Lisi, F., Hunt, L. K., Randone, I., & Boselli, A. 1996, A&AS, 120, 521
- [Gavazzi et al.(2003)] Gavazzi, G., Boselli, A., Donati, A., Franzetti, P., & Scodeggio, M. 2003, A&A, 400, 451
- [Gnedin(2003)] Gnedin, O. Y. 2003, ApJ, 589, 752
- [Grauer et al.(2003)] Grauer, A. D., Rieke, M. J., & Quillen, A. C. 2003, ApJS, 149, 327
- [Gunn & Gott(1972)] Gunn, J. E., & Gott, J. R. I. 1972, ApJ, 176, 1
- [Gunn(1982)] Gunn, J. E. 1982, Astrophysical Cosmology Proceedings, 233
- [Hahn et al.(2007)] Hahn, O., Porciani, C., Carollo, C. M., & Dekel, A. 2007, MNRAS, 375, 489
- [Hinz et al.(2003)] Hinz, J. L., Rieke, G. H., & Caldwell, N. 2003, AJ, 126, 2622
- [Huchtmeier & Richter(1986)] Huchtmeier, W. K., & Richter, O.-G. 1986, A&AS, 64, 111
- [Jarrett et al.(2003)] Jarrett, T. H., Chester, T., Cutri, R., Schneider, S. E., & Huchra, J. P. 2003, AJ, 125, 525
- [Jenkins et al.(2007)] Jenkins, L. P., Hornschemeier, A. E., Mobasher, B., Alexander, D. M., & Bauer, F. E. 2007, ApJ, 666, 846
- [Kambas et al.(2000)] Kambas, A., Davies, J. I., Smith, R. M., Bianchi, S., & Haynes, J. A. 2000, AJ, 120, 1316
- [Kauffmann et al.(2003)] Kauffmann, G., et al. 2003, MNRAS, 341, 33
- [Kent(1985)] Kent, S. M. 1985, ApJS, 59, 115
- [Kereš et al.(2005)] Kereš, D., Katz, N., Weinberg, D. H., & Davé, R. 2005, MNRAS, 363, 2
- [Kirby et al.(2008)] Kirby, E., Jerjen, H., Ryder, S., & Driver, S. 2008, arXiv:0808.2529
- [Kormendy & Kennicutt(2004)] Kormendy, J., & Kennicutt, R. C., Jr. 2004, ARA&A, 42, 603
- [Lin & Pringle(1987)] Lin, D. N. C., & Pringle, J. E. 1987, ApJ, 320, L87
- [MacArthur et al.(2003)] MacArthur, L. A., Courteau, S., & Holtzman, J. A. 2003, ApJ, 582, 689
- [McDonald et al.(2008)] McDonald, M., Courteau, S., & Tully, R. B. 2008, arXiv:0810.5530
- [McGaugh & de Blok(1997)] McGaugh, S. S., & de Blok, W. J. G. 1997, ApJ, 481, 689
- [Mei et al.(2007)] Mei, S., et al. 2007, ApJ, 655, 144
- [Mestel(1963)] Mestel, L. 1963, MNRAS, 126, 553
- [Meurer et al.(2002)] Meurer, G. R., et al. 2002, The 2002 HST Calibration Workshop : Hubble after the Installation of the ACS and the NICMOS Cooling System, 65
- [Mo et al.(1998)] Mo, H. J., Mao, S., & White, S. D. M. 1998, MNRAS, 295, 319
- [Moffat(1969)] Moffat, A. F. J. 1969, A&A, 3, 455
- [Moss & Whittle(1993)] Moss, C., & Whittle, M. 1993, ApJ, 407, L17
- [Paturel et al.(2003)] Paturel, G., Petit, C., Prugniel, P., Theureau, G., Rousseau, J., Brouty, M., Dubois, P., & Cambrésy, L. 2003, A&A, 412, 45
- [Pohlen & Trujillo(2006)] Pohlen, M., & Trujillo, I. 2006, A&A, 454, 759
- [Rees & Ostriker(1977)] Rees, M. J., & Ostriker, J. P. 1977, MNRAS, 179, 541
- [Rines & Geller(2008)] Rines, K., & Geller, M. J. 2008, AJ, 135, 1837
- [Rosenbaum & Bomans(2004)] Rosenbaum, S. D., & Bomans, D. J. 2004, A&A, 422, L5
- [Rubin et al.(1999)] Rubin, V. C., Waterman, A. H., & Kenney, J. D. P. 1999, AJ, 118, 236
- [Sabatini et al.(2003)] Sabatini, S., Davies, J., Scaramella, R., Smith, R., Baes, M., Linder, S. M., Roberts, S., & Testa, V. 2003, MNRAS, 341, 9
- [Sersic(1968)] Sersic, J. L. 1968, Cordoba, Argentina: Observatorio Astronomico, 1968,
- [Skrutskie et al.(2006)] Skrutskie, M. F., et al. 2006, AJ, 131, 1163
- [Smith et al.(2008)] Smith, A. J., Loveday, J., and Cross, N. J. G. 2008, MNRAS (astro-ph/0806.0343)
- [Strateva et al.(2001)] Strateva, I., et al. 2001, AJ, 122, 1861
- [Toth & Ostriker(1992)] Toth, G., & Ostriker, J. P. 1992, ApJ, 389, 5
- [Toomre & Toomre(1972)] Toomre, A., & Toomre, J. 1972, ApJ, 178, 623
- [Trentham & Tully(2002)] Trentham, N., & Tully, R. B. 2002, MNRAS, 335, 712
- [Tully & Verheijen(1997)] Tully, R. B., & Verheijen, M. A. W. 1997, ApJ, 484, 145
- [Tully & Fouque(1985)] Tully, R. B., & Fouque, P. 1985, ApJS, 58, 67
- [van den Bosch(2001)] van den Bosch, F. C. 2001, MNRAS, 327, 1334
- [Vogt et al.(2004)] Vogt, N. P., Haynes, M. P., Giovanelli, R., & Herter, T. 2004, AJ, 127, 3325
- [Wainscoat & Cowie(1992)] Wainscoat, R. J., & Cowie, L. L. 1992, AJ, 103, 332
- [White & Rees(1978)] White, S. D. M., & Rees, M. J. 1978, MNRAS, 183, 341
- [White & Frenk(1991)] White, S. D. M., & Frenk, C. S. 1991, ApJ, 379, 52
- [York et al.(2000)] York, D. G., et al. 2000, AJ, 120, 1579
- [Zavala et al.(2003)] Zavala, J., Avila-Reese, V., Hernández-Toledo, H., & Firmani, C. 2003, A&A, 412, 633
Appendix A A. Model Expectations
In order to characterize the intrinsic distribution of structural parameters such as , and , free from evolutionary effects, we have generated a Monte Carlo suite of idealized galaxy models using combinations of a large number of model parameters. A single galaxy light profile can be determined with 8 basic parameters. For the bulge and disk, the parameters , re,d, , re,b and Sérsic are selected randomly from Gaussian distributions whose widths match roughly observed galaxy distributions. Another 2 parameters govern the location and brightness of spiral arms. The location of the arms varies from 1 to 2 disk scale lengths and the peak arm brightnesses ranges from 0.3 to 0.5 above the disk brightness. Finally, all model profiles were convolved with a Gaussian function to simulate the effect of atmospheric blur; the seeing FWHM is our 8th model parameter. We have also forced 1 in every 5 profiles to be a pure-Sersic function to reflect the presence of systems with no disk. The Gaussian distribution of input parameters for our models is shown in the top 6 panels of Fig. 27.
In order to infuse more realism into this experiment, two different types of error were added to the model profiles: photon (galaxy + sky) random noise and systematic sky subtraction error. We determined the appropriate photon noise in the H-band from the distribution of measured surface brightness errors for our H-band images (McDonald et al. 2009). From this distribution, an error function was determined to add cosmic error to our model surface brightness profiles:
| (9) |
This result is very similar to that produced by Courteau (1996) for -band surface brightness profiles. A typical noise value now is added randomly to each model profile at each surface brightness level.
In order to simulate sky-subtraction errors, a systematic “measurement error” was first determined. This value is of the sky brightness at H-band.This random sky error can artificially produce truncated (over-subtracted sky) or upbending (under-subtracted sky) surface brightness profiles, depending on its sign.
We have generated model galaxies by combining the 8 model parameters, each selected randomly from a realistic range of values, and accounting for random and systematic errors. The recovered parameter distribution for the 100,000 simulated surface brightness profiles can be seen in the lower 3 panels of Fig. 27 for the total galaxy light. The distribution is nearly Gaussian with a peak slightly brighter than the disk peak due to the inclusion of substantial bulges in most profiles. An HSB tail can be seen in the distribution due to severely bulge-dominated systems. These systems have higher values since bulges typically have higher surface brightnesses than disks. The distribution of the parameter is a combination of bulge and disk components; the peak is controlled by the bulge for bulge-dominated systems and the tail is due to disk-dominated systems. Finally, there is a strong peak in the distribution near =2.8, the expectation value for pure-disk systems. Profiles with arise from cored () systems or galaxies with spiral arms. Profiles with or higher are bulge-dominated. values cover the full range from 1.5 to 6.5, in excellent agreement with our data (see §4.4).
With our realistic model surface brightness profiles, we can trace the effects of sky measurement errors. This is important since such errors can drastically affect the shape of the density profile, causing an artificial truncation or anti-truncation at large radii. The distribution of total could thus be biased as a result. In Fig. 28, we show the effect of increasing the sky measurement error from 0.001% to 0.05%. The net effect of a positive sky error is to pull LSB galaxies below the sky noise yielding a faint tail, but the bright SB peak never shifts.
Fig. 29 shows the variations in due to over- and under-subtracted sky errors. An under-subtraction error (upper half) rarely affects the measured by more than 0.2 . An over-subtraction error (lower half) has a more drastic effect as it can shift a significant part of the outer disk below observable levels. Recall that, while these tests about sky errors can be illuminating, the measured H-band sky error is typically 0.005% and the effect of a systematic sky error is thus minimal.
Our simulations confirm that if the input structural parameters are distributed normally, we should expect a nearly normal distribution of effective surface brightnesses. Under no conditions can we generate a distribution of that deviates significantly from the normal function. This result can be used as an unbiased comparison against galaxy structural parameters extracted from real data.


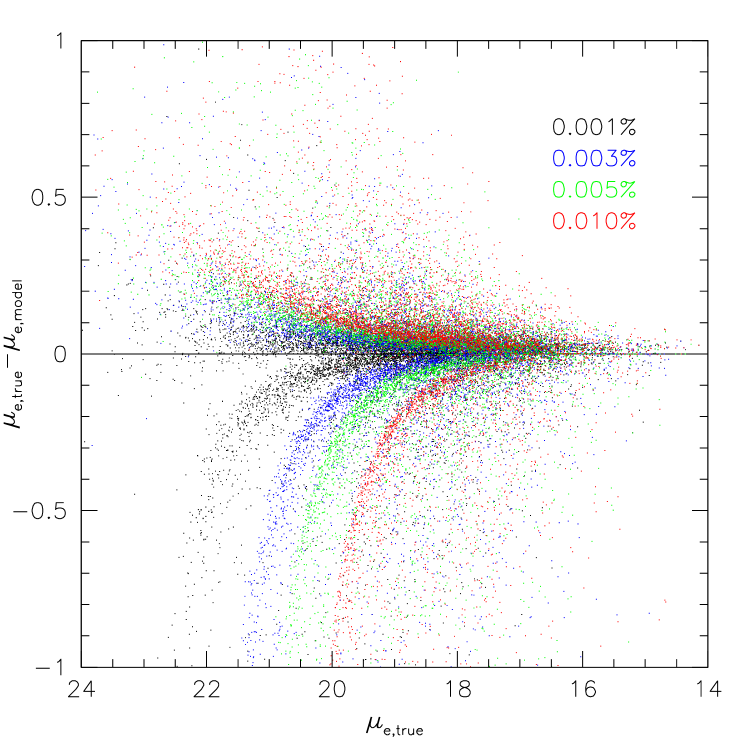
Appendix B B. Galaxy Dynamics
The study of the distribution of galaxy structural parameters from light profiles can benefit greatly from the availability of dynamical information. For instance, TV97 found a clear relationship between a galaxy’s disk central surface brightness and the inner slope of its rotation curve. In order to test this claim, and other correlations between dynamical and photometric parameters, resolved rotation curves would be ideal. Failing any information about the shape of the rotation curves, we resort to 1D measures of maximum rotational velocity. Provided sufficient accuracy, they can, at least, enable global comparisons with light profile parameters for the spiral galaxies in our sample.
We retrieved HI data for 58 VCC galaxies from the Extragalactic Distance Database (EDD; http://edd.ifa.hawaii.edu/) which overlap with our H-band sample. These data have been corrected for aperture and turbulent effects following Tully & Fouqué (1985) who defined the linewidth parameter . We have also verified that the linear (almost 1-to-1) relation between radio and optically measured line widths observed by Courteau (1997) and others is also observed in this sample. All linewidths were deprojected as and is given by:
| (10) |
Here is the galaxy’s axial ratio and is the estimated instrinsic thickness of the disk.
In order to duplicate Fig. 14 from TV97, we are interested in computing the ratio /. Here is the maximum rotation velocity resulting from a purely baryonic system, while is the observed rotation speed (which includes dark matter) at a fiducial radius. TV97 postulate that LSB galaxies tend to be dominated by dark matter all the way into the innermost regions () while HSB galaxies are baryon-dominated within roughly two disk scale lengths (; e.g., Courteau & Rix 1997; D07).
To compute V∗, we use the following equation:
| (11) |
where refers to the luminosity within the radius, , and is the stellar mass-to-light ratio computed using SDSS colors and Bell et al. (2003). The peak value of V is the value we call V∗.
Fig. 30 shows the bivariate distribution of V∗/Vtot as a function of disk central surface brightness, for the spiral and irregular galaxies with available linewidths from the EDD.
We do not see the strong dynamical bimodality that is apparent in TV97, however there does appear to be a correlation between V∗/Vtot and , as well as hints of a bimodality in . LSB galaxies tend to be dark matter-dominated (V∗/V), while HSB galaxies would be baryon-dominated (V∗/V). The galaxies with V∗/V tend to have bright bulges or compact nucleii which cause a spike in the light-weighted rotation curve at short radii. However, with linewidths for only 20% of our sample, it is impossible to make these claims with statistical significance. To do this analysis correctly, we need to either obtain reliable linewidths or deep, resolved, optical rotation curves for the full sample. Our team is currently pursuing a complete characterization of the velocity function of Virgo cluster galaxies in order to address these issues.

.