A new model for archiving synoptic data in the VISTA Data Flow System.
Abstract
The VISTA Data Flow System comprises nightly pipeline and archiving of near infrared data from UKIRT-WFCAM and VISTA. This includes multi-epoch data which can be used to find moving and variable objects. We have developed a new model for archiving these data which gives the user an extremely flexible and reliable data set that is easy to query through an SQL interface. We have introduced several new database tables into our schema for deep/synoptic datasets. We have also developed a set of curation procedures, which give additional quality control and automation. We discuss the methods used and show some example data. Our design is particularly effective on correlated data-sets, where the observations in different filters are synchronised. It is scalable to large VISTA datasets which will be observed in the next few years and to future surveys such as Pan-STARRS and LSST.
Scottish Universities Physics Alliance, Institute for Astronomy, University of Edinburgh, Blackford Hill, Edinburgh, EH9 3HJ, U.K.
1. Introduction
The study of photometrically or astrometrically varying sources has led to many important discoveries in astronomy, e.g. stellar masses from eclipsing binaries; distance scales from stellar parallaxes and pulsating stars; the theory of gravity from planetary motions and the physics of accretion disks from observations of cataclysmic variables.
With new wide field imagers on survey telescopes, large surveys of variable objects have become possible. Over the next few years all sky variability surveys will start with Pan-STARRS (Kaiser 2007) and LSST (Walker 2003). Near infra-red technology has also improved and the UK Infra-red Telescope Wide Field Camera (UKIRT-WFCAM) and the Visible and Infra-red Survey Telescope for Astronomy (VISTA; Emerson et al. 2004) are the first near infrared cameras capable of undertaking large synoptic surveys. Here we discuss the design and implementation of a dynamical relational database science archive for archiving synoptic data observed by UKIRT-WFCAM - WFCAM Science Archive (WSA; Hambly et al. 2008) - and by VISTA - VISTA Science Archive (VSA).
2. Database Design
The basic design of the WSA and VSA is described in detail in Hambly et al. (2008). This work is an extension to incorporate new tables related to using multi-epoch data and is an improvement to our initial design (Cross et al. 2006). Figure 1 shows the new tables and their relationship to existing tables in two entity-relation models (ERMs). The left-hand ERM is for single or uncorrelated multi-wavelength observations and the right-hand side is for correlated multi-wavelength observations.


There are five new tables in the new schema. Two of them only appear in the correlated multi-epoch ERM and the other three appear in both ERMs. The new tables are:
-
•
The SynopticMergeLog table links the different bandpass frames that are taken within a short time of each other in a correlated multi-epoch survey. It is much like the MergeLog, but has the additional primary key attribute of meanMjdObs.
-
•
The SynopticSource table is the merged source catalogue created by merging the detection catalogues from the frames in SynopticMergeLog. This has similar attributes to the Source table, but with a primary key similar to the Detection table. This table makes it easier to get colour information at each epoch and makes the BestMatch table smaller.
-
•
The BestMatch table links the Source table - the unique list of merged bandpass sources from deep stacks - to each observation: either in SynopticSource for a correlated bandpass data set or in Detection for an uncorrelated or single passband data set.
-
•
The Variability table contains the statistical analysis of the multi-epoch data for each source in the BestMatch table. This includes both astrometric and photometric analysis and classifications.
-
•
The VarFrameSetInfo table contains the fits for data across a whole frameSet (as defined in MergeLog). This is useful for understanding the limits of the data in each frame set. The model for the astrometric fit is also recorded here.
These tables can be used together to find and categorise objects. The Variability table can be used to find objects which have interesting statistical properties. Linking this to the Source table and to neighbour tables of external surveys can select objects with very specific morphologies, variable properties, and colours. Only with very specific selections can a scientist hope to find useful targets for follow up in a database of objects. The VarFrameSetInfo table can help define the noise properties of each frameset in each selection. The BestMatch can then be used with either the Detection or the SynopticSource to display the light curve of an object. The attributes in each of these tables are described in detail in the WSA Schema Browser111http://surveys.roe.ac.uk/wsa/www/wsabrowser.html
3. Archive Curation
Once new data has been ingested and quality controlled, curation proceeds as described in Hambly et al. (2008) and Collins et al. (2009):
-
•
production of deep stacks and catalogues.
-
•
deep stacks in different filters merged into Source table.
-
•
intermediate stacks are recalibrated against deep stacks
-
•
creation of SynopticSource and SynopticMergeLog
-
•
neighbour tables created
-
•
creation of BestMatch
-
•
creation of Variability and VarFrameSetInfo
These steps are controlled at each stage by the properties in four curation tables: RequiredStack, RequiredFilters,RequiredNeighbours and RequiredSynoptic. The first three of these are discussed in Collins et al. (2009). RequiredSynoptic specifies whether a survey has correlated passbands and the correlation timescale for the SynopticMergeLog.
The new steps that have been added in are the recalibration of intermediate stacks that typically improves the zeropoints by mag and the synoptic table creation. The recalibration is done by comparing bright stars in each intermediate stacks with ones in the deep stack. Frames which show big changes in zeropoint are deprecated at this stage.
The matching of intermediate stacks to each unique source is the most important step. The SourceXDetection neighbour table is the starting point for the creation of the BestMatch table. The neighbour table links the source to all detections within a set radius. The BestMatch links sources to the nearest match within a smaller radius. If there is no match, and the position lies within an observed frame, then a default row is inserted. Flags are used to alert users to duplicate matches or non-detections close to the edge of a frame. The BestMatch table is a link between sources and observations, and allows users to track objects that disappear (an eclipse, or fading after an outburst).
The statistics in the Variability table are based on good matches in the BestMatch table. The details of all these steps are in Cross et al. (2009). At each stage there are tight constraints on speed, since surveys such as the VISTA Variables in Via Lactea (VVV) survey222http://www2.astro.puc.cl/VVV/index.php/ - a synoptic survey of the galactic plane and bulge - will have sources, each with 100 observations.
4. Examples
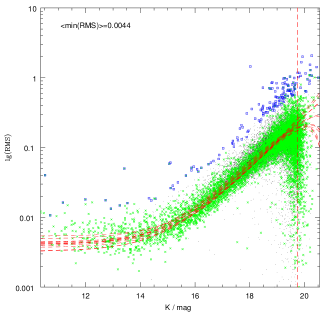
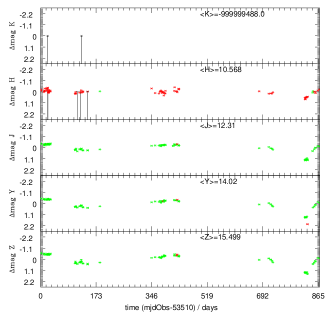
We show some example data from two large data sets, the UKIDSS (Dye et al. 2006) Deep Extragalactic Survey (DXS) and the UKIRT Standard Star calibration data (CAL). Fig 2 shows an example magnitude-RMS plot (useful for determining which objects are variables) and a set of correlated light-curves for a single star. This star was selected in the archive for its variable characteristics from the WSA. These plots can be produced using simple SQL queries that are described in the WSA SQL cookbook333http://surveys.roe.ac.uk/wsa/sqlcookbook.htmlMulti-epoch.
References
Collins, R. S. et al. 2009, in ASP Conf Ser. XXX, ADASS XVIII, ed. D. A. Bohlender, D. Durand & P. Dowler (San Fransisco: ASP),[A.09]
Cross, N. J. G. et al. 2009, in preparation
Cross, N. J. G. et al. 2007, in ASP Conf. Ser. 376, ADASS XVI, ed. R. A. Shaw, F. Hill, & D. J. Bell (San Francisco: ASP), p54
Dye, S. et al. 2006, MNRAS, 372, 1227
Emerson J. P. Sutherland W.J., et al. 2004, ESO Messenger, 117, 27
Hambly, N. C. et al. 2008, MNRAS, 384, 637
Kaiser N. 2007, ”Proceedings of the Advanced Maui Optical and Space Surveillance Conference”, ed. S. Ryan, The Maui Economic Development Board, p9
Walker A. 2003, MmSAI, 74, 999