Globular Cluster Candidates in NGC 8911
Abstract
We use deep images taken with the Advanced Camera for Surveys on board the Hubble Space Telescope of the disk galaxy NGC 891, to search for globular cluster candidates. This galaxy has long been considered to be a close analog in size and structure to the Milky Way and is nearly edge-on, facilitating studies of its halo population. These extraplanar ACS images, originally intended to study the halo field-star populations, reach deep enough to reveal even the faintest globular clusters that would be similar to those in the Milky Way. From the three pointings we have identified a total of 43 candidates after culling by object morphology, magnitude, and colour. We present photometry for all of these, along with measurements of their effective radius and ellipticity. The 16 highest-rank candidates within the whole sample are found to fall in very much the same regions of parameter space occupied by the classic Milky Way globular clusters. Our provisional conclusion from this survey is that the total globular cluster population in NGC 891 as a whole may be almost as large as that of the Milky Way.
keywords:
galaxies: star clusters – globular clusters: general1 Introduction
11footnotetext: This work was based on observations with the NASA/ESA Hubble Space Telescope, obtained at the Space Telescope Science Institute, which is operated by the Association of Universities for Research in Astronomy, Inc.,under NASA contract NAS 5-26555.The stellar content, both the diffuse component and star clusters, of the outskirts of galaxies are among the oldest and the most metal-poor stellar components of galaxies. Their properties are clues to the understanding of how galaxies have assembled their mass, and constrain the early phases of galaxy formation. Recent Hubble Space Telescope (HST) imaging and ground-based spectroscopy of star clusters have revolutionized our understanding of galaxy formation and evolution. However, elliptical and lenticular galaxies have received by far the largest amount of attention due to their much richer globular cluster (GC) systems and freedom from internal extinction. Conversely, our knowledge of GC systems in spirals is still limited to essentially the Galaxy and M31, supplemented by a handful of more distant galaxies (Kissler-Patig et al., 1999; Goudfrooij et al., 2007; Chandar et al., 2004; Rhode et al., 2007; Spitler et al., 2006; Mora et al., 2007). Until very recently, available data indicated that the GC systems of the Galaxy and M31 were quite similar and thus it was natural to assume this held true for spirals in general. However, in the last few years, a growing body of evidence suggests that there are some important differences between the GCSs of these two key spirals. Among these is the likelihood that M31 possesses young, thin disk massive clusters (Morrison et al., 2004), as well as intermediate-age massive clusters (e.g. Beasley et al., 2004), populations that are not present amongst the classically old GCs in the Galaxy. The young and intermediate-age massive clusters in M31 are significantly more massive than any open clusters in the Milky Way. Similar clusters have now been seen in a variety of other spirals (e.g. M33; Chandar et al., 2006). The GC population in M31 also contains a subset of object of extended and diffuse nature, unlike any clusters found in the Milky Way (Huxor et al., 2005, 2008). These objects are found to have similar stellar populations to those of the Milky Way’s old GCs (Mackey et al., 2006), and to fill the gap in structural-parameter space between GCs and dwarf spheroidals (Huxor et al., 2005).
NGC 891, a nearby large late-type disk galaxy, has often been described in shorthand as a “clone” of the Milky Way, since it has a very similar total luminosity, bulge size, and disk with prominent dust lanes (e.g. van der Kruit, 1984). A study of surface-brightness photometry (Morrison et al., 1997) revealed the presence of an extensive thick disk. Its orientation almost precisely edge-on to our line of sight makes it particularly attractive for studies of its disk and halo stellar populations, facilitating comparative studies of components such as the thick disk, stellar streams and substructures, and the total visible mass and extent of the halo. In addition, NGC 891 is close enough to us that HST imaging is easily capable of resolving the halo stars, enabling direct star-by-star statistical studies of its old stellar populations. Using deep HST imaging of three extra-planar fields extending outward to more than 10 kpc from the plane of the galaxy, we have been studying the resolved stellar populations to investigate the spatial strucuture, the bi-dimensional distribution, to search for substructure, and to constrain the metallicity distribution functions.
One obvious component of its halo that has not been investigated to similar detail is the GC system. If this galaxy is indeed similar to the Milky Way, then of these luminous, old star clusters should be present and relatively easy to find. A signal pointing in the opposite direction, however, is found in the pioneering effort to search for a GC population in NGC 891 by van den Bergh & Harris (1982), from starcounts on wide-field photographic plates. They found no conclusive evidence for any GCs and an upper limit of on the specific frequency. It should be realized, however, that this imaging material was taken with seeing quality and had a much brighter limiting magnitude than is conventionally possible with modern cameras, making it difficult to find traces of a GC population in the presence of significant field contamination. Also, with such material, individual GCs cannot be distinguished either from foreground stars or faint, small background galaxies, and both types of contaminants are present in large numbers within the NGC 891 field.
In the present paper, for the first time we conduct a search for, and characterization of, individual GCs in NGC 891. Contrary to our original expectations, we find that this galaxy does indeed have a roughly normal GC population for its size and type. Throughout this paper, we adopt the distance modulus ( Mpc) derived by Mouhcine et al. (2007), along with a foreground reddening and from the NASA/IPAC Extragalactic Database (NED).
2 The Database and Initial Searches
The raw data consist of the same deep HST images taken with the Wide Field Channel of the Advanced Camera for Surveys (ACS/WFC) camera used in previous papers in this series (Mouhcine et al., 2007; Ibata et al., 2008; Rejkuba et al., 2008). In these papers, Mouhcine et al. (2007) discuss the stellar halo population; Ibata et al. (2008) present a structural analysis to establish the presence of a thick disk and a stellar halo as well as small-scale substructures in the halo; and Rejkuba et al. (2008) investigate the stellar populations of the thick disk and the inner halo.
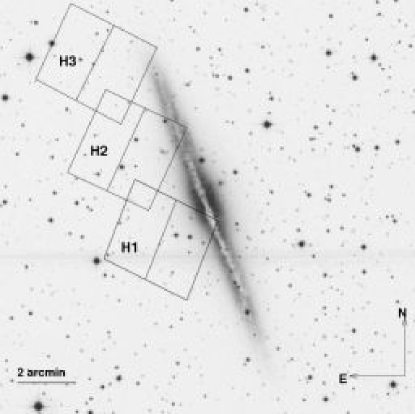
Images were taken at three pointings running parallel to, and east of, the disk of NGC 891. A finder chart for these three fields (labelled H1, H2, H3) is shown as Figure 1 of Mouhcine et al. (2007) and is reproduced here in Figure 1. The three fields were placed to probe both the disk and thick disk of the galaxy over a wide radial range as well as the inner halo, with slight overlaps between fields to ensure photometric consistency. For each field, the ACS/WFC observations consist of three full-orbit integrations in both F606W and F814W (for convenience we refer to these below as and ). The photometry reaches to , approximately 3 magnitudes below the tip of the red giant branch. Artificial-star experiments were performed to estimate the completeness of our data set. These were carried out in the usual fashion with artificial stars generated from the stellar point spread function (PSF) constructed during the photometry measurements. The 50 per cent completeness limit, for colours typical of old simple stellar populations (i.e., ), occurs at depending on galactocentric distance and crowding. Rejkuba et al. (2008) give a thorough description of the data, the data reduction process, and the completeness simulations; we therefore refer the reader to this paper for the details.
To start the process of identifying candidate GCs, we visually inspected every part of each field and marked any objects that might possibly be globular clusters. The selection was done independently in each filter. The western sides of fields H1 and H2 particularly are heavily contaminated by the bulge light and planar dust lanes in the galaxy, so to aid the identification process we first subtracted off median-smoothed versions of the fields (unsharp masking) using a square median filter box. The images very obviously resolve the stellar halo red-giant population of NGC 891, with the brightest normal red giants lying at . The faintest known GCs in the Milky Way lie at this level or brighter (with the vast majority at , translating to at the distance of NGC 891) and so these images should sample virtually the entire GC luminosity distribution. The fact that the NGC 891 halo stars are well resolved also means that at least some of its GCs could show some degree of resolution of their individual red giants outside their cores; some examples of these are shown later.
The main search criteria for this initial round of selection were that GC candidates should be (a) at least as bright as the brightest halo red giants, (b) relatively uncrowded, and (c) morphologically symmetric; that is, with no features such as small spiral arms, tidal tails, companions etc. that would be clear markers of faint background galaxies. This initial selection was deliberately made very generous; at this stage, no candidate was rejected by ellipticity, scale size, location, or colour.
3 Refining the Candidate List
With these preliminary lists identified, contaminants were weeded out through a series of objective criteria. First was to match the lists in both filters and keep only those identified on both and . This step quickly removes any extremely red or extremely blue objects, or potential artifacts appearing on one filter only.
The next stage was to measure the characteristic size and shape of each object. We used the ISHAPE profile-fitting code of Larsen (1999) to derive the effective (half-light) radius and ellipticity of each object. On each image, 15 to 20 moderately bright, uncrowded stars were combined with iraf/daophot to construct an empirical PSF for the frame. For each candidate GC, ISHAPE was then used to convolve the PSF with a “King30” model profile, i.e. a King (1962) model with concentration index characteristic of the average for known globular clusters. Here as usual and are the King-model core and tidal radii. The assumed effective radius and axial ratio of the model are then varied till a best fit is achieved (see Larsen, 1999, for extensive discussion of the technique). Extensive simulations by Larsen (1999) and Harris (2009) show that the derived are nearly independent of the assumed ratio in situations like this one where (see below).
Because NGC 891 is relatively nearby, the size range parsecs typifying the majority of GCs in the Milky Way converts to a range of angular size or about 1 to 2.5 pixels on the ACS/WFC camera. Objects this extended can be termed “partially resolved” because their intrinsic radii are comparable to, or smaller than, the PSF, but they are easily distinguishable from stars: The stellar PSF on the ACS/WFC has a FWHM pixels, and extensive tests of the ISHAPE profile fitting code (e.g. Larsen, 1999; Harris, 2009) show that the effective radii of partially resolved objects such as these can be correctly detected and measured down to 20% of the PSF FWHM, and even smaller under conditions of high S/N. Thus all GCs with characteristic sizes comparable to those in the Milky Way should be easily found. These size measurements can then quickly be used to eliminate all stars from our sample of candidate GCs.
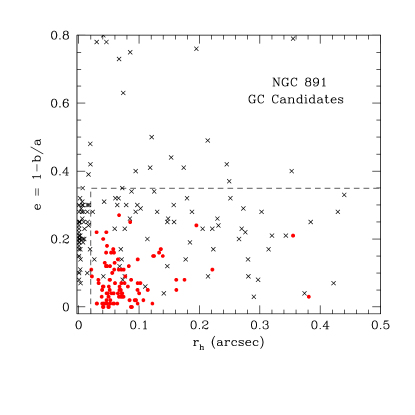
Use of the ellipticities is also effective. Small differences in mean GC shapes have been found from galaxy to galaxy that are not yet well understood (e.g. Harris et al., 2002; Han & Ryden, 1994), but these differences are minor, and the vast majority of known GCs in any galaxies surveyed so far are quite round in projected shape () and virtually none are known with .
In Figure 2 we show the distribution of the candidate objects measured in both and by their ISHAPE-determined values of and . For comparison, the same data for the Milky Way GCs (Harris, 1996) are shown as well (solid dots in the Figure), where their values are projected to the size they would appear if placed at the 9.7-Mpc distance of NGC 891. The candidate list has a large number of objects at ; these are probable stars and can rather safely be rejected. We also conservatively eliminate any with , a limit well above the most elliptical known Milky Way clusters. Additional visual inspection of these highly elongated objects confirms that they are likely to be background galaxies; none have any indication of being resolved into stars, and many are next to other obvious galaxies on the fields. The one exception we made to this exclusion was for a few very faint candidates that may be resolved into stars and were also somewhat elongated. Three examples of these are shown in one of the figures below. These have luminosities and effective radii that, if they are indeed clusters, would make them roughly comparable to the Palomar-type clusters in the Milky Way or even fainter. We regard their true nature as more uncertain than most of the rest of the sample, but keep them in the list.
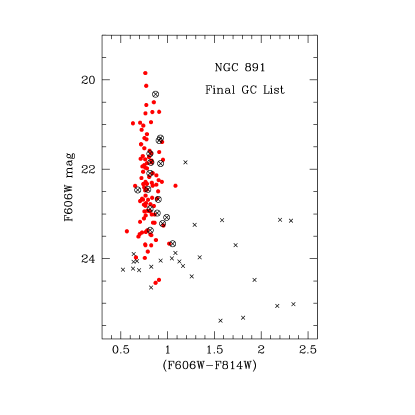
The third stage of culling is to use colour and magnitude. The raw colour-magnitude diagram (CMD) for the 81 candidates surviving the structural parameter tests is shown in Figure 3. Among these are five which appear on the small overlap areas between H1/H2 and H2/H3 and were identified on both. In the CMD, we plot the apparent magnitudes and colour indices in the filter system native to ACS (), as measured through iraf/daophot and aperture photometry with an aperture radius px . This aperture size corresponds to about for a median GC in the Milky Way and thus safely includes most of its light. Cluster-to-cluster differences in mean that any fixed-aperture photometry will not include the same fraction of their true total magnitude, but at this stage we are more strongly interested in the cluster colors, and for the many GC candidates projected on the bulge and disk regions of NGC 891, the aperture radius needs to be as small as possible to avoid large uncertainties from field contamination. The calibration of the photometry follows the recent filter zeropoints published by STScI, and where represents the measured counts per second. These magnitudes can be converted to following the empirical transformations of Sirianni et al. (2005), namely and ; we also use these in the later discussion.
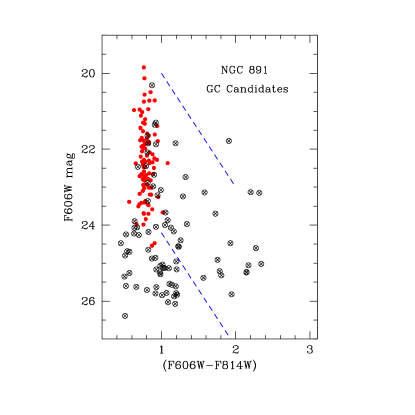
The known Milky Way globular clusters (shown for comparison in the figure) occupy a narrow range in colour, and a range in magnitude that is limited to if projected to the distance of NGC 891. However, we very conservatively define our “best”, highest-confidence sample of GC candidates to be the ones in the region . There are 16 such objects, which by definition have clearly survived all of our rejection tests by scale size, ellipticity, and photometry. Although several others are in the same blue color range and in the fainter magnitude range , close inspection of these fainter ones on the images shows that they are probably made up of a wide mixture including small bulge or disk clusters, faint and small background galaxies, and perhaps the occasional classic GC. In addition, if most of these actually were real GCs then it would immediately imply that the globular cluster luminosity function (GCLF) in NGC 891 would be very different from that of the Milky Way, much more strongly weighted to the faint end. For these reasons we do not rank them in the highest-confidence list.
We cannot immediately reject candidates that are redder than the Milky Way GC sequence because individual objects may be reddened by the heavy dust lanes within NGC 891 itself. However, clusters sitting behind significant amounts of dust extinction would be most likely to fall within the range shown by the upper and lower reddening lines in the figure. We therefore reject objects falling clearly below this region, i.e. those with and . Again, close inspection of the visual appearance of these very faint objects shows that virtually all of them are consistent with identification as small, distant background galaxies.
In addition, we can reject very red objects that are located spatially well away from the plane of NGC 891. In Figure 4, the colours for the remaining candidates are plotted against their projected distance above the plane of the galaxy. The large circled crosses show the 16 “best” objects that fall closest to the normal GC sequence in the colour-magnitude diagram. The candidates with and kpc can be rejected since they are far redder than any known star clusters; note that no models of old simple stellar populations can account for such red colours, and these same objects are unlikely to be heavily reddened since there is no detectable trace of heavy dust extinction of any kind at such large distances from the plane. Using the Hi map of Oosterloo et al. (2007) to estimate the reddening following the Galactic calibration of Rachford et al. (2008) indicates that although the correction is substantial near the galactic plane, the correction declines rapidly away from the plane, so that at the outer edge of the ACS survey region, the estimated internal extinction as derived from the Hi column density amounts to less than 0.001 mag.

Our final list of GC candidates, after all the culling steps described above, consists of the 43 objects listed in Table 1. Successive columns give (1) a running ID number, (2) the ACS field on which it lies, (3,4) right ascension and declination (J2000) in decimal degree format as calculated from the astrometric parameters directly from the image headers, (5,6) location (pixels) on the particular ACS field, (7-8) magnitudes, colours, and internal uncertainties, (9) half-light radius in arcseconds, (10) ellipse-fitted axial ratio as measured from ISHAPE, and (11) any comment on the object ranking or type; here, “LSB” means low surface brightness.
A definitive test of membership in NGC 891 would be direct measurement of radial velocity. The mean velocity of the galaxy is km s-1, thus its GCs should all have km s-1. Because of our morphological selection criteria, the final candidate sample has no foreground stars, so the only remaining contaminants can be faint background galaxies and perhaps a few massive open clusters in the disk or bulge of NGC 891 itself. However, only 14 candidates are brighter than , making velocity measurements challenging for all but these few.
4 Discussion
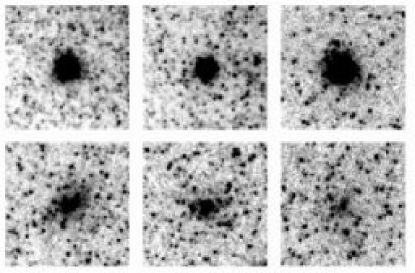
After the many stages of weeding out individual contaminants, it is encouraging that we have numerous objects that do indeed resemble normal GCs closely even though the various culling stages were quite conservative. In Figure 5 we show thumbnail images of six of the candidates, demonstrating their partial resolution into stars. In the top row, three of the brightest are shown, and in the bottom row, three of the faintest. As noted above, we regard the identifications of the faintest ones as generally more uncertain, and in some cases it may be more likely that they are actually background galaxies. However, we prefer to keep some contaminants in the list rather than to miss a few real clusters.
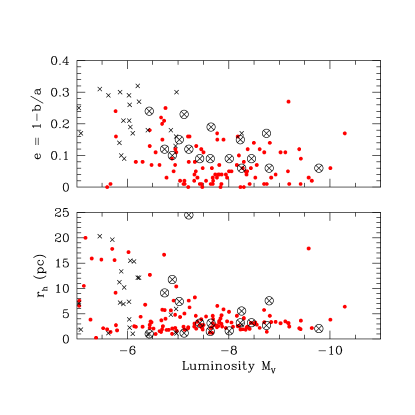
More quantitative comparisons can be seen in Figures 6 and 7. These two figures illustrate that our 16 best candidates have colours, magnitudes, half-light radii, and ellipticities all closely resembling those of normal GCs in the Milky Way. Full histogram comparisons between the two galaxies to search for any finer differences would be inconclusive given the small sample size of NGC 891 GCs. The lack of NGC 891 candidates with formal ellipticities smaller than (compared with the Milky Way, which has many such clusters) cannot be assigned too much weight given the internal fitting uncertainties in ISHAPE for these partially resolved objects; but if real, it would indicate that the NGC 891 clusters are more similar in ellipticity to those in the Magellanic Clouds or NGC 5128 (Harris et al., 2002; Han & Ryden, 1994).
The plot of versus luminosity shows hints of the same trends in the Milky Way clusters, namely that the lower envelope of points shows gradually increasing cluster scale size with luminosity; and that the scatter in increases at fainter luminosity. The GC candidate with the biggest scale size, G40 at pc (lying at the uppermost edge of the lower panel in Fig. 7), is indeed an extended and bright object but does not show strong traces of resolution into stars and may be a background galaxy. Deeper images or radial velocity measurement would make a definitive test.
The other 27 candidates mostly occupy the low-luminosity sides of both graphs, and show larger dispersions in both and that also match the Milky Way spread quite well. Unfortunately, however, many of these candidates are likely to be background galaxies as well.
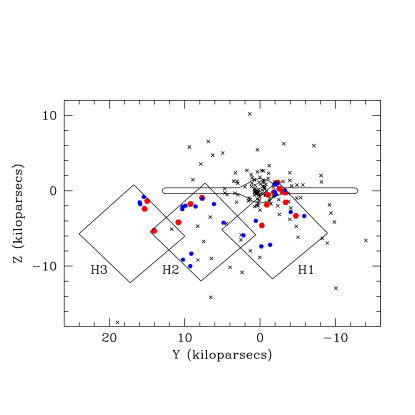
As another comparison with the Milky Way, we show the spatial locations of the NGC 891 clusters in Figure 8, where in kiloparsec units are the projected distance components parallel and perpendicular to the plane of the galaxy. The galactic center is at . The orientation of the figure is chosen to match Figure 3 in Ibata et al. (2008). Here, as a schematic comparison, the positions of the Milky Way GCs are shown projected on the same plane, essentially viewing our galaxy as it would be seen from outside, and looking inward along the line connecting the Sun to the Galactic center. This choice of two-dimensional projection minimizes the effects of random distance errors to individual Milky Way clusters, most of which lie toward the Galactic center.
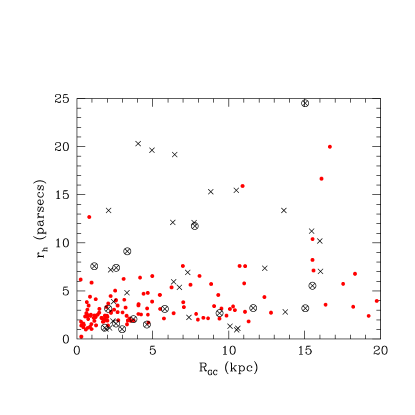
Lastly, in Figure 9 the distribution of cluster scale size versus galactocentric distance is shown. In this case the Milky Way data (small dots) are for projected Galactocentric distance to make the graph for the two galaxies strictly comparable. In the Milky Way we see the well known trend for the mean to increase gradually with (e.g. van den Bergh al., 1991; Jordán et al., 2005) and for the range in to increase at larger as well. The NGC 891 data hint barely at the same increase amidst the large scatter. Five of the NGC 891 clusters have radii that fall clearly above the Milky Way distribution, however; these are G07, G08, G13, G19, and G40. If at least some of these five are not contaminants, we can speculate that they may have originated in dwarf satellite galaxies within which GCs have characteristically larger radii (see Da Costa et al., 2009, for a recent discussion). Such an origin would mesh well with our analysis of the NGC 891 stellar halo (Ibata et al., 2008) which shows significant substructure and indicates that at least some part of it has been accreted from satellites. Without more material than our presently rather slim GC sample to base it on, it is risky to carry such discussion further.
Field H1 is closest to the galaxy center and bears out our expectations that it should contain the most GCs of the three fields (see Fig. 8). Furthermore, any GCs particularly in H1 that happen to lie behind the heavy dust lanes there may well be escaping detection, so by symmetry we might then expect that the true total GC population in H1 is as much as twice as large as the 10 good candidates and 9 lesser-quality ones we actually see. Combining all the preceding arguments, we estimate very roughly that our three observed fields may contain high-quality GC candidates over all magnitudes after correction for contamination and for losses due to extinction.
Estimating the total GC population within the entire galaxy requires a large extrapolation from the severely limited area coverage of our survey. Our three ACS fields cover the region to the east side of the northern disk, so they can take in at most of the entire population. We therefore suggest, albeit tentatively, that the total should be and perhaps as large as . Alternately, we can compare the number of cluster candidates in our three fields with the number of Milky Way clusters that fall within the same area when projected onto the same scale (see Fig. 8). In the Figure, 30 to 35 Milky Way clusters fall within the marked-out areas of H1/2/3, compared with anywhere from 16 to 43 candidates in our defined list for NGC 891. Since the total cataloged population of Milky Way clusters is approximately 150, these ratios suggest that the total population of NGC 891 globular clusters is in the range of to 200, in good agreement with the previous estimate. The resulting specific frequency (van den Bergh & Harris, 1982) is then , if we adopt a galaxy luminosity from the NED database. This specific frequency would put NGC 891 reasonably in the range of most known disk galaxies similar to the Milky Way (e.g. Harris, 2001).
In summary, our admittedly restricted look at the globular cluster system of NGC 891 leads us to conclude that it resembles that of the Milky Way rather closely in approximate total numbers, spatial distribution, and structural properties of the individual clusters. Our data clearly cover only a very limited region of the NGC 891 halo, and a more comprehensive targetted search should be able to increase the GC sample by a factor of five or more.
| ID | Field | RA | Dec | (px) | (px) | (arcsec) | Comment | |||
|---|---|---|---|---|---|---|---|---|---|---|
| G01 | H1 | 35.624222 | 42.338615 | 5480.3 | 3664.0 | 22.089 0.007 | 0.811 0.013 | 0.0342 | 0.91 | best |
| G02 | H1 | 35.625717 | 42.338867 | 5400.6 | 3682.1 | 24.065 0.041 | 1.126 0.070 | 0.0828 | 0.79 | bulge |
| G03 | H1 | 35.625805 | 42.339149 | 5396.0 | 3702.4 | 25.020 0.086 | 2.344 0.093 | 0.0397 | 0.83 | bulge |
| G04 | H1 | 35.627125 | 42.339451 | 5325.7 | 3724.1 | 24.245 0.111 | 0.522 0.216 | 0.1530 | 0.70 | bulge |
| G05 | H1 | 35.627289 | 42.340481 | 5316.9 | 3798.3 | 25.323 0.291 | 1.806 0.319 | 0.2844 | 0.84 | bulge |
| G06 | H1 | 35.629326 | 42.331100 | 5209.0 | 3122.7 | 23.243 0.035 | 1.289 0.048 | 0.1025 | 0.82 | disk |
| G07 | H1 | 35.629837 | 42.335514 | 5181.5 | 3440.6 | 23.077 0.031 | 0.990 0.051 | 0.1576 | 0.85 | best |
| G08 | H1 | 35.631474 | 42.330360 | 5094.6 | 3069.6 | 23.366 0.029 | 0.814 0.050 | 0.1939 | 0.88 | best |
| G09 | H1 | 35.631748 | 42.332382 | 5079.9 | 3215.0 | 23.669 0.053 | 1.054 0.084 | 0.0217 | 0.76 | best |
| G10 | H1 | 35.634480 | 42.338356 | 4934.3 | 3645.2 | 23.996 0.035 | 1.046 0.068 | 0.0222 | 0.83 | disk |
| G11 | H1 | 35.635334 | 42.338711 | 4888.8 | 3670.6 | 22.981 0.012 | 0.889 0.031 | 0.0250 | 0.77 | best |
| G12 | H1 | 35.636715 | 42.336533 | 4815.4 | 3513.9 | 24.476 0.143 | 1.928 0.155 | 0.0246 | 0.71 | disk |
| G13 | H1 | 35.640335 | 42.342419 | 4622.6 | 3937.4 | 21.301 0.006 | 0.923 0.009 | 0.1609 | 0.94 | best |
| G14 | H1 | 35.640930 | 42.327168 | 4591.4 | 2839.4 | 20.320 0.002 | 0.871 0.003 | 0.0440 | 0.94 | best |
| G15 | H1 | 35.647358 | 42.309727 | 4249.5 | 1583.5 | 25.388 0.034 | 1.565 0.039 | 0.1142 | 0.88 | LSB |
| G16 | H1 | 35.648632 | 42.320786 | 4181.6 | 2379.6 | 24.399 0.018 | 1.258 0.023 | 0.4173 | 0.36 | galaxy? |
| G17 | H1 | 35.650364 | 42.315956 | 4089.4 | 2031.9 | 22.673 0.005 | 0.900 0.007 | 0.0666 | 0.91 | best |
| G18 | H1 | 35.650578 | 42.340332 | 4077.4 | 3786.9 | 22.450 0.006 | 0.789 0.009 | 0.0669 | 0.81 | best |
| G19 | H2 | 35.668228 | 42.389709 | 4683.5 | 3592.4 | 23.215 0.014 | 0.946 0.021 | 0.2499 | 0.90 | best |
| G20 | H2 | 35.668983 | 42.389130 | 4643.3 | 3550.5 | 23.872 0.020 | 1.083 0.032 | 0.2574 | 0.73 | disk |
| G21 | H2 | 35.669926 | 42.379181 | 4593.4 | 2834.3 | 23.140 0.007 | 1.581 0.009 | 0.1266 | 0.84 | galaxy? |
| G22 | H1 | 35.670647 | 42.343815 | 3009.4 | 4037.5 | 24.646 0.023 | 0.823 0.033 | 0.4319 | 0.69 | LSB |
| G23 | H1 | 35.672882 | 42.338108 | 2890.5 | 3626.5 | 22.464 0.004 | 0.681 0.006 | 0.0321 | 0.91 | best |
| G24 | H2 | 35.678722 | 42.396378 | 4125.4 | 4072.4 | 21.355 0.003 | 0.909 0.004 | 0.0573 | 0.83 | best |
| G25 | H2 | 35.679241 | 42.392036 | 4097.8 | 3759.7 | 23.972 0.014 | 1.342 0.018 | 0.3257 | 0.43 | galaxy? |
| G26 | H2 | 35.682297 | 42.399582 | 3935.3 | 4302.9 | 23.150 0.006 | 2.318 0.007 | 0.0285 | 0.87 | cluster? |
| G27 | H2 | 35.684418 | 42.401455 | 3822.5 | 4437.9 | 24.043 0.011 | 0.925 0.015 | 0.3288 | 0.81 | cluster? |
| G28 | H2 | 35.684708 | 42.366974 | 3807.5 | 1955.0 | 25.844 0.044 | 1.008 0.059 | 0.4078 | 0.36 | LSB |
| G29 | H2 | 35.685135 | 42.401295 | 3784.2 | 4426.2 | 23.698 0.008 | 1.727 0.009 | 0.0202 | 0.82 | star? |
| G30 | H2 | 35.686897 | 42.400967 | 3690.6 | 4402.6 | 23.132 0.006 | 2.201 0.007 | 0.0238 | 0.70 | star? |
| G31 | H1 | 35.688915 | 42.326588 | 2037.0 | 2797.1 | 24.181 0.010 | 0.825 0.015 | 0.1472 | 0.79 | galaxy? |
| G32 | H3 | 35.689495 | 42.432602 | 5072.7 | 2963.6 | 24.260 0.015 | 0.695 0.024 | 0.2386 | 0.86 | galaxy? |
| G33 | H2 | 35.689682 | 42.348801 | 3542.9 | 646.6 | 23.897 0.009 | 0.638 0.013 | 0.2577 | 0.68 | galaxy? |
| G34 | H3 | 35.692303 | 42.428921 | 4923.5 | 2698.4 | 21.872 0.003 | 0.925 0.004 | 0.0680 | 0.85 | best |
| G35 | H1 | 35.693783 | 42.332630 | 1778.0 | 3232.2 | 24.057 0.010 | 0.672 0.015 | 0.0479 | 0.74 | galaxy? |
| G36 | H3 | 35.696560 | 42.433994 | 4697.0 | 3063.5 | 25.059 0.022 | 2.172 0.024 | 0.1496 | 0.75 | galaxy? |
| G37 | H3 | 35.698162 | 42.433067 | 4612.1 | 2996.9 | 24.165 0.011 | 1.165 0.014 | 0.2167 | 0.91 | galaxy? |
| G38 | H3 | 35.701077 | 42.428608 | 4457.4 | 2675.5 | 21.846 0.003 | 0.821 0.004 | 0.1177 | 0.94 | best |
| G39 | H2 | 35.701416 | 42.400101 | 2918.6 | 4340.1 | 21.651 0.003 | 0.811 0.004 | 0.0685 | 0.91 | best |
| G40 | H2 | 35.719254 | 42.415409 | 1970.6 | 5442.5 | 22.888 0.005 | 0.813 0.007 | 0.5212 | 0.88 | best |
| G41 | H2 | 35.727627 | 42.381878 | 1524.6 | 3028.4 | 24.070 0.010 | 0.636 0.015 | 0.1566 | 0.71 | galaxy? |
| G42 | H2 | 35.736752 | 42.386242 | 1039.4 | 3342.8 | 21.844 0.003 | 1.190 0.004 | 0.0599 | 0.83 | galaxy? |
| G43 | H2 | 35.740395 | 42.379120 | 845.3 | 2830.1 | 24.223 0.010 | 0.631 0.016 | 0.2842 | 0.90 | galaxy? |
Acknowledgements
This work was supported by the Natural Sciences and Engineering Research Council of Canada through research grants to WEH.
References
- Beasley et al. (2004) Beasley M. A., Brodie J, P., Strader J., Forbes D. A., Proctor R. N., Barmby P., Huchra J. P., 2005, AJ, 129, 1412
- Chandar et al. (2004) Chandar R., Whitmore B. C., & Lee M. G., 2004, ApJ, 611, 220
- Chandar et al. (2006) Chandar R., Fall S. M., & Whitmore B. C., 2006, ApJ, 650L, 111
- Da Costa et al. (2009) Da Costa, G. et al. 2009, AJ, submitted
- Goudfrooij et al. (2007) Goudfrooij P., Strader J., Brenneman L., Kissler-Patig M., Minniti D., & Huizinga E., 2003, MNRAS, 343, 665
- Han & Ryden (1994) Han, C., & Ryden, B.S. 1994, ApJ, 433, 80
- Harris (1996) Harris, W.E. 1996, AJ, 112, 1487
- Harris (2001) Harris, W.E. 2001, in Star Clusters, Saas-Fee Advanced Course 28, Swiss Society for Astronomy and Astrophysics, ed. L. Labhardt and B. Binggeli (Springer)
- Harris (2009) Harris, W.E. 2009, ApJ, submitted
- Harris et al. (2002) Harris, W.E., Harris, G.L.H., Holland, S.T., & McLaughlin, D.E. 2002, AJ, 124, 1435
- Huxor et al. (2005) Huxor A. P., et al., 2005, MNRAS, 360, 1007
- Huxor et al. (2008) Huxor A. P., Tanvir N. R., Ferguson A. M. N., Irwin M. J., Ibata R., Bridges T., Lewis G. F., 2008, MNRAS, 385, 1989
- Ibata et al. (2008) Ibata R., Mouhcine M., Rejkuba M., 2008, MNRAS, submitted
- Jordán et al. (2005) Jordán, A. et al. 2005, ApJ, 634, 102
- Kissler-Patig et al. (1999) Kissler-Patig M., Ashman K. M., Zepf S. E., Freeman K. C., 1999, AJ, 118, 197
- King (1962) King I., 1962, AJ, 67, 471
- Larsen (1999) Larsen, S. 1999, A&AS, 139, 393
- Mackey et al. (2006) Mackey A. D., et al., 2006, ApJ, 653, 105
- Mora et al. (2007) Mora M. D., Larsen S. S., Kissler-Patig M., 2007, A&A, 464, 495
- Morrison et al. (1997) Morrison, H.L., Miller, E.D., Harding, P., Stinebring, D.R., & Boroson, T.A. 1997, AJ, 113, 2061
- Morrison et al. (2004) Morrison, H.L., et al., 2004, ApJ, 603, 87
- Mouhcine et al. (2007) Mouhcine, M., Rejkuba, M., & Ibata, R. 2007, MNRAS, 381, 873
- Oosterloo et al. (2007) Oosterloo, T., Fraternali, F., & Sancisi, R., 2007, AJ, 134, 1019
- Rachford et al. (2008) Rachford B. L., Snow T. P., Destree J. D., Ross T. L., Ferlet R., Friedman S. D., Gry C., Jenkins E. B., et al., 2008, arXiv:0809.3831
- Rejkuba et al. (2008) Rejkuba M., Mouhcine M., Ibata R., 2008, MNRAS, In preparation
- Rhode et al. (2007) Rhode K. L., Zepf S. E., Kundu A., Larner A. N., 2007, AJ, 134, 1403
- Sirianni et al. (2005) Sirianni, M. et al. 2005, PASP, 117, 1049
- Spitler et al. (2006) Spitler L. R., Larsen S., Strader J., Brodie J. P., Forbes D. A., Beasley M. A., 2006AJ, 132, 1593
- van den Bergh & Harris (1982) van den Bergh, S., & Harris, W.E. 1982, AJ, 87, 494
- van den Bergh al. (1991) van den Bergh, S., Morbey, C., & Pazder, J. 1991, ApJ, 375, 594
- van der Kruit (1984) van der Kruit, P.C. 1984, A&A, 140, 470