First-principles theory of coloration of WO3 upon charge insertion
Abstract
We report first-principles investigations of the coloration of WO3 upon charge insertion, using sodium tungsten bronze (NaxWO3) as a model system. Our results explain well the systematic color change of NaxWO3 from dark blue to violet, red-orange, and finally to golden-yellow as sodium concentration increases from 0.3 to unity. Proper accounts for both the interband and the intraband contributions to the optical response are found to be very important for a detailed understanding of the coloration mechanism in this system.
Electrochromic materials Granqvist (1995); Cranqvist et al. (2007) exhibit reversible and persistent change of the optical properties, hence their color, upon applying an electrical pulse that injects both electrons and compensating ions into the material. Potential applications of electrochromic materials range from information display, light shutters, to energy efficient smart windows Granqvist (1995); Cranqvist et al. (2007). Tungsten trioxide Deb (1969, 1973) is one of the most extensively studied electrochromic materials due to its superior coloration efficiency, short response time and reversibility Granqvist (1995). Enhanced electrochromic properties in WO3 nanowires have been reported recently Chen et al. (2007); Liao et al. (2006). Despite much research effort, a first-principles theory for the coloration mechanism in this material has not emerged. Here we report density functional theory (DFT) Hohenberg and Kohn (1964) investigations of the coloration mechanism of WO3 upon charge insertion. Our results explains very well the systematic change in color Granqvist (1995); Goodenough (1971); Raj et al. (2007) of NaxWO3 from dark blue to metallic golden-yellow with increasing sodium concentration. We find that proper accounts for the free-carriers contribution to the optical response are critical for a quantitative understanding of the coloration mechanism in this system.
Undoped stoichiometric WO3 is a transparent semiconductor. Double injection of electrons and compensating ions (e.g., H+, Li+, or Na+) by an electric pulse induces a dark blue color in the electrochromic WO3 film. Despite intense research over the last three decades, the mechanism of electrochromism remains controversial Granqvist (1995); Faughnan et al. (1975); Hersh et al. (1975); Hashimoto and Matsuoka (1991); Monk (1999); Karazhanov and Zhang (2003). Interestingly, sodium tungsten bronze (NaxWO3) also shows various bluish colors at low sodium concentrations. Therefore, it is likely that both systems share the same fundamental coloration mechanism Hersh et al. (1975), and the formation of tungsten bronze might be responsible for the electrochromism in WO3. Furthermore, the color of NaxWO3 changes from dark blue to violet, red-orange, and finally to golden-yellow as sodium concentration increases from 0.3 to unity Granqvist (1995); Goodenough (1971); Raj et al. (2007). A consistent theory should be able to explain the color of NaxWO3 for a wide range of Na concentration. Unfortunately, although the electronic and structural properties of NaxWO3 has been studied extensively Goodenough (1971); Raj et al. (2007); Owen and Teegarden (1978); Langell and Bernasek (1981); Davies and Franz (1986); Egdell and Hill (1982); Kielwein et al. (1995); Hjelm et al. (1996); Walkingshaw et al. (2004); Ingham et al. (2005), a quantitative understanding of its vivid color change with varying Na content is still lacking.
Materials color from first principles — The apparent color of a material is intimately related to its optical absorption spectra. With the advance of modern electronic structure methods, various optical properties can be routinely calculated nowadays. However, to the best of our knowledge, there have been no reports of calculating the apparent color of materials from first-principles. The complicated physiology of human color perception makes calculating the apparent color of a material rather difficult. Fortunately, the color space Smith and Guild (1931-1932) defined by the International Commission of Illumination (CIE), the CIE 1931 XYZ color space, provides a mathematical foundation for a quantitative description of colors.
The CIE XYZ color space defines three color matching functions, , , and as shown in Fig. 1. The XYZ tristimulus values for an object illuminated by a light source with a spectral power distribution are then given by
| (1) |
where [or ] is the wavelength (frequency) dependent reflectivity of the object. The CIE XYZ color space is related to the well-known CIE RGB color space by the following linear transformation:
| (2) |
The reflective color and the relative brightness of a material can be constructed once we obtain the tristimulus values X, Y, and Z, or alternatively, R, G, and B.
For an ideal semi-infinite crystal, the normal incidence reflectivity is related to the complex index of refraction and the macroscopic complex dielectric function via
| (3) |
The imaginary part of the dielectric function due to interband transitions can be calculated using DFT-based first-principles electronic structure techniques:
| (4) |
where is the polarization of light, is the velocity operator, () denotes unoccupied conduction states (occupied valence states). The real part of the dielectric function is related to the imaginary part through the Kramers-Kronig relations. In undoped semiconductors, only the interband transitions contribute to the optical response. In metals or doped semiconductors, however, the free-carriers contributions to the optical response are very important. These contributions can be conveniently modeled on the basis of the Drude theory:
| (5) |
In the above equations, , , and are, respectively, the density, optical effective mass, and relaxation time of the free carriers. Combining both the interband and intraband contributions thus gives the imaginary part of the total electronic dielectric function .
Electronic structure and optical properties of Na1.0WO3 — Tungsten trioxide comprises of corner-sharing WO6 octahedra Granqvist (1995); Salje and Viswanathan (1975). Several metal ions can be incorporated into the structure to form tungsten bronzes. Among them sodium tungsten bronze (NaxWO3) is the most extensively studied system owing to its unusual optical properties and dramatic changes in colorGranqvist (1995); Goodenough (1971); Raj et al. (2007) with increasing . NaxWO3 assumes a simple cubic structure for Na contents and undergoes a sequence of structural changes with decreasing Ribnick et al. (1963); Brown and Banks (1954). The cubic phase can be synthesized under nonequilibrium conditions down to 0.2 Kielwein et al. (1995); McNeill and Conroy (1962). Our study covers Na concentration . For simplicity, we assume a cubic structure for all Na concentrations studied. Our calculations are based on DFT within the local density approximation (LDA) Kohn and Sham (1965). In order to avoid inconvenient (i.e., large) unit cells for systems with fractional , we adopt the virtual crystal approximationNordheim (1931); Bellaiche and Vanderbilt (2000) in which fractional Na compositions are modeled by pseudoatoms with appropriate nuclear charges and valence electrons. We use the experimental lattice constants of NaxWO3, which can be conveniently expressed by the Vegard’s law Brown and Banks (1954). The Brillouin zone summation in Eqn. 4 is carried out on a dense uniform grid with an energy broadening of 0.3 eV.
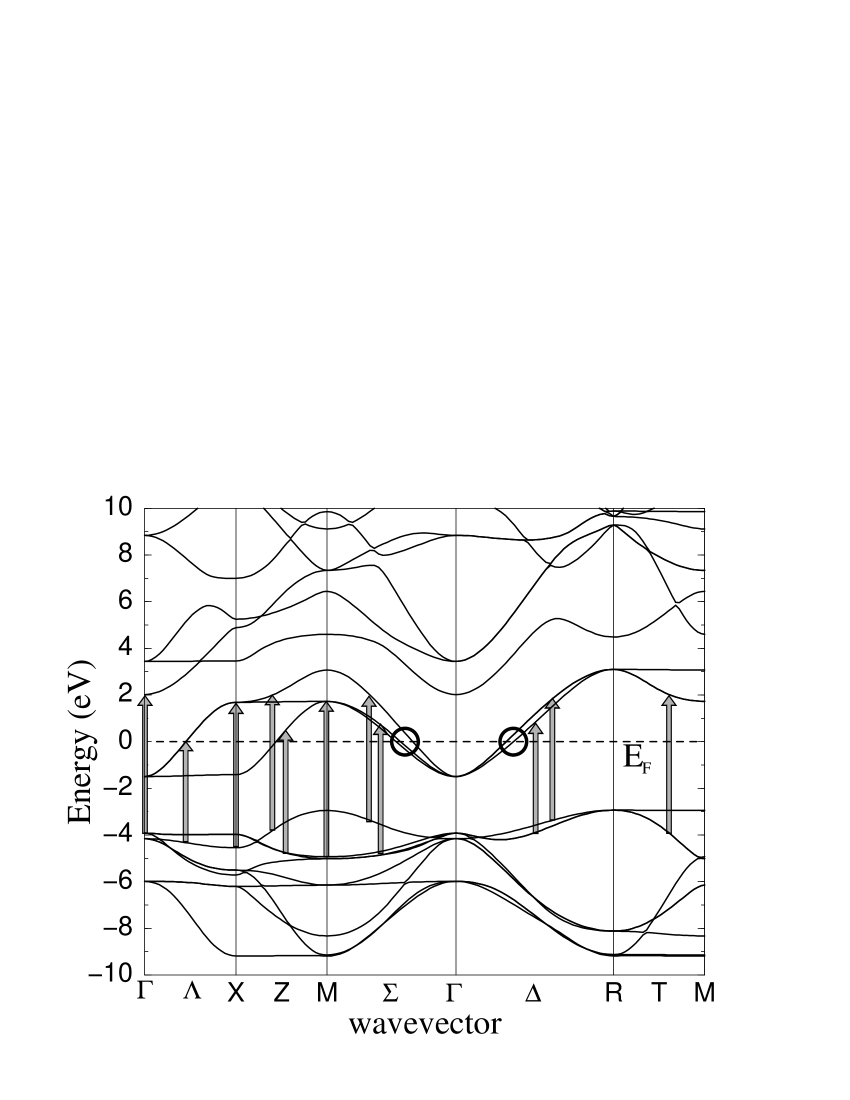
Figure 2 (a) shows the band structure of Na1.0WO3, the ending system of the series studied. As mentioned previously, Na1.0WO3 displays a distinct golden-yellow color. The electronic band structure suggests, however, that the strong interband transitions mainly occur across an energy window of eV. This falls well above the visible energy window and cannot explain its golden-yellow appearance. There are also inter-subband transitions as indicated by circles in Fig. 2 (a). However, the energies of these transitions are very low (less than 1.0 eV) and cannot be responsible for the optical response in the visible range neither. Therefore, a proper account for the free carriers (intra-band) contributions is critical for a quantitative understanding of the optical properties of this system.
Figure 2 (b) shows the calculated reflectivity spectra of Na1.0WO3, with and without including the free-carriers response. The unscreened plasma frequency in Eqn. 5 is calculated using the measured effective mass Owen and Teegarden (1978). It is clear that the reflectivity in the visible range (1.5 3.0 eV) is dominated by the free carriers contribution (which is renormalized by the interband transitions as explained below). The spectra is fairly uniform and featureless for photon energy eV if the free carriers plasma response is not included. As a result, Na1.0WO3 would appear dark gray (more precisely, slightly bluish dark gray as shown in the inset of Fig. 2 (b) without taking into account the free-carriers contributions. These contributions significantly enhance the reflectivity below 2.5 eV and suppresses the reflectivity around 3.0 eV, resulting in the golden-yellow appearance of Na1.0WO3 as shown in the inset of Fig. 2 (b). The onset of the free-carriers enhanced reflectivity corresponds to the renormalized (screened) plasma frequency , defined by . The renormalized plasma frequency is related to the bare value (defined in Eqn. 5) by , which can be measured in electron energy loss spectroscopy experiments. Figure 2 (c) shows the calculated loss spectra of Na1.0WO3, which agree well with experiment Kielwein et al. (1995). Both the plasmon and interband excitations can be clearly identified.
Optical properties and the color of NaxWO3 — The results for Na1.0WO3 encourages us to carry out a systematic study of the optical properties of NaxWO3, with the hope that a quantitative understanding of dramatic color change of NaxWO3 with varying might be within the reach of today’s first-principles electronic structure techniques. Figure 3 (c) shows the calculated reflectivity for NaxWO3 (). The onset of the free-carriers enhanced reflectivity shifts to shorter wavelengths as increases. This is because the screened plasma frequency increases with increasing free-carrier concentration. These results agree very well with the measurements by Brown and Banks Brown and Banks (1954) and by Goldner et al. Goldner et al. (1990) except for an overall rescaling of the absolute magnitude of the reflectivity (likely due to sample quality and/or diffuse loss of light intensity).
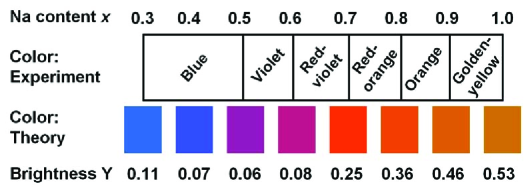
With these results in hand, we are now ready to calculate the XYZ and RGB tristimulus values (defined in Eqn. 1 and 2) of NaxWO3, and hence their colors. We assume that the illumination light source is uniform, i.e., constant in Eqn. 1. Figure 3 (b) shows the calculated RGB components as functions of . Note that the RGB values are normalized to unity for perfect reflectors []. At low Na concentrations (), the blue component dominates. This couples with the overall low reflectivity to give a dark bluish color for these systems as shown in Fig. 3 (c). In order to better illustrate the color, the RGB tristimulus values are rescaled to give an even brightness in Fig. 3 (c). The calculated values for the relative brightness are also shown in the figure. The brightness values are normalized such that a perfect reflector will have a brightness of unity.
As increases beyond 0.6, both the red and green components are greatly enhanced, resulting in the red-orange to golden-yellow metallic appearance of these systems (shown in Fig. 3 (c). For intermediate Na concentration (), red and blue components dominate; the systems thus appear violet to red-violet. Therefore, our theory is able to explain the systematic color change of NaxWO3 from dark blue to metallic golden-yellow as increases from 0.3 to 1.0. We mention that the description of color is somewhat subjective and it is not surprising that slightly different descriptions (e.g., purple v.s. violet) Granqvist (1995); Goodenough (1971); Raj et al. (2007) of the apparent color of NaxWO3 are seen in literature.
In summary, we have carried out first-principles calculations of the optical properties, and hence the color, of NaxWO3. The apparent color is constructed using the CIE 1931 color matching functions and the calculated reflectivity spectra. Our results clearly explains the systematic color change of NaxWO3 as varies and provide direct evidence that the coloration of WO3 upon charge insertion is a result of the subtle interplay between the interband and intraband optical response. The reflectivity is greatly enhanced below the screened plasma frequency, which explains the vivid color change of NaxWO3 as Na concentration increases. In addition, we demonstrate that first-principles electronic structure theory can predict the apparent color of crystalline materials and may help to design materials with desired colors for various applications.
Acknowledgements.
We thank Dr. M. D. Jones for his assistance in coding. This work was supported in part by National Science Foundation Grant No. CBET-0844720 and by the UB 2020 Interdisciplinary Research Development Fund (IRDF). We acknowledge the computational support provided by the Center for Computational Research at the University at Buffalo, SUNY.References
- Granqvist (1995) C. G. Granqvist, Handbook of Inorganic Electrochromic Materials (Elsevier, Amsterdam, 1995).
- Cranqvist et al. (2007) C. G. Cranqvist, G. A. Niklassan, and A. Azens, Applied Physics A 89, 29 (2007).
- Deb (1969) S. K. Deb, Applied Optics 3, 193 (1969).
- Deb (1973) S. K. Deb, Philosophical Magazine 27, 801 (1973).
- Chen et al. (2007) H. Chen, N. Xu, S. Deng, J. Zhou, Z. Li, H. Ren, J. Chen, and J. She, Journal of Applied Physics 101, 14303 (2007).
- Liao et al. (2006) C. Liao, F. Chen, and J. Kai, Solar Energy Materials and Solar Cells 90, 1147 (2006).
- Hohenberg and Kohn (1964) P. Hohenberg and W. Kohn, Phys. Rev. B 136, B864 (1964).
- Goodenough (1971) J. B. Goodenough, in Progress in Solid State Chemistry, edited by H. Heiss (Pergamon, Oxford, UK, 1971), vol. 5, pp. 144–399.
- Raj et al. (2007) S. Raj, H. Matsui, S. Souma, T. Sato, T. Takahashi, A. Chakraborty, D. D. Sarma, P. Mahadevan, S. Oishi, W. H. McCarroll, et al., Phys. Rev. B 75, 155116 (2007).
- Faughnan et al. (1975) B. W. Faughnan, R. S. Crandall, and P. M. Heyman, RCA Review 36, 177 (1975).
- Hersh et al. (1975) H. N. Hersh, W. E. Kramer, and J. H. McGee, Appl. Phys. Lett. 27, 646 (1975).
- Hashimoto and Matsuoka (1991) S. Hashimoto and H. Matsuoka, J. Appl. Phys. 69, 933 (1991).
- Monk (1999) P. M. S. Monk, Critical Reviews in Solid State and Materials Sciences 24, 193 (1999).
- Karazhanov and Zhang (2003) S. Z. Karazhanov and Y. Zhang, Phys. Rev. B 68, 233204 (2003).
- Owen and Teegarden (1978) J. F. Owen and K. J. Teegarden, Phys. Rev. B 18, 3827 (1978).
- Langell and Bernasek (1981) M. A. Langell and S. L. Bernasek, Phys. Rev. B 23, 1584 (1981).
- Davies and Franz (1986) J. H. Davies and J. R. Franz, Phys. Rev. Lett. 57, 475 (1986).
- Egdell and Hill (1982) R. G. Egdell and M. D. Hill, Chemical Physics Letters 85, 140 (1982).
- Kielwein et al. (1995) M. Kielwein, K. Saiki, G. Roth, J. Fink, G. Paasch, and R. G. Egdell, Phys. Rev. B. 51, 10320 (1995).
- Hjelm et al. (1996) A. Hjelm, C. G. Granqvist, and J. M. Wills, Phys. Rev. B. 54, 2436 (1996).
- Walkingshaw et al. (2004) A. D. Walkingshaw, N. A. Spaldin, and E. Artacho, Phys. Rev. B. 70, 165110 (2004).
- Ingham et al. (2005) B. Ingham, S. C. Hendy, S. V. Chong, and J. L. Tallon, Phys. Rev. B. 72, 075109 (2005).
- Smith and Guild (1931-1932) T. Smith and J. Guild, Transactions of the Optical Society 33, 73 (1931-1932).
- Salje and Viswanathan (1975) E. Salje and K. Viswanathan, Acta Cryst. A31, 356 (1975).
- Ribnick et al. (1963) A. S. Ribnick, B. Post, and E. Banks, in Advance in Chemistry Series, Vol. 39 (American Chemical Society, Washington, DC, 1963), vol. 39, p. 246.
- Brown and Banks (1954) B. Brown and E. S. Banks, J. Am. Chem. Soc. 76, 963 (1954).
- McNeill and Conroy (1962) W. McNeill and L. E. Conroy, J. Chem. Phys. 36, 87 (1962).
- Kohn and Sham (1965) W. Kohn and L. J. Sham, Phys. Rev. 140, A1133 (1965).
- Nordheim (1931) L. Nordheim, Annalen der Physik (Berlin, Germany) 9, 607 (1931).
- Bellaiche and Vanderbilt (2000) L. Bellaiche and D. Vanderbilt, Phys. Rev. B 61, 7877 (2000).
- Goldner et al. (1990) R. B. Goldner, G. Berrera, F. O. Arntz, T. E. Haas, B. Morel, and K. K. Wong, in Proceedings of the Symposium on Electrochromic Materials (The Electrochem. Soc., Pennington, 1990), vol. 90-2, pp. 14–22.

|

|

|

|

|
|
.