Different types of ultraluminous X-ray sources in NGC 4631
Abstract
We have re-examined the most luminous X-ray sources in the starburst galaxy NGC 4631, using XMM-Newton, Chandra and ROSAT data. The most interesting source is a highly variable supersoft ULX. We suggest that its bolometric luminosity a few erg s-1 in the high/supersoft state: this is an order of magnitude lower than estimated in previous studies, thus reducing the need for extreme or exotic scenarios. Moreover, we find that this source was in a non-canonical low/soft (– keV) state during the Chandra observation. By comparing the high and low state, we argue that the spectral properties may not be consistent with the expected behaviour of an accreting intermediate-mass black hole. We suggest that recurrent super-Eddington outbursts with photospheric expansion from a massive white dwarf (), powered by non-steady nuclear burning, may be a viable possibility, in alternative to the previously proposed scenario of a super-Eddington outflow from an accreting stellar-mass black hole. The long-term average accretion rate required for nuclear burning to power such white-dwarf outbursts in this source and perhaps in other supersoft ULXs is – yr-1: this is comparable to the thermal-timescale mass transfer rate invoked to explain the most luminous hard-spectrum ULXs (powered by black hole accretion). The other four most luminous X-ray sources in NGC 4631 (three of which can be classified as ULXs) appear to be typical accreting black holes, in four different spectral states: high/soft, convex-spectrum, power-law with soft excess, and simple power-law. None of them requires masses .
Subject headings:
X-rays: binaries — X-rays: individual (NGC 4631) — black hole physics1. Introduction
The most luminous non-nuclear X-ray sources in nearby galaxies occur in regions of current or recent star formation. Some of them have X-ray luminosities exceeding the isotropic Eddintgton luminosity for an black hole (BH); they are commonly labelled ultraluminous X-ray sources (ULXs). The conservative interpretation is that the large majority of ULXs are the upper end of the high-mass X-ray binary population, powered by an accreting BH formed from “normal” stellar processes. If so, their (apparent) extreme luminosity is due to any of the following three reasons, or to a combination of them: moderately unisotropic emission (King et al., 2001; King, 2008); mildly super-Eddington luminosities (Begelman, 2002, 2006; Ohsuga & Mineshige, 2007); extremely heavy stellar-mass BHs, with masses – (Pakull & Mirioni, 2002). Those scenarios also require mass accretion rates , where the accretion parameter . Alternatively, there is still room for the more intriguing hypothesis that at least some ULXs are powered by intermediate-mass BHs (Miller & Colbert, 2004).
In the absence of direct kinematic measurements (because of the faintness of their optical counterparts), X-ray spectral and timing studies have been used to try and constrain BH masses in ULXs. Such model-dependent arguments rely on the (expected) simple scaling of characteristic variability timescales and disk temperatures with BH mass, and on the correspondence of ULX spectral states with the “canonical” states of Galactic BHs, for which the mass is accurately known. Unfortunately, ULXs do not appear to have the same state-transition behavior as Galactic BHs; for example, the most luminous sources are rarely found in a high/soft state, dominated by a standard accretion disk (Soria & Kuncic, 2008). The X-ray spectra of some ULXs are dominated by an unbroken power law, with photon index –, whose physical origin is still unclear. Others have a broad component with a steepening or downward curvature above keV and sometimes a small soft excess below keV; this kind of spectrum may come from a slim disk, or from the inner region of a standard disk, heavily modified by Comptonization when . However, there is no clear gap between the two kinds of spectra, and the phenomenological classification of a source in either class usually depends on the signal-to-noise ratio available in the observations.
A small subsample of ULXs stands out from this general spectral classification: they have a thermal spectrum with temperatures keV and no emission above 1 keV. This is similar to the spectrum of classical supersoft sources in the Milky Way and Magellanic Clouds, but their luminosity is one or two orders of magnitude higher. The two most luminous supersoft ULXs are M101 ULX-1 (Kong & Di Stefano, 2005) and NGC 4631 X1 (Carpano et al., 2007). Both sources are strongly variable or transient; when in a high state, their blackbody luminosity is erg s-1. Other supersoft ULXs reaching bolometric luminosities erg s-1 have been found in M81 (Swartz et al., 2002), in the Antennae (Fabbiano et al., 2003) and (two) in NGC 300 (Carpano et al., 2006; Kong & Di Stefano, 2003). Their thermal spectra can, in principle, provide tighter constraints on the size of the emitting region, and hence more significant tests for the geometry of the accretion flow and the nature and mass of the accretor.
While ULXs with a harder (power-law-like, slim-disk or Comptonized) X-ray spectrum may be interpreted as the upper end or the natural extension (either in BH mass or accretion rate) of stellar-mass BHs, supersoft ULXs appear like the upper end of nuclear-burning white dwarfs, which cannot be more massive than . Therefore, their high apparent luminosities are even more difficult to explain. The white dwarf scenario may be salvaged if supersoft ULXs are seen in a transient outburst phase, well above the Eddington luminosity of a white dwarf ( erg s-1). The other main competing scenarios for the emitting region in supersoft ULXs are a strong outflow from a stellar-mass BH accreting at a super-Eddington rate (), or a standard disk around an intermediate-mass BH. For the disk to be so cool ( keV), the BH mass needs to be .
In this paper, we re-examine the physical interpretation of the supersoft ULX in NGC 4631, by comparing the XMM-Newton observations taken when the source was in a more luminous state, with earlier Chandra observations in a lower state. We also discuss the physical nature of the other four most luminous X-ray sources in the XMM-Newton dataset.
| Source ID | ROSAT ID | R.A. | Dec. | Emitted LuminosityaaFrom Kalberla et al. (2005). Units of cm-2.bbRaymond-Smith model normalization , where is the angular size distance to the source (cm), is the electron density (cm-3), and is the hydrogen density (cm-3). (erg s-1) | |||
|---|---|---|---|---|---|---|---|
| Chandra/ACIS | XMM-Newton/EPIC | ROSAT/HRI | ROSAT/PSPC | ||||
| X1 | H13 | 12 42 15.96 | 32 32 49.4 | ||||
| X2 | - | 12 42 11.13 | 32 32 35.8 | - | - | ||
| X3 | - | 12 42 06.07 | 32 32 46.5 | - | - | ||
| X4 | H8 | 12 41 57.35 | 32 32 03.2 | ||||
| X5 | H7 | 12 41 55.56 | 32 32 16.9 | ||||
a For the supersoft source X1:
bolometric luminosity ( eV); for the other sources:
unabsorbed luminosity in the – keV band.
b The error ranges listed for Chandra
and XMM-Newton luminosities come from our spectral fitting;
the error ranges for ROSAT luminosities include
only the Poisson uncertainty in the HRI and PSPC count rates,
after assuming the XMM-Newton best-fitting model
for counts-to-flux conversion.
| XSPEC model | (eV) | (erg s-1) | |
|---|---|---|---|
| phabsGal*phabs*bb | |||
| phabsGal*phabs*(bb+gauss) | |||
| phabsGal*phabs*(bb+ray) | |||
| phabsGal*phabs*(bb+ray)*zedge | |||
| phabsGal*(ray+phabs*bb) | |||
| phabsGal*(ray+phabs*bb)*zedge |
2. Observations and Data Analysis
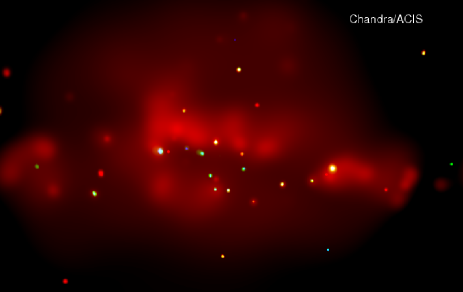
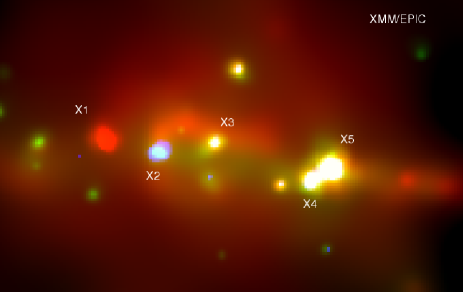
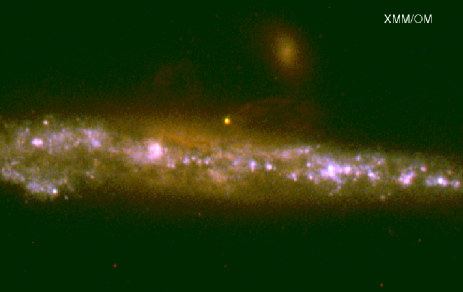
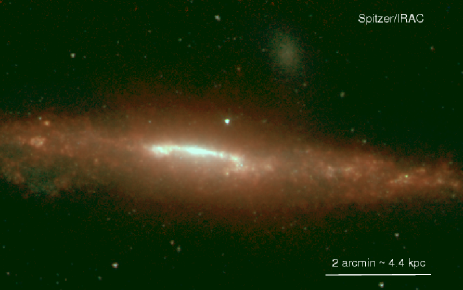
NGC 4631 is a late-type starburst galaxy (Hubble type SB(s)d), seen nearly edge-on (Figure 1), at a distance of Mpc (Seth, Dalcanton & de Jong, 2005). In addition to a large number of giant starforming complexes, it has one of the best examples of galactic fountains, outflows and hot gas above the disk plane (Strickland et al., 2004a, b; Wang et al., 2001). From its integrated far-infrared luminosity, its star-formation rate is yr-1 (Strickland et al., 2004a; Soifer et al., 1989; Kennicutt, 1998). In the X-ray band, NGC 4631 was studied with Einstein (Fabbiano, Kim & Trinchieri, 1992), ROSAT (Vogler & Pietsch, 1996; Read, Ponman & Strickland, 1997; Liu & Bregman, 2005), Chandra (Wang et al., 2001) and XMM-Newton (Tüllmann et al., 2006a, b; Feng & Kaaret, 2005; Winter, Mushotzky & Reynolds, 2006, 2007; Carpano et al., 2007). Here, we focus on the five brightest point-like sources in the XMM-Newton dataset (including four ULXs), and in particular on the supersoft ULX (Carpano et al., 2007), whose nature is still controversial.
Chandra observations of NGC 4631 with the Advanced CCD Imaging Spectrometer (ACIS) were carried out on 2000 April 16, for 60 ks (ObsID 797; Principal Investigator: Daniel Wang). We retrieved the data from the public archive, and analysed them with the locally-developed software tool LEXTRCT (Tennant, 2006). Source detection in LEXTRCT was performed using a circular Gaussian approximation to the point spread function (PSF), which gives higher weight to sources with a central concentration of events. Point-source counts and spectra were extracted from within the 95% encircled-energy aperture of the model PSF. The background was extracted from annular regions surrounding the sources, except in crowded regions of the field where we used background regions adjacent to the sources. The background-subtracted counts within the source regions were scaled to obtain the aperture-corrected count values. The background-subtracted point-source detection limit is 14 counts for the 2.8 minimum sigal-to-noise ratio (S/N) threshold and a minimum 5 above background. For timing analysis, we binned the X-ray light curves of the brightest sources into 1000-s bins, and computed tests against a constant flux hypothesis. For spectral analysis, we generated spectral redistribution matrices and ancillary response files with the Chandra X-ray Center software CIAO version 3.4. We then used XSPEC version 12.0 (Arnaud, 1996) to fit the point-source spectra.
A 55-ks XMM-Newton observation with the European Photon Imaging Camera (EPIC) was carried out on 2002 June 28 (ObsID 0110900201; Principal Investigator: Michael Watson). We downloaded the public-archive data and processed them with the XMM-Newton Science Analysis System (SAS) version 6.5.0. We used LEXTRCT for source detection, and standard XMMSELECT tasks within the SAS for source and background region extraction. The radius of the source extraction regions was , except for X4, where we used a radius to reduce contaminations from the nearby brighter source X5. Background extraction regions were chosen around the source regions, in a suitable way to avoid contamination. After building response and ancillary response files with rmfgen and arfgen we used XSPEC for spectral analysis of the brightest sources (Table 1). To improve the signal-to-noise ratio, we co-added the EPIC pn and MOS spectra, with suitably averaged response functions, using the method of Page et al. (2003).
To investigate the long-term variability of the ULXs, we also re-analyzed the archival ROSAT/HRI and PSPC observations carried out between 1991 December and 1992 December (Vogler & Pietsch, 1996; Read, Ponman & Strickland, 1997). We applied astrometric corrections to the ROSAT data using the Chandra source positions. We extracted source counts from circular regions of 30″radius, and background counts from source-free circular regions of 3′radius. We used WebPIMMS with the best-fitting spectral parameters from the XMM-Newton study to convert ROSAT source count rates into fluxes. Three (X1=H13, X4=H8, and X5=H7; see Table 1 and Vogler & Pietsch (1996)) of the five luminous targets of this study were also found in ROSAT, with some variability over the various exposures.
| Parameter | XMM-Newton Value |
|---|---|
| aaFrom Kalberla et al. (2005). Units of cm-2. | |
| (keV) | |
| bbRaymond-Smith model normalization , where is the angular size distance to the source (cm), is the electron density (cm-3), and is the hydrogen density (cm-3). | |
| (keV) | |
| ccBlackbody model normalization where is the source luminosity in units of erg s-1 and is the distance in units of kpc. | |
| (keV) | |
| /dof | |
| ddObserved flux in the – keV band; units of erg cm-2 s-1. | |
| eeObserved flux in the – keV band, in the Raymond-Smith component; units of erg cm-2 s-1. | |
| ffObserved flux in the – keV band; units of erg cm-2 s-1. | |
| ggObserved flux in the – keV band, in the Raymond-Smith component; units of erg cm-2 s-1. | |
| hhUnabsorbed luminosity for eV; units of erg s-1. | |
| iiUnabsorbed luminosity for eV, in the Raymond-Smith component; units of erg s-1. |
3. The supersoft ULX
X1 was detected as a luminous supersoft source during the ROSAT/PSPC observations of 1991 December 15 – 1992 January 04 (a total of 18.4 ks; see Fig. 4 and Table 1 in Vogler & Pietsch (1996)). It was not detected in the shorter (3.5 ks) ROSAT/PSPC observations of 1992 May, suggesting a count-rate decline by at least a factor of 3. It was detected again by ROSAT/HRI in 1992 December; however, since the HRI does not provide spectral information, we cannot tell whether it was again in a super-soft state. In the Chandra observation from 2000 April 16, the source was faint and soft. Finally, in the XMM-Newton observations of 2002 June 28, X1 appeared again as a luminous supersoft source (Carpano et al., 2007), in a similar state to the 1991 detection. Here, we briefly summarize the spectral results when the source was in a high state, and then compare them with the low-state observation.
3.1. High state
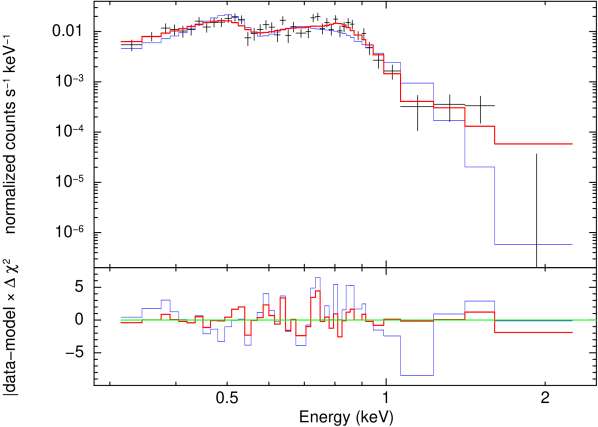
We re-extracted the XMM-Newton data and coadded the pn and MOS spectra with a suitably averaged response function. This is equivalent to fitting them simultaneosly, but provides a better signal-to-noise ratio for discrete features. We recover the result of Carpano et al. (2007), with a spectrum dominated by a soft blackbody component, plus residual features (both in emission and absorption) especially at – keV (Figure 2). Such features are already evident in each individual EPIC spectrum, as plotted in Figure 4 of Carpano et al. (2007), and become more significant when the spectra from all three detectors are combined. The visual impression of such systematic residuals is confirmed by the fit statistics: the best-fitting absorbed blackbody model has and can be safely rejected.
The residual emission and absorption features may not seem to affect the bolometric luminosity significantly, compared with the dominant blackbody emission. However, different models for such residual components have the effect of shifting the fitted temperature of the blackbody component between and eV, with a dramatic effect on the extrapolated, unabsorbed bolometric luminosity. Some examples are summarized in Table 2. When we model the deviations from a pure blackbody spectrum with only emission components (e.g., a Gaussian as in Carpano et al. (2007), or an optically-thin thermal plasma), we find an extrapolated luminosity – erg s-1. However, we also find that there is a statistically-significant absorption feature at keV. This may be analogous to the Fe-L absorption edges found in some Seyfert galaxies (Boller et al., 2003). Ignoring this edge leads to apparently lower blackbody temperatures and therefore higher extrapolated bolometric luminosities. When we include this edge in our models (Tables 2 and 3), we obtain bolometric luminosities as low as – erg s-1, depending on whether we assign the same, high intrinsic absorption to both the optically-thin and optically-thick thermal components, or only to the latter. On the other hand, the isotropic emitted luminosity erg s-1 in the – keV band provides a solid lower limit to the bolometric luminosity.
In our best-fitting model (Table 3), the optically-thin emission component contributes less than 1/10 of the extrapolated bolometric luminosity, but about 1/4 of the observed flux in the full – keV band, about half of the unabsorbed luminosity at energies keV, and 2/3 of the unabsorbed luminosity at energies keV. This explains why modelling such component has a great effect on the fit parameters and inferred luminosity. The unabsorbed luminosity of the optically-thin thermal plasma is erg s-1 (bolometric luminosity erg s-1).
The 1991 ROSAT/PSPC spectrum is also dominated by a blackbody component at keV (Read, Ponman & Strickland, 1997), and a WebPIMMS estimate suggests it may have similar luminosity to the 2002 XMM-Newton spectrum. However, the ROSAT data do not have enough counts and spectral resolution to constrain the temperature (and therefore the extrapolated emitted luminosity) more accurately. If we assume that the spectral model was the same as in the XMM-Newton observation (choosing for example the model listed in Table 3), and leave only the relative normalization free between the two epochs, we find that the two spectra are indeed consistent with being very similar (Figure 3), with a ROSAT flux normalization times higher than for XMM-Newton.
The best-fit blackbody temperature ( keV) and (extrapolated) blackbody luminosity ( erg s-1 in 2002, and erg s-1 in 1991) correspond to a characteristic radius cm or cm (in 2002 and 1991, respectively) for the optically-thick emitting surface. We should also keep in mind that a simple blackbody approximation tends to overestimate the true luminosity of supersoft sources by a factor of a few (Kahabka & van den Heuvel, 1997), so the true luminosity may be even lower.
3.2. Low state
From the Chandra data in the low state, we found net ACIS counts, corresponding to a count rate of ct s-1 (a factor of two less than estimated by Carpano et al. (2007)). The breakdown of the net counts in different energy bands is: counts at – keV, and counts at – keV. Dividing the interval into three bands, we get: counts at – keV, counts at – keV, counts at – keV.
So, although there are not enough counts for detailed spectral fitting, we have at least a strong indication that the source was very soft (or “quasi-soft” in the definition of Di Stefano & Kong (2004)). Even if we assume no intrinsic absorption, the count distribution rules out a power-law spectrum with photon index at the 90 per cent confidence level (using the Cash statistic, Cash (1979)). The optically-thin thermal plasma component fitted to the high-state spectrum is clearly inconsistent with the lower flux detected in the low state (Figure 4). More generally, optically-thin thermal plasma models (at fixed solar metallicity) are also ruled out at the 90 per cent confidence level (the best-fitting model has a Cash-statistic parameter ) Soft, optically-thick thermal emission (blackbody or disk-blackbody) is a much better model for the observed count distribution. We estimate a disk-blackbody temperature keV (90 per cent confidence limits; Cash-statistic fit parameter ) or a simple blackbody temperature keV (Cash-statistic fit parameter ). The best-fitting unabsorbed luminosity is erg s-1, although the 68 per cent confidence interval includes values as high as erg s-1; but in any case, the luminosity is lower than in the supersoft state, as intuitively expected from a simple scaling of the count rate between the Chandra and XMM-Newton observations. From the few detected counts, we cannot strongly rule out the alternative possibility that the lower count rate in the Chandra observation is also or mostly due to a much higher intrinsic absorption ( cm-2) of the same, luminous super-soft component. But in the absence of independent evidence for that dramatic change in absorption, and by analogy with the behaviour of other accreting systems (including the supersoft source in M101 mentioned earlier, Kong & Di Stefano (2005)), here we consider the low-state scenario as the most plausible.
The absence of the optically-thin thermal plasma component in low state is somewhat puzzling. The rapid change between 2000 and 2002 suggests that it was not due to diffuse hot gas at large distances from the source, but was instead directly associated with the high state or outburst. The PSF and source extraction region are of course much larger for XMM-Newton, which may suggest a contamination from Galactic-scale diffuse emission; however, we tested this possibility using the Chandra images, and we do not find evidence of local enhancements in the diffuse soft emission. Different choices of background extraction regions in XMM-Newton do not remove this component. In conclusion, we suggest that the most likely explanation at this stage is that the line emission and absorption edge are really associated with the compact source. If the emission is due to an expanding BH wind or white dwarf photosphere (scenarios outlined in Sections 4.2 and 4.3) we speculate that this may be evidence of an optically thick and optically thin component in the outflow.


4. Physical interpretation of X1
Three scenarios have been considered for this source (and for the handful of similar ones in other nearby galaxies), based on the properties of its high/supersoft state (Carpano et al., 2007): standard disk emission from an intermediate-mass BH; super-Eddington outflows from a stellar-mass BH; nuclear-burning white dwarf. We discuss here how the low-state appearance provides stronger constraints.
4.1. Intermediate-mass BH
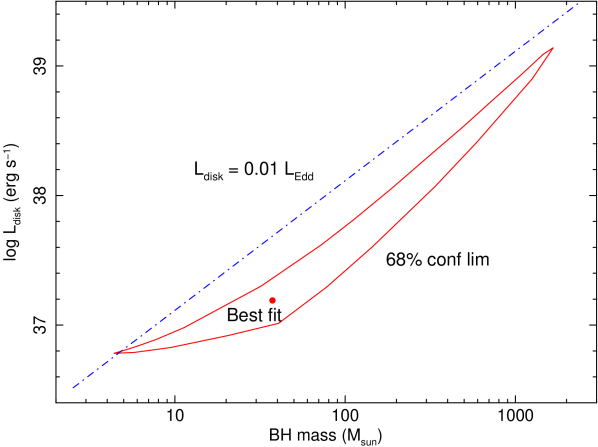
In the standard disk model, the BH mass can be expressed as a function of inner-disk temperature and bolometric disk luminosity (or diskbb normalization constant): (Makishima et al., 2000). Assuming and imposing cm-2 (Galactic line of sight), we used the Cash-statistics fit to the Chandra data, and we derived a contour plot of the acceptable region in the BH-mass versus disk-luminosity space (Figure 5). We do not have enough net counts to determine the 90% confidence contours, but we can at least identify a “most plausible” (68% confidence contours) region in that plane. The large uncertainty in the inner-disk temperature (from to keV) is reflected in a large range of masses and unabsorbed luminosities. Regardless of BH mass, the luminosity appears to be always . However, there are observational and theoretical arguments against a disk-dominated low/soft state at . At those luminosities, accreting BHs are generally found in a power-law-dominated low/hard state, which is ruled out in this case. Hence, we suggest that the low/soft appearance of the source in the Chandra observation does not favour the disk-blackbody model.
Moreover, the fitted inner-disk temperature in the low/soft state appears to be similar or slightly higher than the thermal temperature in the high/supersoft state (Carpano et al. (2007), and Table 2). If the thermal emission is due to an accretion disk, we expect the disk to be cooler, when the net count rate (a proxy for the accretion rate and emitted luminosity) is two or three orders of magnitude lower; in a standard disk. A transition between high/supersoft and low/soft states is inconsistent with the well-studied behaviour of BH accretion disks. In conclusion, the comparison of low- and high-state spectral data does not favour the intermediate-mass BH scenario.
4.2. Stellar-mass BH
The high/supersoft state is consistent with thermal emission scattered and collimated by a massive, optically-thick disk outflow, launched at the spherization radius around a stellar-mass BH, when the accretion rate exceeds the Eddington limit (Shakura & Sunyaev, 1973; Poutanen et al., 2007; King, 2008). We have already noted that in the Chandra observation, the emitted luminosity may be two or three orders of magnitude lower. Hence, we do not expect the super-Eddington outflow to be present in that lower state.
In the canonical scheme of BH accretion states, inferred mostly from the study of stellar-mass Galactic BH binaries, moderately active (sub-Eddington) BHs are either in the high/soft state (dominated by a disk-blackbody component with keV), or in the low/hard state (power-law component with –). Neither state is consistent with the observed Chandra spectrum. And conversely, no stellar-mass BHs have been observed in a disk-dominated state with keV and – erg s-1. If the supersoft component in the higher state is attributed to a disk outflow during super-critical accretion, we would have to conclude that the lower-state spectrum does not look like a canonical state for stellar-mass BHs.
An alternative possibility we should consider is that the sequence of high and low states is not due to accretion state transitions, but to a long-term precession of the binary system, such that the moderatley collimated outflow moves in and out of our line of sight. When we are looking down the outflow, we may be observing the undisturbed, cooler (soft spectrum) outer disk, at radii larger than the spherization radius. However, a difficulty of this interpretation is that the predicted isotropic luminosity of the outer standard disk down to the spherization radius should be erg s-1 for a stellar-mass BH. This is much higher than observed.
In conclusion, we suggest that the stellar-mass BH scenario, although still viable, has not yet provided a perfectly self-consistent interpretation for this source, or at least requires a new kind of accretion-state behaviour or accretion-disk structure, so far unobserved in stellar-mass BHs.
4.3. Nuclear-burning white dwarf
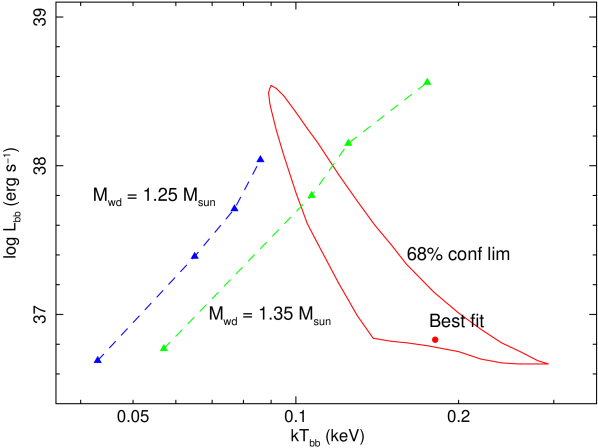
The observed temperature and luminosity of X1 in the low/soft state is consistent with the thermal emission from surface hydrogen burning on a massive white dwarf, – (Figure 6). Such process can occur at accretion rates just below the steady burning rate ( a few yr-1: Starrfield et al. (2004); Kahabka (2004). The white dwarf is sufficiently hot that hydrogen burns on its surface immediately as it is accreted; for this reason, the system does not go through classical-nova outbursts. A blackbody luminosity erg s-1 at a temperature keV are well within the 68% confidence limit of the Chandra detection. These values correspond to a radius km for a spherical emitter, consistent with the radius of a - white dwarf.
However, the high/supersoft phases cannot be explained with steady surface burning. It was found from numerical simulations (Starrfield et al., 2004) that steady surface hydrogen burning on a - white dwarf can occur only for accretion rates yr-1; above that limit, the photosphere of the white dwarf expands to large radii and shuts off accretion. This may be what is happening in X1, with a sequence of outbursts in between phases of more steady surface burning (at reduced accretion rate) or simply of surface cooling. The estimated radii (a factor of 10 higher than in the low/soft state, Section 3.1) and blackbody temperatures (a factor of two lower) fitted to the high/supersoft spectrum are consistent with photospheric expansion.
From the sequence of X-ray observations between 1991 and 2002, we speculate that X1 is in a transient supersoft state about half of the time. Since the emitted luminosity in the high/supersoft state is a few erg s-1, and that in the low/soft state is a few erg s-1, the long-term average luminosity may be . This clearly raises two problems, related to the average long-term accretion rate and to the peak luminosity. Since all the power must ultimately come from nuclear burning, the long-term average luminosity requires an average accretion rate – yr-1. From stellar evolution models (Rappaport, Podsiadlowski & Pfahl, 2005), it appears that even late-type B stars (likely progenitor of the putative massive white dwarf and likely donor star in the system) can provide such extreme rates during thermal-timescale episodes of mass transfer, lasting yr. If the same accretion rate was used to power an accreting BH, it would produce a bolometric luminosity – erg s-1, which is similar to the maximum luminosity inferred for ULXs; the X-ray luminosity distribution of ULXs has a downturn at erg s-1 (Grimm, Gilfanov & Sunyaev, 2003; Swartz et al., 2004). In other words, explaining the most luminous supersoft sources ever found as nuclear-burning sources with average long-term luminosity erg s-1 requires mass-transfer conditions similar to those needed to explain the most luminous ULXs as accreting BHs with luminosities a few erg s-1. We speculate that this may be more than a coincidence. Moreover, the alternative ULX scenario of a super-Eddington outflow from a stellar-mass BH (Section 4.2; Carpano et al. (2007); King (2008)) also requires mass transfer rates of up to yr-1 on the thermal timescale, possibly from a B-type donor star. Therefore, the required limits on the long-term average mass transfer rate are similar for both models.
As for the peak luminosity a few erg s-1, this is highly super-Eddington for a white dwarf, and a factor of 10 above the luminosity produced by steady surface burning. However, steady burning cannot persist at accretion rates yr-1. We speculate that the high/supersoft phases may be transient super-Eddington events (fireball scenario), after which the photosphere shrinks again to the white-dwarf surface, and accretion resumes. It was estimated (Starrfield et al., 2004) that the hydrogen layer involved in surface nuclear burning has a mass . Therefore, even if further hydrogen accretion is shut off (i.e., during the transient super-Eddington outburst), simply the complete burning of this layer can provide a luminosity erg s-1 for several weeks, or erg s-1 for several days, and the layer itself can be replenished in month, before another outburst. A similar process may be driving the outburst cycles of the supersoft ULX in M101 (Kong & Di Stefano, 2005), which shows varying temperatures between and eV corresponding perhaps to phases of photospheric expansion and contraction. Super-Eddington outbursts powered by non-steady episodes of nuclear burning have been observed in some Novae, most notably LMC 91, which peaked at erg s-1 (Schwarz et al., 2001).
In conclusion, we suggest that a fireball white-dwarf model is still a viable scenario for this extreme source (and perhaps also for the whole class of supersoft ULXs), considering that its true bolometric luminosity is likely to be an order of magnitude less than originally estimated (Carpano et al., 2007), and that the required accretion rate yr-1 is similar to the rate invoked for super-Eddington outflows in the most luminous ULXs.
4.4. Time variability
From a timing study of the XMM-Newton observation, it was found (Carpano et al., 2007) that the X-ray emission has a modulation with an apparent period of hr. It is not clear what can produce this period or timescale. If it was the binary period, from the period-density relation (Warner, 1995) we infer an average density g cm-3 inside the Roche lobe of the donor star (the mean solar density is g cm-3). This is consistent with a main-sequence star with a mass . Other well-known supersoft sources such as CAL 87 are known to have a low-mass donor with a binary period of a few hours (Callanan et al., 1989). However, for NGC 4631 X1, such a low-mass donor is inconsistent with the required mass transfer rates in both the stellar-mass BH and white dwarf scenarios, and is also at odds with the young age of the stellar population in this starburst galaxy (i.e., the galaxy is more likely to contain bright high-mass X-ray binaries). A B-type donor star is consistent with a massive white-dwarf compact object, both from theoretical arguments (Iben & Tutukov, 1994) and observationally (Berghöfer et al., 2000); the lifetime of the B-type progenitor of a white dwarf is Myr.
If the -hr X-ray modulation is not the binary period, then it could be due either to a disk precession in the BH scenario, or to the rotational period of the white dwarf, or to pulsations in the donor star which affect the rate of mass transfer. A study of these scenarios is beyond the scope of this work. We just point out that hrs is the characteristic pulsation period of the B-type -Cephei stars (Stankov & Handler, 2005). Pulsations of a -Cep donor have been invoked in the past as a possible cause of X-ray periodicities in some accreting binaries (Berghöfer et al., 2000; Finley et al., 1992).
| Parameter | Chandra Value | XMM-Newton Value |
|---|---|---|
| aaFrom Kalberla et al. (2005). Units of cm-2. | ||
| (keV) | ||
| bb where is the apparent inner-disk radius and the viewing angle; is face-on. | ||
| /dof | ||
| ccObserved flux in the – keV band; units of erg cm-2 s-1. | ||
| ddUnabsorbed luminosity in the – keV band; units of erg s-1. |
5. Other luminous X-ray sources
5.1. X2
Apparently coincident with a young star cluster, this highly-absorbed ULX ( cm-2), was not detected in any ROSAT observation (not surprisingly). This source can be classified as a “convex-spectrum” ULX (using the terminology of Makishima (2007)). The spectral curvature can be formally modelled with a standard disk-blackbody spectrum (Figure 7 and Table 4), with a color temperature – keV (in the XMM-Newton and Chandra data, respectively). However, as is generally the case in this class of ULXs, such temperatures are too high for the estimated luminosities ( and erg s-1, respectively). One possibility is that the emission comes from a slim disk (Watarai, Mizuno & Mineshige, 2001) rather than a standard disk; if so, the mass accretion rate may be an order of magnitude above the Eddington rate, while the luminosity may be , and the BH mass – (for comparison with other sources in a similar state, see Fig. 3 in Makishima (2007)). Alternatively, the convex spectrum may be modelled equally well with a Comptonized component, arising from a warm (– keV) corona (see a comparison between the two scenarios in Stobbart et al. (2006)). Other purely phenomenological models such as a broken power-law (breaking at keV) also provide good fits.


5.2. X3
This X-ray source is also well modelled with a disk-blackbody spectrum (Figure 8 and Table 5), with – keV (in the XMM-Newton and Chandra data, respectively), similar to the parameters found for X2. However, its emitted luminosity in the – keV band is only erg s-1, constant between Chandra and XMM-Newton and below the ROSAT detection limit. Therefore, X3 is consistent with a stellar-mass BH near the upper-luminosity end of its high/soft state. Assuming a spectral hardening factor – (Shimura & Takahara, 1995; Gierliński & Done, 2004; Shafee et al., 2006), the standard-disk temperature-luminosity relation (Makishima et al., 2000) suggests a BH mass –; the fitted (apparent) inner-disk radius km, as expected.
5.3. X4
This ULX shows a state transition between the Chandra and XMM-Newton observations. In Chandra, we detect a faint, soft source (– keV count rate counts s-1), well fitted () by an optically-thin thermal-plasma model (Table 6) with a temperature keV. Every other spectral model (power-law, disk-blackbody, or any Comptonization models) yields . The emitted luminosity for the Raymond-Smith thermal-plasma model is erg s-1. In the XMM-Newton observations, there is a stronger, harder source at the same position, with a broad spectrum well fitted by a power-law plus disk-blackbody model (Figure 9 and Table 6). The power-law index is ; there is no evidence of a steepening break or spectral curvature near or above keV, unlike what we noted for X2. The disk-blackbody component has a color temperature keV. The unabsorbed luminosity in the – keV band is erg s-1, per cent of which in the disk-blackbody component. It is possible that the thermal-plasma component seen in the Chandra dataset is also present in the XMM-Newton spectrum, although we cannot place strong constraints on it (Table 6).
In summary, X4 is a transient “power-law” ULX (using again the spectral classification of Makishima (2007)) with a thermal soft-excess at low energies. A physical interpretation for this class of ULXs is that the standard optically-thick accretion disk is directly visible at large radii but is replaced or covered by a scattering-dominated region (producing a broader, power-law-like spectrum) at small radii (see, e.g., the review by Soria & Kuncic (2008) and references therein). The apparent inner-disk radius (which we may identify with the transition radius between standard disk and Comptonizing regions) km. From the relative contribution of thermal and (less radiatively efficient) power-law components, we speculate that this transition radius is a few times the innermost stable orbit; hence, the BH mass is likely to be .
Evidence of variability on monthly timescales for X4 was already found in the series of ROSAT observations (Vogler & Pietsch, 1996). We searched for short-term variability in the XMM-Newton observation (Figure 10), and found that a constant count rate is statistically ruled out (). However, we found no dominant frequency or other spectral features in its power-density spectrum.
| Parameter | Chandra Value | XMM-Newton Value |
|---|---|---|
| aaFrom Kalberla et al. (2005). Units of cm-2. | ||
| (keV) | ||
| bb where is the apparent inner-disk radius and the viewing angle; is face-on. | ||
| /dof | ||
| ccObserved flux in the – keV band; units of erg cm-2 s-1. | ||
| ddUnabsorbed luminosity in the – keV band; units of erg s-1. |
| Parameter | Chandra Value | XMM-Newton Value |
|---|---|---|
| aaFrom Kalberla et al. (2005). Units of cm-2. | ||
| - | ||
| (keV) | ||
| bbRaymond-Smith model normalization , where is the angular size distance to the source (cm), is the electron density (cm-3), and is the hydrogen density (cm-3). | ||
| ccPhoton index. | - | |
| ddUnits of photons keV-1 cm-2 s-1, at 1 keV. | - | |
| (keV) | - | |
| ee where is the apparent inner-disk radius and the viewing angle; is face-on. | - | |
| /dof | ||
| ffObserved flux in the – keV band; units of erg cm-2 s-1. | ||
| ggUnabsorbed luminosity in the – keV band; units of erg s-1. |
| Parameter | Chandra Value | XMM-Newton Value |
|---|---|---|
| aaFrom Kalberla et al. (2005). Units of cm-2. | ||
| bbPhoton index. | ||
| ccUnits of photons keV-1 cm-2 s-1, at 1 keV. | ||
| /dof | ||
| ddObserved flux in the – keV band; units of erg cm-2 s-1. | ||
| eeUnabsorbed luminosity in the – keV band; units of erg s-1. |
5.4. X5
This ULX was in a luminous state in five of the six ROSAT observations (Vogler & Pietsch, 1996). We found it again in a bright state during the Chandra and XMM-Newton observations (Figure 11 and Table 7). In both datasets, the X-ray spectra are well fitted by a simple power-law of photon index . There is no statistically-significant evidence of either a soft thermal component or a high-energy break or downward curvature in the power-law. The unabsorbed isotropic luminosity in the – keV band is ergs s-1 (Chandra) and ergs s-1 XMM-Newton, only slightly higher than the range of estimated luminosities during the ROSAT observations (Liu & Bregman, 2005), when the same Chandra or XMM-Newton model is applied to the ROSAT data111The ROSAT/HRI luminosity estimated by Liu & Bregman (2005) is a factor of 2 lower than our estimate because they assumed only line-of-sight absorption.. We did not find any variability within the individual Chandra and XMM-Newton exposures. In summary, X5 appears to be a typical power-law ULX, perhaps powered by accretion onto a BH with a mass .


6. Conclusions
We have studied the nature of the five brightest sources in NGC 4631, using XMM-Newton and Chandra data. Four of them can be classified as ULXs. The most peculiar ULX, which we label X1, was previously studied by Carpano et al. (2007) and identified as a variable supersoft source with an apparent bolometric luminosity erg s-1. We re-examined the spectral data and found that in fact, its most likely luminosity may be only erg s-1; in fact, it could be even lower, if we consider that a blackbody approximation tends to overestimate the luminosity of supersoft sources. This reduces the need for an intermediate-mass BH or other exotic scenarios.
We found that when the source is in a low state (Chandra observation), it appears soft (but not supersoft), consistent with a thermal spectrum at a temperature – keV, and a luminosity erg s-1. We argued that this is inconsistent with an intermediate-mass BH. It is also unsual for a stellar-mass BH, which at those luminosities is expected to be in a power-law dominated low/hard state, or in a disk-dominated high/soft state with – keV, based on our current knowledge of canonical accretion states. As an alternative, we suggest that transient super-Eddington outbursts (fireball or photospheric expansion) powered by non-steady nuclear burning on the surface of a massive white dwarf could be a viable scenario, as an extreme subclass of supersoft sources. Outbursts due to photospheric expansion are expected when the accretion rate exceeds yr-1. Based on the sequence of available observations from 1991–2002, the long-term average luminosity of the system is – erg s-1, which requires average accretion rates – yr-1. Although very high, such rates are achievable during phases of thermal-timescale mass transfer in B stars, and are similar to the rates required to explain the most luminous ULXs powered by BH accretion. Hence, we speculate that transient outbursts in nuclear-burning, massive white dwarfs may also explain the few other supersoft ULXs (all highly variable) found in nearby galaxies. Some of those sources would be seen as quasi-soft sources (in the definition of Di Stefano & Kong 2004) when they are in a low state.
The origin of the -hr X-ray variability remains unexplained, whatever the nature of the compact object. Given the high mass transfer rate, we would expect a B-type donor star filling its Roche lobe; however, a -hr period does not allow for massive donors. Alternatively, the variability may be due to an accretion disk precession, or the rotation of the white dwarf, or -Cephei pulsations in the donor star.
The other four brightest sources in NGC 4631 are almost certainly bone fide BHs, in different accretion states. X2 ( erg s-1 in the XMM-Newton observation) is a highly absorbed “convex-spectrum” ULX; its X-ray spectrum may be interpreted as emission from a slim disk, or from a low-temperature (a few keV) Comptonizing region. X3 ( erg s-1) is a stellar-mass BH in its classical disk-dominated high/soft state. X4 ( erg s-1) is a transient power-law ULX with a soft-excess at keV; for this class of objects, we may be seeing a standard disk outside a transition radius, completely replaced or covered by a Comptonizing region at smaller radii. X5 ( erg s-1) is a pure power-law ULX, with no evidence for low-energy soft excess or high-energy steepening. All of them are consistent with accreting stellar-mass BHs, with masses . However, the relation between the different phenomenological states (high/soft, convex-spectrum, power-law, power-law with soft excess), and in particular whether those states are uniquely a function of the normalized accretion rate, remains a topic for further theoretical and observational investigations.
References
- Arnaud (1996) Arnaud, K. A. 1996, Astronomical Data Analysis Software and Systems V, ASP Conference Series Vol. 101, G. H. Jacoby and J. Barnes eds, 17
- Begelman (2002) Begelman, M. C. 2002, ApJ, 568, L97
- Begelman (2006) Begelman, M. C. 2006, ApJ, 643, 1065
- Berghöfer et al. (2000) Berghöfer, T. W., Vennes, S., & Dupuis, J. 2000, ApJ, 538, 854
- Boller et al. (2003) Boller, Th., Tanaka, Y., Fabian, A., Brandt, W. N., Gallo, L., Anabuki, N., Haba, Y., & Vaughan S. 2003, MNRAS, 343, L89
- Callanan et al. (1989) Callanan, P. J., Machin, G., Naylor, T., & Charles, P. A. 1989, MNRAS, 241, 37
- Carpano et al. (2007) Carpano, S., Pollock, A. M. T., King, A. R., Wilms, J., & Ehle, M. 2007, A&A, 471, L55
- Carpano et al. (2006) Carpano, S., Wilms, J., Schirmer, M., & Kendziorra, E. 2006, A&A, 458, 747
- Cash (1979) Cash, W. 1979, ApJ, 228, 939
- Di Stefano & Kong (2004) Di Stefano, R., & Kong, A. K. H. 2004, ApJ, 609, 710
- Fabbiano et al. (2003) Fabbiano, G., King, A. R., Zezas, A., Ponman, T. J., Rots, A., & Schweizer, F. 2003, ApJ, 591, 843
- Fabbiano, Kim & Trinchieri (1992) Fabbiano, G., Kim, D.-W., & Trinchieri, G. 1992, ApJS, 80, 531
- Feng & Kaaret (2005) Feng, H., & Kaaret, P. 2005, ApJ, 633, 1052
- Finley et al. (1992) Finley, J. P., Belloni, T., & Cassinelli, J. P. 1992, A&A, 262, L25
- Gierliński & Done (2004) Gierliński, M., & Done, C. 2004, MNRAS, 347, 885
- Grimm, Gilfanov & Sunyaev (2003) Grimm, H.-J., Gilfanov, M., & Sunyaev, R. 2003, MNRAS, 339, 793
- Iben & Tutukov (1994) Iben, I. J., & Tutukov, A. V. 1994, ApJ, 431, 264
- Kalberla et al. (2005) Kalberla, P. M. W., Burton, W. B., Hartmann, D., Arnal, E. M., Bajaja, E., Morras, R., & Poppel, W. G. L. 2005, A&A, 440, 775
- Kahabka (2004) Kahabka, P. 2004, A&A, 416, 57
- Kahabka & van den Heuvel (1997) Kahabka, P., & van den Heuvel, E. P. J. 1997, ARA&A, 35, 69
- Kennicutt (1998) Kennicutt, R. C. 1998, ARA&A, 36, 189
- King (2008) King, A. R. 2008, MNRAS, 385, L113
- King et al. (2001) King, A. R., Davies, M. B., Ward, M. J., Fabbiano, G., & Elvis, M. 2001, ApJ, 552, L109
- Kong & Di Stefano (2003) Kong, A. K. H., & Di Stefano, R. 2003, ApJ, 590, L13
- Kong & Di Stefano (2005) Kong, A. K. H., & Di Stefano, R. 2005, ApJ, 632, 107L
- Liu & Bregman (2005) Liu, J.-F., & Bregman, J. N. 2005, ApJSS, 157, 59
- Makishima (2007) Makishima, K. 2007, IAU Symposium, 238, 209
- Makishima et al. (2000) Makishima, K., et al. 2000, ApJ, 535, 632
- Miller & Colbert (2004) Miller, M. C., & Colbert, E. J. M. 2004, IJMPD, 13, 1
- Ohsuga & Mineshige (2007) Ohsuga, K., & Mineshige, S. 2007, ApJ, 670, 1283
- Page et al. (2003) Page, M. J., Davis, S. W., & Salvi, N. J. 2003, MNRAS, 343, 1241
- Pakull & Mirioni (2002) Pakull, M. W., & Mirioni, L. 2002, in the unpublished proceedings of the symposium “New visions of the X-ray Universe in the XMM-Newton and Chandra era”, ESTEC, The Netherlands (November 2001), astro-ph/0202488
- Poutanen et al. (2007) Poutanen, J., Lipunova, G., Fabrika, S., Butkevich, A. G., & Abolmasov, P. 2007, MNRAS, 377, 1187
- Rappaport, Podsiadlowski & Pfahl (2005) Rappaport, S. A., Podsiadlowski, Ph., & Pfahl, E. 2005, MNRAS, 356, 401
- Read, Ponman & Strickland (1997) Read, A. M., Ponman, T. J., & Strickland, D. K. 1997, MNRAS, 286, 626
- Schwarz et al. (2001) Schwarz, G. J., Shore, S. N., Starrfield, S., Hauschildt, P. H., Della Valle, M., & Baron, E. 2001, MNRAS, 320, 103
- Seth, Dalcanton & de Jong (2005) Seth, A. C., Dalcanton, J. J., & de Jong, R. S. 2005, AJ, 129, 1331
- Shafee et al. (2006) Shafee, R., McClintock, J. E., Narayan, R., Davis, S. W., Li, L.-X., & Remillard, R. A. 2006, ApJ, 636, L113
- Shakura & Sunyaev (1973) Shakura, N. I., & Sunyaev, R. A. 1973, A&A, 24, 337
- Shimura & Takahara (1995) Shimura, T., & Takahara, F. 1995, ApJ, 445, 780
- Soifer et al. (1989) Soifer, B. T., Boehmer, L., Neugebauer, G., & Sanders, D. B. 1989, AJ, 98, 766
- Soria & Kuncic (2008) Soria, R., & Kuncic, Z. 2008, to appear in the proceedings of the conference “Observational evidence of black holes”, Kolkata, India (February 2008), arxiv:0807.0016
- Stankov & Handler (2005) Stankov, A., & Handler, G. 2005, ApJS, 158, 193
- Starrfield et al. (2004) Starrfield, S., Timmes, F. X., Hix, W. R., Sion, E. M., Sparks, W. M., & Dwyer, S. J., 2004, ApJ, 612, L53
- Stobbart et al. (2006) Stobbart, A.-M., Roberts, T. P., & Wilms, J. 2006, MNRAS, 368, 397
- Strickland et al. (2004a) Strickland, D. K., Heckman, T. M., Colbert, E. J. M., Hoopes, C. G., & Weaver, K. A. 2004b, ApJS, 151, 193
- Strickland et al. (2004b) Strickland, D. K., Heckman, T. M., Colbert, E. J. M., Hoopes, C. G., & Weaver, K. A. 2004b, ApJ, 606, 829
- Swartz et al. (2002) Swartz, D. A., Ghosh, K. K., Suleimanov, V., Tennant, A. F., & Wu, K. 2002, ApJ, 574, 382
- Swartz et al. (2004) Swartz, D. A., Ghosh, K. K., Tennant, A. F., & Wu, K. 2004, ApJS, 154, 519
- Tennant (2006) Tennant, A. F. 2006, AJ, 132, 1372
- Tüllmann et al. (2006a) Tüllmann, R., Pietsch, W., Rossa, J., Breitschwerdt, D., & Dettmar, R. J. 2006, A&A, 448, 43
- Tüllmann et al. (2006b) Tüllmann, R., Breitschwerdt, D., Rossa, J., Pietsch, W., & Dettmar, R. J. 2006, A&A, 457, 779
- Vogler & Pietsch (1996) Vogler, A., & Pietsch, W. 1996, A&A, 311, 35
- Wang et al. (2001) Wang, Q. D., Immler, S., Walterbos, R., Lauroesch, J. T., & Breitschwerdt, D. 2001, ApJ, 555, L39
- Warner (1995) Warner, B. 1995, Ap&SS, 232, 89
- Watarai, Mizuno & Mineshige (2001) Watarai, K.-Y., Mizuno, T., & Mineshige, S. 2001, ApJ, 549, L77
- Winter, Mushotzky & Reynolds (2006) Winter, L. M., Mushotzky, R. F., & Reynolds, C. S. 2006, 649, 730
- Winter, Mushotzky & Reynolds (2007) Winter, L. M., Mushotzky, R. F., & Reynolds, C. S. 2007, ApJ, 655, 163