The Jet of 3C 17 and the Use of Jet Curvature as a Diagnostic of the X-ray Emission Process
Abstract
We report on the X-ray emission from the radio jet of 3C 17 from Chandra observations and compare the X-ray emission with radio maps from the VLA archive and with the optical-IR archival images from the Hubble Space Telescope. X-ray detections of two knots in the 3C 17 jet are found and both of these features have optical counterparts. We derive the spectral energy distribution for the knots in the jet and give source parameters required for the various X-ray emission models, finding that both IC/CMB and synchrotron are viable to explain the high energy emission. A curious optical feature (with no radio or X-ray counterparts) possibly associated with the 3C 17 jet is described. We also discuss the use of curved jets for the problem of identifying inverse Compton X-ray emission via scattering on CMB photons.
Subject headings:
Galaxies: active — galaxies: jets — galaxies: individual (3C 17) — X-rays: general — radio continuum: galaxies — radiation mechanisms: nonthermal1. Introduction
The X-ray radiation observed from radio jets is generally interpreted to be from non-thermal processes, even if its nature is still unclear for any particular jet. It could be described in terms of synchrotron emission or in terms of several varieties of inverse Compton radiation. So to understand the emission mechanisms related to these components the multiwavelength approach is required. If the X-ray emission is synchrotron, electrons with Lorentz factors up to 107 are required whereas if the process is inverse Compton radiation with seed photons due to the CMB (Tavecchio et al., 2000), the X-rays would come from electrons with (Harris & Krawczynski 2002). To investigate the nature of the emission in jets we analyze the jet of the powerful radio galaxy 3C 17.
3C 17 was observed during the first year of the Chandra 3C snapshot program, which started in AO-9 with 8ks observations of 30 of the previously unobserved (by Chandra) 3C sources with z0.3. The 3C sample allows us to have multifrequency data available from the HST and the VLA archives. 3C 17 is a radio galaxy (0.22, Schmidt et al. 1965) with a peculiar radio structure investigated by Morganti et al. (1999). Its H emission has a strong broad component and both the [O II] 3727 and [O III] 5007 emission lines are extended (Dickson 1997). This source shows also a significant optical polarization in its nucleus (Tadhunter et al. 1998), and its first detection in X-rays has been reported by Siebert et al. (1996) using the ROSAT All Sky survey data.
Here, we report the major results concerning the multiwavelength studies of the jet in 3C 17. We present the X-ray data of this source together with the optical-IR images (HST) and the radio maps (VLA archive).
For our numerical results, we use cgs units unless stated otherwise and we assume a flat cosmology with km s-1 Mpc-1, and (Spergel et al., 2007), so 1′′ is equivalent to 3.47 kpc. Spectral indices, , are defined by flux density, S.
2. Observations and Data reduction
2.1. X-rays data
3C 17 has been observed by Chandra (Obs ID 9292) on February 2, 2008, with the ACIS-S camera, operating in VFAINT mode, with an exposure of about 8 ksecs. The data reduction has been performed following the standard procedures described in the Chandra Interactive Analysis of Observations (CIAO) threads and using the CIAO software package v3.4. The Chandra Calibration Database (CALDB) version 3.4.2 was used to process all files. Level 2 event files were generated using the task, after removing the hot pixels with . Events were filtered for grades 0,2,3,4,6 and we removed pixel randomization. Astrometric registration was done changing the appropiate keywords in the fits header so as to align the nuclear X-ray position with that of the radio. We also registered the HST images in the same way.
We created 3 different fluxmaps (soft, medium, hard, in the ranges 0.5 – 1, 1 – 2, 2 – 7 keV, respectively) by dividing the data with the exposure maps. When constructing the fluxmaps, we normalized each count by multiplying by h where corresponds to the energy used for the corresponding exposure map. Thus we can measure the flux in any aperture in cgs units with only a small correction for the ratio of the mean energy of the counts within the aperture to the nominal energy for the band.
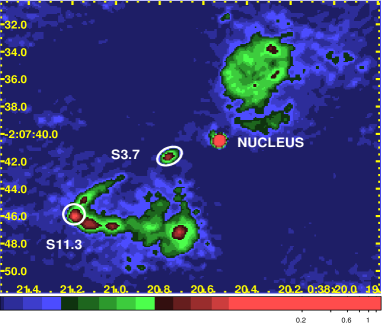
Photometric apertures were constructed so as to accomodate the Chandra point spread function and so as to include the total extent of the radio structure. They are shown in fig. 1. The background regions have been chosen close to the source with comparable size, typically two times bigger than the source region, centered on a position where other sources or extended structure are not present. All X-ray flux densities have been corrected for the Galactic absorption with the NH column densities given by Kalberla et al. (2005), 2.861020cm-2.
2.2. Radio maps and HST images
We compare our X-rays maps of 3C 17 with the VLA radio data described in Morganti et al. (1999) at 4.8 GHz with a beamsize of 0.4′′. We also reduced archival VLA data at 1.54 GHz and 14.9 GHz with AIPS standard reduction procedures. The angular resolution of these radio maps is 1.4′′ and the final image is in good agreement with the 4.8 GHz radio map. The amplitude calibrator used at 1.4 GHz was 3C 48 and the phase calibrator was 0056-001. At 15GHz we used 0106+103 for both amplitude and phase.
Concerning the other bands, we compared our X-ray image to the IR HST observation at 1.6 m (1.871014 Hz, H band)111available on the HST Snapshots of 3CR Radio Galaxies webpage, http://archive.stsci.edu/prepds/3cr/, and to the STIS visible image at 4.161014 Hz (7216 Å, R band). We also used a FUV HST image at 1457Å.
3. Results
3C 17 is a broad lined radio galaxy (BLRG) (Buttiglione et al. 2008) with a monochromatic radio luminosity, log P 26.9 which is at least two orders of magnitude above the division between FRI and FRII types (Ledlow & Owen, 1996) but with an ambiguous radio morphology. Miller & Brandt (2008) provide a more extensive discussion on classifying sources of this ’hybrid’ type, including 4C65.15, which is very similar to 3C 17 in many respects.
The nucleus of the host galaxy has been observed with the Very Long Baseline Array by Venturi et al. (2000) who describe 3C 17 as a “transition object” between FRI and FRII. The pc scale jet shows a ’core’ with an extension in PA to 110∘, followed by lower brightness features. This position angle is essentially the same as that of the first kpc scale knot, S3.7, discussed below.
The kpc scale radio morphology is dominated by a single sided, strongly curved jet (fig. 1, as described by Morganti et al. 1993, 1999), although there is lower brightness emission outside the area covered in the figure. Similarly to M87, 3C 17 was originally classified as a ’core-halo’ source. The jet has a bright knot at 3.7′′ from the nucleus while the curved part lies at about 11′′ from the nucleus.
3.1. Jet knots
| Soft | Medium | Hard | Total | |
| Nominal Energy (keV) | 0.70 | 1.4 | 4.0 | |
| Band (keV) | 0.5-1.0 | 1-2 | 2-7 | 0.2-7 |
| S3.7 counts | 5 | 6 | 1 | 12 |
| S11.3 counts | 1 | 0 | 4 | 5 |
| S3.7 flux | 2.61.1 | 2.20.9 | 1.61.6 | 6.4 |
| S11.3 flux | 0.60.5 | 0 | 6.53.3 | 7.1 |
Flux units: 10-15 erg cm-2 s-1.
Notes to table:
The average backgrounds measured for the total 0.5-7 keV band from annular rings around the radio galaxy are 1.57 counts (S3.7) and 0.08 counts (S11.3).
| Freq. (Hz) | Band | S3.7 | S11.3 |
|---|---|---|---|
| 1.66109 | L | 8010 | (19010) |
| 4.86109 | C | 301 | 83 |
| 1.491010 | U | 12.41 | (3310) |
| 1.871014 | 1.6 m | 3.28 | … |
| 4.161014 | 7216 | 1.44 | 1.03 |
| 2.061015 | 1457 | 0.15 | 0.054 |
| 1.181017 | soft X | 1.86 | 0.56 |
| 3.391017 | medium X | 1.04 | |
| 9.671017 | hard X | 0.14 | 0.56 |
Notes to table
Values in parentheses are uncertain because a 1.4′′ beamsize is inadequate to isolate S11.3 from adjacent knots.
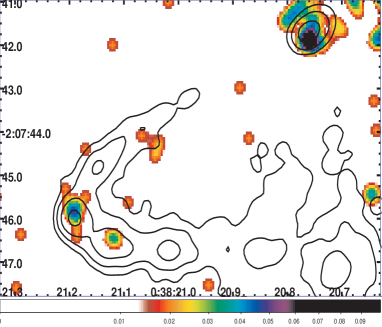
Using our new Chandra observation we find detections of two knots (fig. 2). The first knot, S3.7, lies at a projected distance of 12.8 kpc from the nucleus and is resolved with the VLA. The deconvolved size (FWHM) is 0.46 (1.60.6 kpc) in PA=115∘. Following a gap with no detectable radio emission, the jet again becomes visible in the radio about 7′′ from the nucleus and brightens as it approaches the region of maximum apparent curvature. It is at this point we detect X-rays from the radio knot, S11.3, which has the highest radio surface brightness (after the nuclear emission). Its deconvolved radio size is 0.4 (1.41.0 kpc) in PA=48∘.
X-ray fluxes for both knots are given in Table 1 and flux densities, evaluated for a spectral index equal to 1, are listed in Table 2. The total number of counts detected for S3.7 and for S11.3 is 12 and 5 respectively, where the average background evaluated around each knot is 1.57 cts for S3.7 and 0.08 cts for S11.3 for the same size aperture.
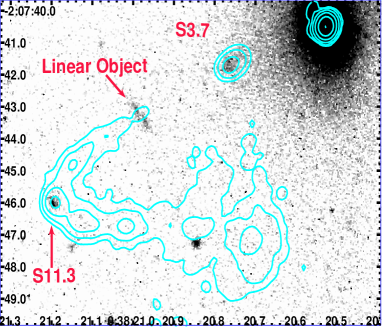
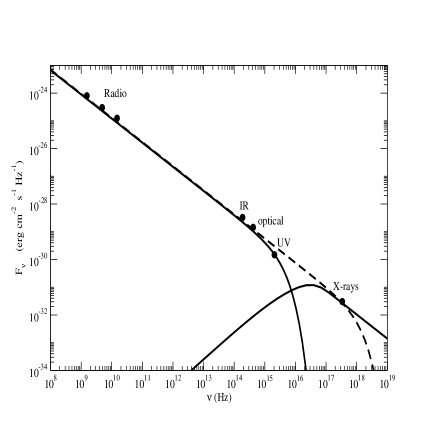
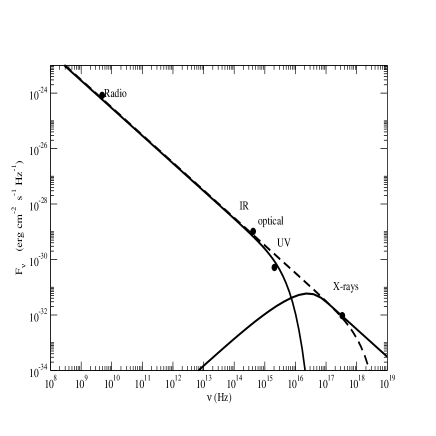
We compared also the radio and the X-ray emission with the optical and IR images reported by Donzelli et al. (2007). The knot S3.7 shows a counterpart both in the optical and in the IR image. For the other knot, S11.3, we report only the optical association because the FOV of the NICMOS camera is too small. The IR to UV flux densities are corrected for the reddening using the following values of absorption: =0.01, =0.062 and =0.044, for the IR, the R band and the UV respectively (Cardelli et al. 1989)222see also “Doug’s Excellent Absorption Law Calculator”, http://wwwmacho.mcmaster.ca/JAVA/Acurve.html. The SED of each knot is shown in figs. 4 & 5.
We tried several models to fit the emitted spectrum of both knots in 3C 17. We describe the spectrum from the radio band to the UV in terms of synchrotron emission but consider both synchrotron and IC/CMB for the X-rays. We performed our calculations assuming the following hypothesis: (1) the distribution of emitting electrons is a power-law with slope ; (2) the volumes of the emitting regions correspond to the deconvolved radio sizes; (3) the magnetic field is in equipartition with the energy density of the relativistic electrons; and (4) the proton-to-electron ratio is assumed to be zero.
Based on these assumptions, the spectrum is described in terms of 4 parameters, namely: the slope of the electron distribution , the maximum and the minimum energy of emitting particles and the magnetic field, because we fixed the volume derived from the radio maps.
The spectral index of the electron distribution has been derived from the observed spectrum fitting the radio to optical data with a power-law (see Tab.3). The maximum energy of particles has been evaluated in order to see the synchrotron exponential cut-off in the UV, as suggested by the data. Finally, given the value of the magnetic field and assuming a minimum observed frequency of 107Hz, we derived the parameter for both electron distribution (see Tab. 3). Following this criteria we found that the is the order of 100 for both knots, it correspond to an electron minimum energy of about 50 MeV, that can be predicted by several acceleration processes (e.g. Protheroe 2004). Finally, the values of the magnetic field, reported in Tab.3, are related to the synchrotron interpretation, but are only slightly different for the smaller .
Solutions shown in figs. 4 & 5 have the beaming factor fixed to 1. We find a good agreement of our solution with the observed spectrum for a magnetic field of 180 G for S3.7 and 195 G for S11.3. Parameters for our model are reported in Table 3.
For an inverse Compton (IC) model using photons of the microwave background (CMB) we follow the formalism of Harris & Krawczynski (2002). For S3.7, we find that the required beaming factor is =8 for the fiducial condition ( is the bulk Lorentz factor of the jet knot). The angle to the line of sight for this solution is =7∘ although smaller angles together with smaller are also acceptable. For S11.3, the values for the fiducial condition are =5.5 and =10∘. Since the jet is obviously curved, there is no expectation that the two values of should be equal even if one might guess that S11.3 would be moving more towards us than S3.7. These estimates are very rough because of the poor signal to noise in the X-ray data and because we do not have a measure of the radio spectral index.
It should be noted that the IC/CMB interpretation rests solely on the UV flux densities which are approximately 5 sigma for S3.7 and less than 3 sigma for S11.3 below the single power-law extending to the X-ray data. Because of the low statistical significance of these data and because of the added uncertainty of the extinction correction, we do not rule out a synchrotron spectrum extending out to the X-rays as shown by the dotted lines in figures 4 & 5. However the low UV flux values favor the IC/CMB interpretation instead of the single synchrotron component. A more accurate observation in the UV band (down to 1200) is needed to distinguish between models, e.g. if the spectrum is curved in the IR-to-UV range then the single synchrotron component could be ruled out.
| Parameter (cgs units) | S3.7 | S11.3 |
|---|---|---|
| Spectral Index, | 0.87 | 0.99 |
| Electron index | 2.74 | 2.98 |
| 104 | 100 | |
| (IC/CMB) | 1.8 | 2.2 |
| (synchrotron) | 3.1 | 2.8 |
| Magnetic field (10-6 G) | 180 | 195 |
| Volume (1064cm3) | 1.81 | 4.21 |
| Luminosity (1043 erg s-1) | 1.36 | 0.98 |
Notes to table
a)Two values of are listed. The IC/CMB entry is for the case where the synchrotron spectrum cuts off after the UV data whereas the synchrotron entry is for a synchrotron spectrum extending to the X-ray band.
b) The values of the magnetic field reported are related to the synchrotron interpretation.
3.2. A peculiar optical feature
We noticed a linear optical feature on both HST images: 1.6 m and 7216 (fig. 3). It is a little over an arcsec long (3.5kpc if at the distance of 3C 17), with a major axis within 11∘ of the perpendicular to the jet at just the point where the radio emission recommences after the ’gap’ following S3.7. This feature is (a projected distance of 25kpc) from the nucleus and has an optical AB magnitude of 23. At 7200 , there is a ’hole’ in the center; one or more pixels are comparable to the background level. At 1.6m, there is no hole. If we measure just the outer bits, we find a two-point spectral index, = 1.70.2. If we measure the entire object, it is 2.20.2. There is no evidence of X-ray or radio emission corresponding to this feature. Flux densities and upper limits are given in Table 4.
If the object were an edge on spiral at the same distance of 3C 17, its absolute magnitude would be -17 which, when coupled with an overall size of 3.5 kpc would mean it could be classified as a dwarf spiral (see Schombert et al. 1995).
| Frequency | Flux density |
|---|---|
| 5 GHz | 0.5 mJy |
| 1.6 m | 4.80.3 Jy |
| 7216 | 0.730.04 Jy |
| 1457 | 0.15 nJy |
| 11018Hz | 0.1 nJy |
We consider 4 types of possibile explanations for this object.
-
•
The object is a foreground or background object (e.g. edge on spiral) and has nothing whatsoever to do with the jet. A rough estimate of the probability of the jet crossing a random background source within the 0.2′′ nuclear region (defined by the lowered brightness center at 7216) is 0.2/360=5. However, since we don’t know how to estimate the probability that the (upstream) invisible jet just happens to start converting some of its power into relativistic electrons and B field at this location, and since we are wary of a posteriori probabilities, the ’chance alignment’ hypothesis seems unlikely, but remains a possibility.
-
•
The emitting region arises from the interaction of the jet and some pre-existing entity (e.g. a large HI cloud, only a part of which gets ionized and produces free-free emission). This hypothesis can be tested with an optical spectrum since the most likely method of creating optical emission from the interaction of a jet and cold gas would be via ionization leading to recombination lines and an optically thin continuum. Since the observed spectrum is inconsistent with free-free emission from an ionized gas at K, it would have to be dominated by emission lines. The two observed bands correspond to 1.27-1.36 and 5452-6387 angstroms at the redshift of 3C 17. Neither of these bands would be expected to contain the more likely emission lines envisaged by this scenario.
-
•
The emitting region comes from an unknown property of the jet. To our knowledge, no other jet exhibits such a narrow band feature perpendicular to its axis.
-
•
The object is indeed an edge on spiral and is a close companion of 3C 17. The jet pierces the center of this galaxy and that is why the jet begins to be visible at this location. This jet, like all one sided jets, is coming ’mostly’ towards us: perhaps 10∘ - 30∘ to the l.o.s. for this section of the jet. Since the edge on spiral’s plane is perpendicular to the plane of the sky, the actual impacting jet will be close to hitting the plane of the galaxy at an oblique angle, not coming in at the pole, as it appears in the projected view. In any event the probability of hitting an object whose’s center subtends 1 kpc2 (as seen from the SMBH of 3C 17) by chance is (again, an a posteriori probability).
If we refuse to allow ’intent’ (e.g. ’intergalactic engineering’), we are left with an improbable chance alignment, an interaction with some pre-existing entity, or some new type of jet-related emission. An optical spectrum of this object could eliminate some of these possibilities.
4. How curved jets can provide evidence for IC/CMB X-ray emission
Most jets that have been well studied are relatively straight and the assumption is normally made that , the angle to the l.o.s., does not change along the jet. A curving jet provides an advantage because a changing viewing angle should be reflected in the run of the ratio, R, of X-ray to radio intensities differently for synchrotron and IC emissions. If, and only if, the X-ray emission is dominated by IC/CMB emission will the emitting regions closer to the line of sight than the others display anomalously large values of R.
In X-ray synchrotron jets, R is often a sharply decreasing function of distance down the jet (“class 1” e.g. 3C273, Jester et al. 2006), and we normally ascribe this to a decreasing ability to produce electrons of the required energies (possibly caused by an increasing magnetic field strength). In other straight jets normally thought to be representative of IC/CMB X-ray emission, the ratio may decrease smoothly (mimicking the synchrotron) or is sensibly constant down the jet (“class 2” e.g. 4C19.44, Schwartz et al. 2007). Normally these two possibilities are ascribed to a smoothly decelerating flow (thereby diminishing the IC component) or a relatively uniform value for which would maintain the effective energy density of the CMB.
For a curved jet with changing , there may be anomalous changes in synchrotron brightness associated with the effect of on (the beaming factor), but the ratio of X-ray to radio emission should be preserved and remain unaffected by changing . In the IC/CMB scenario, the critical point is that a smaller will lead to a marked change in R (unlike the synchrotron case), deviating either from the smoothly decreasing ratio or from a constant ratio.
The knot S11.3 is brighter than adjacent knots in all 3 bands (radio, optical, and X-rays). Is this because it is where the curving jet lies closest to the l.o.s. or is it just an intrinsically stronger emitting region which might be caused by a longer path length at a tangential point? The longer pathlength possibility will again not disturb the intrinsic X-ray/radio behavior for either emission mechanism, so if we can show that S11.3 has an anomalously large ratio, it will be a strong indicator that the X-ray emission process is IC/CMB.
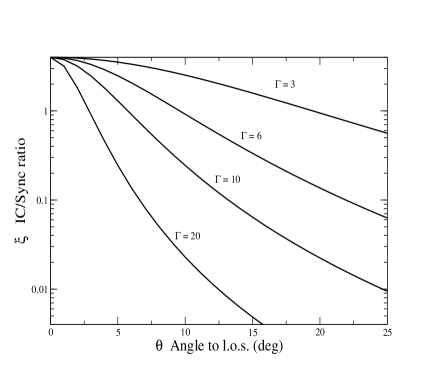
For IC/CMB emission, the preference for IC scattering when the electrons are meeting the photons ’head-on’ in the jet frame, produces more IC emission in the downstream direction. The angular dependency of this extra beaming term is given in eq. (A22) of Harris & Krawczynski (2002) and with a few substitutions can be written as:
| (1) |
where is the bulk Lorentz factor of the emitting region and . This function is shown in fig. 6 for a few representative values of .
Although our data for 3C 17 are inadequate to perform a meaningful test, current parameters are given in Table 5 as an illustration of the method. While it is true that R is larger for S11.3 than for the adjoining knots, R(S3.7) is more than twice R(S11.3). To sustain an IC/CMB explanation for the X-rays of both knots, it becomes necessary to posit a smaller value of for the outer parts of the jet compared to that ascribed to S3.7. That would mean that the term in eq.(A22) (ibid) would dominate the change in R between S3.7 and S11.3. In the present context the beaming parameters for S3.7 could be (see § 3) =8, =7∘ while at S11.3, =5.4, =5.4, and =10∘ and in this case, the angular dependence is not the dominant effect. Obviously we have too much freedom because of the short Chandra observation: what is required for this test is a longer observation which would provide robust X-ray detections of all the knots in Table 5 so as to compare R values all along the jet.
Other sources with curved jets are 3C120 (for which it is not obvious where is at a minimum) and 4C65.15, a higher redshift quasar whose morphology mimics that of 3C 17 and also has an X-ray detection of a knot at the location of maximum curvature of the jet (Miller & Brandt 2008).
| Knot | X-ray Flux | Ratio | |
|---|---|---|---|
| (10-15cgs) | (10-15cgs) | ||
| S3.7 | 1.45 | 6.4 | 4.4 |
| S10.3 | 1.06 | 1.5 | |
| S11.3 | 3.83 | 7.1 | 1.9 |
| S10.8 | 3.24 | 1.6 | 0.5 |
| S9.6 | 1.80 | 1.6 | 0.9 |
| S8.0 | 1.25 | 1.6 | 1.3 |
| S7.2 | 4.63 | 1.6 | 0.3 |
Notes to table
The X-ray flux is for the band 0.5 to 7 keV from our 8ks observation. Dividing col.3 by col.2 yields the ratios of column 4. The X-ray flux of S10.8 comes from a single event and is reported here for illustrative purpose only
5. Summary
We have detected two knots in the 3C 17 jet in both X-rays and optical/IR bands. The resulting radio to X-ray spectra do not provide a definitive answer to the choice between IC/CMB and synchrotron X-ray emission. Additionally, we have described a peculiar optical object, possibly an edge-on spiral galaxy, which appears to be pierced by the jet. Although our X-ray data are not sufficient for the detection of additional jet knots, we have shown how the ratio of X-ray to radio intensities for the knots of curved jets can be used as a diagnostic for the X-ray emission process. IC/CMB emission, being more tightly beamed than synchrotron emission would be manifest by a larger ratio for a knot moving closer to the line of sight than its neighbors.
References
- Albert et al. (1977) Cardelli, J. A., Clayton, G. C., Mathis, J. S. 1989, ApJ, 345, 245
- Albert et al. (1977) Buttiglione, S., Capetti, A., Celotti, A., Axon, D.J., Chiaberge, M., Macchetto, F.D., Sparks, W.B. 2008, A&A, submitted
- Albert et al. (1977) Dickson, R., D. 1997, PhD thesis, Univ. Sheffield
- Albert et al. (1977) Donzelli, C. J., Chiaberge, M., Macchetto, F. D. 2007, ApJ, 667, 780
- Albert et al. (1977) Harris, D. E., Krawczynski, H. 2002, ApJ, 565, 244
- Albert et al. (1977) Harris, D. E., Krawczynski, H. 2006, ARA&A, 44, 463
- Albert et al. (1977) Jester, S., Harris, D. E., Marshall, H. L., Meisenheimer, K. 2006, ApJ, 648, 900
- Albert et al. (1977) Kalberla, P.M.W., Burton, W.B., Hartmann, D. 2005, A&A, 440, 775
- Albert et al. (1977) Ledlow, M. J., Owen, F. N. 1996, IAUS, 175, 238L
- Albert et al. (1977) Miller, B. & Brandt, N., 2008 ApJ, submitted
- Albert et al. (1977) Morganti, R., Killeen, N. E. B., Tadhunter, C. N., 1993 MNRAS, 263, 1023
- Albert et al. (1977) Morganti, R., Oosterloo, T., Tadhunter, C. N. 1999 A&AS, 140, 355
- Albert et al. (1977) Protheroe, R. J., 2004APh, 21, 415
- Albert et al. (1977) Schmidt, M. 1965 ApJ, 141,1
- Albert et al. (1977) Schombert, J. M., Pildis, R. A., Eder, J. A., & Oemler, A., 1995, AJ 110, 2067
- Albert et al. (1977) Schwartz, D. A., et al. 2007, Ap&SS, 311,341
- Albert et al. (1977) Siebert, J., Brinkmann, W., Morganti, R. 1996, MNRAS, 279, 1331
- Albert et al. (1977) Spergel, D. N., et al. 2007, ApJS, 170, 377
- Albert et al. (1977) Tadhunter, C. N., et al., 1998, MNRAS, 298, 1035
- Albert et al. (1977) Tavecchio, F., Maraschi, L., Sambruna , R. M. 2000 ApJ, 544L, 23
- Albert et al. (1977) Venturi, T., Morganti, R., Tzioumis, T., Reynolds, J. 2000, A&A, 363, 84