Optical and X-ray Observations of M31N 2007-12b: An Extragalactic Recurrent Nova with a Detected Progenitor?
Abstract
We report combined optical and X-ray observations of nova M31N 2007-12b. Optical spectroscopy obtained 5 days after the 2007 December outburst shows evidence of very high ejection velocities (FWHM H km s-1). In addition, X-ray data show that M31N 2007-12b is associated with a Super-Soft Source (SSS) which appeared between 21 and 35 days post-outburst and turned off between then and day 169. Our analysis implies that M⊙ in this system. The optical light curve, spectrum and X-ray behaviour are consistent with those of a recurrent nova. Hubble Space Telescope observations of the pre-outburst location of M31N 2007-12b reveal the presence of a coincident stellar source with magnitude and color very similar to the Galactic recurrent nova RS Ophiuchi at quiescence, where the red giant secondary dominates the emission. We believe that this is the first occasion on which a nova progenitor system has been identified in M31. However, the greatest similarities of outburst optical spectrum and SSS behaviour are with the supposed Galactic recurrent nova V2491 Cygni. A previously implied association of M31N 2007-12b with nova M31N 1969-08a is shown to be erroneous and this has important lessons for future searches for recurrent novae in extragalactic systems. Overall, we show that suitable complementary X-ray and optical observations can be used not only to identify recurrent nova candidates in M31, but also to determine subtypes and important physical parameters of these systems. Prospects are therefore good for extending studies of recurrent novae into the Local Group with the potential to explore in more detail such important topics as their proposed link to Type Ia Supernovae.
Subject headings:
galaxies: individual (M31) — stars: novae, cataclysmic variables — supernovae: general — white dwarfs1. Introduction
Classical Novae (CNe) are cataclysmic variable stars whose outbursts are due to a Thermonuclear Runaway (TNR) on the surface of a white dwarf in an interacting binary system (see e.g. Starrfield et al., 2008). Recurrent Novae (RNe) are related to CNe, but have been seen to undergo more than one recorded outburst and may contain evolved secondary (mass-donating) stars (see Anupama, 2008, for a review). Recurrent novae have been proposed as one of the primary candidates for the progenitors of Type Ia Supernovae (SNe - see e.g. Kotak, 2008, for a recent review).
At present we know of a total of only 10 RNe in the Galaxy with confidence (based on two or more nova outbursts being observed). These RNe
appear to fall into three main groups, viz.:
RS Oph/T
CrB with red giant secondaries, consequent long orbital periods
( several hundred days), rapid declines from outburst ( mag day-1), high initial ejection velocities ( km
s-1) and strong evidence of the interaction of the ejecta with
the pre-existing circumstellar wind of the red giant (from
observations of optical coronal lines, non-thermal radio emission
and hard X-ray development in RS Oph; see papers in Evans et al., 2008);
The
more heterogeneous U Sco group with members’ central systems
containing an evolved main sequence or sub-giant secondary with an
orbital period much more similar to that in CNe (of order hours to a
day), rapid optical declines (U Sco itself being one of the fastest
declining novae of any type), extremely high ejection velocities
( km s-1, from FWZI of emission lines for U
Sco) but no evidence of the extent of shock interactions seen in RS Oph
post-outburst (their post-outburst optical spectra resemble the
‘He/N’ class of CNe – Williams, 1992);
T Pyx, CI Aql, IM Nor are
again short orbital period systems and although their optical spectral
evolution post-outburst is similar, with their early time spectra
resembling the ‘Fe II’ CNe, they show a very heterogenous set of
moderately fast to slow declines in their optical light curves. This
sub-group of RNe also seems to show ejected masses similar to
those at the lower end of the ejected mass range for CNe with M⊙ (which appears to be one to two orders of magnitude
greater than in the other two sub-groups of RNe).
The short recurrence periods of RNe require high mass WD accretors and relatively high accretion rates (e.g. Starrfield et al., 1988). Indeed, both RS Oph and U Sco appear to have WDs near to the Chandrasekhar mass limit. The WD mass in both these objects has been proposed as growing and therefore they are potential SN Ia progenitors (see e.g. Sokoloski et al., 2006; Kahabka et al., 1999, respectively)
The study of RNe is thus important for several broader fields of investigation including mass loss from red giants, the evolution of supernova remnants and the progenitors of Type Ia SNe. Progress in determining the latter association in particular, as well as exploring the evolutionary history of these close binary systems, is hampered by the relative rarity of Galactic RNe. However, since the time of Edwin Hubble, CNe have been observed in extragalactic systems, in particular M31 (see Shafter, 2008, for a review). In total over 800 CN candidates have been catalogued in M31 (Pietsch et al., 2007) and among these are thought to lie several RNe (see e.g. della Valle & Livio, 1996; Shafter et al., 2009b). Indeed Pietsch et al. (2007) identified 4 candidates in their search for the X-ray counterparts of optical novae in M31 (see also Henze et al., 2009). In this paper we present evidence for an object in M31 previously classified as being a CN as in fact being a recurrent nova. We use a combination of optical and X-ray observations to explore its more detailed nature, emphasise the need for careful exploration of archival material to confirm or rule out previous outbursts, and go on to point the way to more extensive observational programs in the future.
2. Observations of the 2007 Outburst
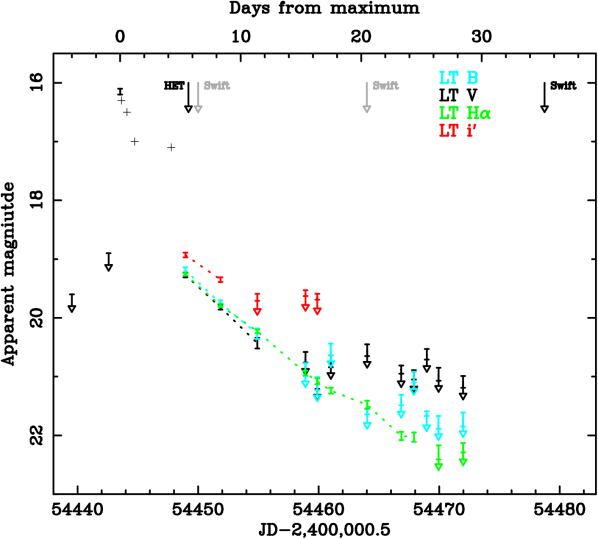
Nova M31N 2007-12b was discovered on 2007 December 9.53 UT (which we take as ) by K. Nishiyama and F. Kabashima111http://www.cfa.harvard.edu/iau/CBAT_M31.html at mag (unfiltered) and located at RA = 00h 43m 19s.940s.01, DECL (J2000). They reported that no object had been visible at this position on 2007 December 8.574 UT. Fig.1 gives details of these and other optical observations around peak. Broadband plus narrowband H photometry was subsequently obtained with the RATCam CCD camera on the 2-m Liverpool Telescope (LT; Steele et al., 2004). LT photometry is part of a larger program of photometry and spectroscopy of novae in M31 (Shafter et al., 2009a) and began on 2007 December 14.94 UT ( days post-outburst) then continued for 23 days. The LT data were reduced using standard routines within the IRAF222IRAF is distributed by the National Optical Astronomy Observatory, which is operated by the Association for Research in Astronomy, Inc. under cooperative agreement with the National Science Foundation. and STARLINK packages, and calibrated against standard stars from Landolt (1992) and by using the secondary standards in M31 (Magnier et al., 1992; Haiman et al., 1994). The resulting lightcurves are shown in Fig.1.
The astrometric position of M31N 2007-12b was measured from an LT Sloan -band image taken on 2007 December 14.95 UT. This image was chosen as a compromise between good seeing and nova brightness. An astrometric solution was obtained using 21 stars from the 2MASS All-Sky Catalogue (Cutri et al., 2003) which are coincident with resolved sources in the LT observation. We obtain a position for M31N 2007-12b of RA = 00h 43m 19s.970s.01 DECL (J2000; consistent with Nishiyama and Kabashima’s measurement). It should be noted that the astrometric uncertainty is dominated by uncertainties in the plate solution.
Optical spectroscopy was obtained by us on 2007 December 15.2 UT ( days) with the 9.2-m Hobby Eberly Telescope (HET) using the Low Resolution Spectrograph (LRS; Hill et al., 1998). We used the 1 grating with a slit and the GG385 blocking filter, which covers Å with a resolution of , although we limit any analysis to the Å range where the effects of order overlap are minimal. Data reduction was performed using standard IRAF packages and the resulting spectrum is shown in Fig.2.
Kong & Di Stefano (2007) reported the detection of a Super-Soft X-ray Source (SSS) coincident with the position of the nova using the X-ray Telescope (XRT) on board the satellite (Burrows et al., 2005). The detection was made serendipitously as part of a survey of SSSs in the M31 globular cluster Bol 194 on 2008 January 13.74 UT ( days) with an exposure time of 4 ks. They reported previous observations of the field on 2007 December 16 and December 30 that had not detected any source at that position. We have re-analysed the XRT data for these epochs and also consulted the Swift data archive to review other X-ray observations of this field from 2007 November to 2008 May (see Table 1 and also Fig.1).
| Date (day) | Obs ID | Exposure | count rate |
|---|---|---|---|
| time (ks) | (s-1) | ||
| 2007-11-24 (-15) | 00031027001 | 7.27 | 0.0017 |
| 2007-12-02 (-7) | 00031027002 | 1.00 | 0.0073 |
| 2007-12-03 (-6) | 00031027003 | 3.63 | 0.0037 |
| 2007-12-16 (+7) | 00031027004 | 3.89 | 0.0039 |
| 2007-12-30 (+21) | 00031027005 | 4.02 | 0.0034 |
| 2008-01-13 (+35) | 00031027006 | 3.99 | 0.015 0.002 |
| 2008-05-26 (+169) | 00037719001 | 4.86 | 0.0023 |
3. Results and Discussion
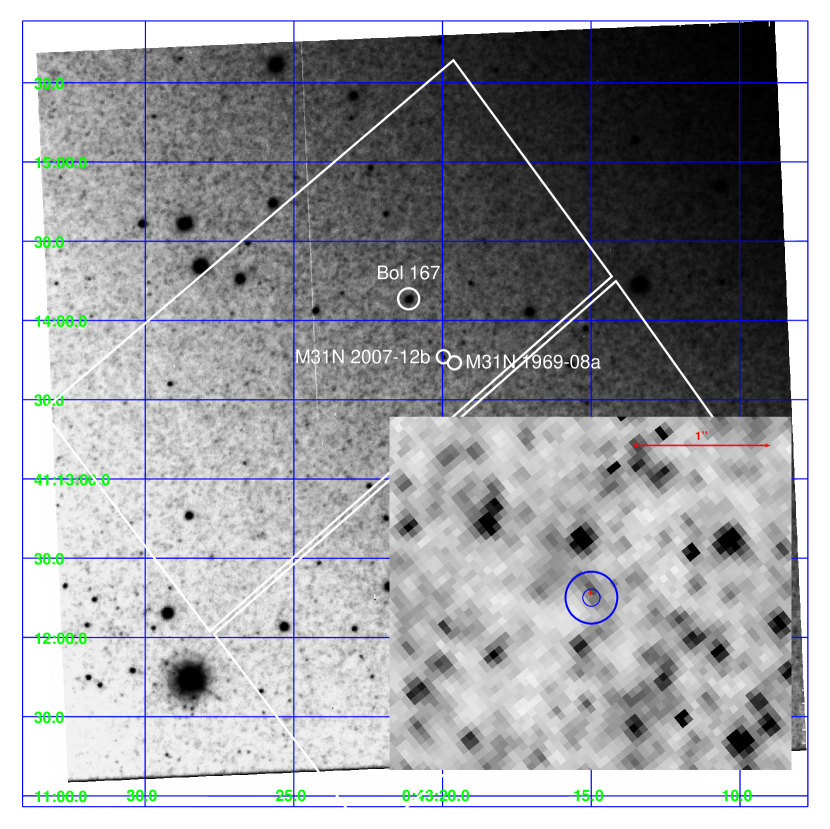
Nova M31N 2007-12b lies within of the quoted position of M31N 1969-08a (RA = 00h 43m 19s.9 , DECL (J2000); i.e. coincident within the quoted measurement errors) which was discovered on 1969 August 16.0 UT (see Sharov & Alksnis, 1991) and lies from the nucleus of M31. Peak visual magnitude was observed one day after the start of the 1969 outburst at . Subsequently, the nova declined at a rate of mag day-1 making this a very fast nova (Warner, 2008). Supposed positional coincidence and similarities in their light curves led to the initial conclusion that the outbursts were from the same object. However, consultation of the original plate material for M31N 1969-08a showed that its position is in fact RA = 00h 43m 19s.6 , DECL (J2000, i.e. separated by from M31 2007-12b) and blinking of the 1969 and 2007 images confirmed they are indeed separate objects (see Fig.3).
Our optical spectroscopy on day 5.7, shown in Fig. 2, reveals strong and very broad (FWHM H km s-1) Balmer, He I and N III 464.0 nm emission lines consistent with the spectra of He/N CNe (Williams, 1992). High emission line velocities and fast optical declines are associated with ejection from a high mass WD and are also typical of both the RS Oph and U Sco sub-classes of RNe (Anupama, 2008). Of these two, the spectrum more closely resembles that of RS Oph around 3 days after the 2006 outburst (see Fig. 2), than that observed in U Sco or the U Sco sub-class RN V394 CrA at similar phases after their outbursts in 1987 (Sekiguchi et al., 1988, 1989; Williams et al., 1991). However, the most striking spectral similarity is to the early optical spectrum of nova V2491 Cyg (again, see Fig. 2) for which, although only one outburst has been observed, it has been suggested that it is a RN (Page et al., 2009) by virtue of its very fast optical decay and high ejection velocities together with its low outburst amplitude ( mag, Jurdana-Sepic & Munari, 2008) and detection as an X-ray source pre-outburst (Ibarra et al., 2009).
3.1. Constraints from the X-ray data
Turning now to the X-ray spectra, we re-analysed the Swift detection on day 35.2 referenced by Kong & Di Stefano (2007) using the Swift software version 2.9. Source spectra were extracted from the cleaned Photon Counting mode event lists, using a 10 pixel extraction radius (1 pixel ). A total of 49 background-subtracted counts were found with only one count at keV and the rest at lower energies. As an initial guide this super-soft spectrum was then fitted with an absorbed black body spectrum using XSPEC. We estimated the absorbing column as follows. Stark et al. (1992) derive a Galactic contribution to the column in this direction equivalent to = 0.1. At the position of M31N 2007-12b in M31, following the methodology discussed in Darnley et al. (2006) and Section 3.2 below, and assuming that the nova is situated half way down the absorbing column internal to M31, we get = 0.25. Thus the total extinction to the nova is estimated to be equivalent to = 0.35, which in turn is equivalent to cm-2. The best fit to the data using this total column then gives eV (i.e. K) and for kpc to M31 (Holland, 1998; Stanek & Garnavich, 1998) yields an absorption-corrected luminosity ergs s-1 (i.e. around twice the Eddington luminosity for a 1.4 M⊙ WD). We obtained non-detections at the source position in 2007 November/December and 2008 May as detailed in Table 1.
From the above observations with Swift, the SSS was not detected , 7 and 6 days before outburst and at 7, 21 and 169 days afterwards. We can estimate therefore that the SSS appeared between and 35 days post-outburst and had turned off again at days. A caveat here is that the onset of the SSS phase has shown extreme variability in a few objects so far (e.g. RS Oph; see Page et al., 2008) and there is the possibility that the first emergence was earlier than 21 days. We can however compare the observed behavior of the M31N 2007-12b SSS with the properties of this phase in possibly related Galactic novae. For example, we note that the appearance of the SSS in U Sco was around 19-20 days after the peak of the optical outburst in February 1999 (Kahabka et al., 1999). We used the model parameters for U Sco found by Kahabka et al. (1999) to generate a spectrum with the correct unabsorbed flux. In order to determine the predicted count rate in the Swift XRT if the source were placed in M31 at kpc, the absorbing column was changed to cm-2 but the normalization and derived were kept fixed. Finally, a new spectrum was generated to derive the predicted count-rate. Table 2 gives details of the parameters of this and other sources described below, together with their derived count rates.
It can be seen from Table 2 that with the spectral parameters given in Kahabka et al. (1999), the SSS emission seen in U Sco ( kpc) would not have been detectable by at the distance of M31 in the exposure times used for M31N 2007-12b, although of course the U Sco SSS may have subsequently increased in brightness. In RS Oph ( kpc) the SSS emerged and then dominated the X-ray emission from days and turned off by days (Page et al., 2008), i.e. consistent with the timescales in M31N 2007-12b. However, as can be seen from Table 2, even at the peak of its SSS emission, RS Oph would also have been undetected in M31 with the XRT. In V2491 Cyg ( kpc), SSS emission became apparent after around 25 days (Page et al., 2009) and was sharply peaked at around 40 days. At the distance of M31, the Swift XRT observations reported here would have detected the V2491 Cyg SSS for a few days around this peak (again, see Table 2).
| kTBB | Unabsorbed Flux | Predicted Count Rate | |||
|---|---|---|---|---|---|
| (kpc) | (cm-2) | (eV) | (ergs s-1 cm-2) | (s-1) | |
| U Scoa | 14 | 107 | |||
| RS Ophb | 1.6 | 70 | |||
| V2491 Cygc | 10.5 | 52 |
a From Kahabka et al. (1999) and assuming the unabsorbed flux they quote is for the 0.1-10 keV energy range of the LECS/MECS of BeppoSAX.
b Fit to the Swift XRT data from day 50.5 after outburst during the SSS ‘plateau’ phase. The unabsorbed flux is for the 0.3-10 keV energy range of the XRT. The value used in the fit includes both interstellar and circumstellar components (see Page et al., 2008).
c Fit to the Swift XRT data from day 41.7 after outburst around the observed SSS peak count rate (Page et al., 2009). The unabsorbed flux is for the 0.3-10 keV energy range of the XRT.
It is well established that the SSS arises from continued nuclear burning on the WD surface following the TNR which is gradually unveiled as the ejecta move outwards (Krautter, 2008). The deduced temperature and luminosity of the SSS in the case of M31N 2007-12b are consistent with this model. Simplistically, the timescale for uncovering and observed onset of the SSS phase is given by (Krautter et al., 1996) where is the mass of H in the ejected envelope and is the ejection velocity. Thus for the low ejected masses and high ejecta velocities found in RS Oph-type and U Sco-type RNe, would be expected to be relatively short compared to that for the T Pyx sub-class of RNe or its value for most CNe.
The turn-off time since outburst for nuclear burning, , is a steep function of WD mass. MacDonald (1996) finds for example . Generally in CNe this timescale is much longer than that observed in M31N 2007-12b (although Pietsch et al., 2007, make the point that this might be ascribed in part to a selection effect). For example, in one of the best studied cases, the moderately fast CN V1974 Cyg, days (Balman et al., 1998) with M⊙ (Hachisu & Kato, 2006). From Starrfield et al. (1991), days implies M⊙. Similarly, the timescale after outburst for the onset of the SSS phase, , is also a function of in the sense that is likely to be shorter for systems containing a high mass WD. As noted above, both U Sco and RS Oph have very short observed of days (Kahabka et al., 1999) and days (Bode et al., 2006) respectively. In both cases, the WD mass is determined to be approaching the Chandrasekhar mass limit of M M⊙ (Kahabka et al., 1999; Hachisu et al., 2007). Similarly, the WD mass in V2491 Cyg is estimated to be M⊙ (Hachisu & Kato, 2009; Page et al., 2009). In addition, we note that envelope composition may also be important in determining the duration of the SSS phase. However, with days and days, M⊙ for the range of envelope compositions presented in Hachisu & Kato (2006) and in particular, M⊙ for the cases of (fast) Neon novae they present.
3.2. A search for the progenitor system
If M31N 2007-12b arose from a RN system of the RS Oph sub-type, it would contain a red giant secondary. We thus explored its detection at quiescence in archival Hubble Space Telescope (HST) imagery. The HST is capable of resolving giant branch stars within M31 (see Fig.4). The positions of both M31N 2007-12b and M31N 1969-08a lie within a pair of archival HST Advanced Camera for Surveys (ACS) Wide Field Channel (WFC) images (prop. ID 10273) taken in August 2004 using the F814W () and the F555W () filters. PSF fitting photometry was performed on all detected objects in both HST pass-bands using DOLPHOT, a photometry package based on HSTphot (Dolphin, 2000). We used the relations given in Sirianni et al. (2005) to transform from these filters to Johnson-Cousins and .
To isolate the position of M31N 2007-12b within the HST data we computed the spatial transformation between the LT and Gaussian convolved HST data using 23 stars resolved and unsaturated in both images. This approach is independent of the astrometric calibration of both fields and hence yields the most accurate results. The uncertainty in the derived transformation is small when compared to the 0.22 pixel () average positional error of the nova in the LT data. This positional uncertainty in the LT data equates to a 1.25 pixel positional uncertainty () within the HST data.
There is a resolved object just inside from the LT position (separated 1.12 HST pixels or ) seen in the HST F555W image (see inset of Fig.3). We find that this object has and , hence a color of . It should be noted that there is a cosmic ray track very close to this object’s position in the F814W image, hence the -band photometry may have been adversely affected by the subtraction of the cosmic ray. There are no other resolved stars within 1.90 HST pixels or .
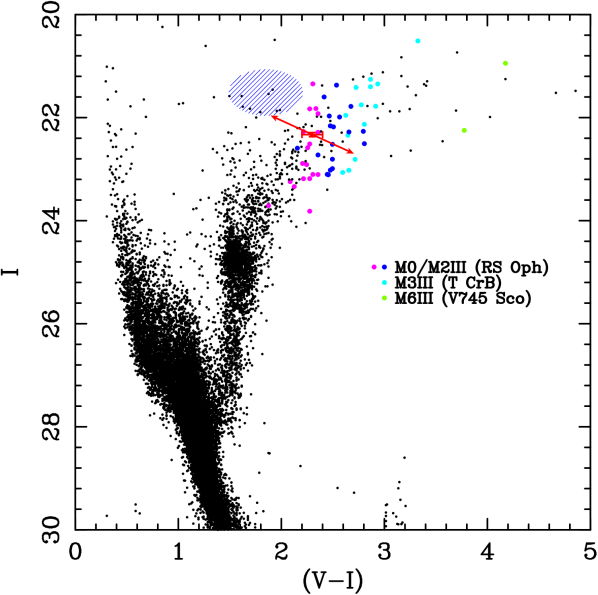
Shown in Fig.4 is the position on a color-magnitude diagram of the object spatially coincident with M31N 2007-12b. This object (assuming no additional internal M31 extinction) lies in the M0/M2III (RS Oph secondary, purple and dark blue dots respectively) and M3III (T CrB secondary, light blue dots) region of the Giant Branch. The probability of finding such a star (, ) at least as close to the predicted position by chance is only 3.4%. We note as an aside that we have explored the region around M31N 1969-08a and found no significant spatial coincidence with any pre-existing stellar source.
We estimate the mean -band extinction across an Sb galaxy, such as M31, to be magnitudes, equivalent to (Holwerda et al., 2005). However, we can estimate that the average extinction experienced by an object at this position in M31 would be magnitudes, equivalent to (Darnley, 2005, see above).
We also calculate the position of a quiescent RS Oph system on this diagram. We use the LT and luminosities of RS Oph in the time range of 400-1300 days following the 2006 outburst (see Darnley, Hounsell, & Bode, 2008, for days 400-600) to estimate the mean quiescent magnitudes, , . These magnitudes were then corrected for the extinction towards RS Oph (, Snijders, 1987) and the distance to RS Oph ( kpc, Bode, 1987). The Sloan- flux was transformed to the Johnson-Cousins system, the system was placed at the distance of M31 and reddened by an amount equal to the extinction towards that galaxy. We find that the expected mean quiescent magnitude of an RS Oph-like system in M31 (without any internal extinction) is with a color of . Further correcting for the expected average internal M31 extinction yields, , . We note that these values of quiescent magnitudes and colors include contributions from other sources than the secondary (e.g. any accretion disk).
4. Conclusions
M31N 2007-12b shows several characteristics consistent with it being a recurrent nova. These include the rapidity of its optical decline, extremely high ejection velocities and early emergence of its SSS phase. The early post-outburst optical spectrum also shows some similarities to that of RS Oph, but most closely resembles that of the proposed RN V2491 Cyg. Furthermore, we have found a coincident pre-outburst stellar source from archival HST observations that resides in the same region of the color-magnitude diagram as RS Oph. If this is indeed the quiescent nova system, this is the first time that this has been identified in a nova in M31. This finding also implies an outburst amplitude of mag, very similar to that given by Jurdana-Sepic & Munari (2008) for nova V2491 Cyg, although around 1 mag greater than that for RS Oph. The observed flux from the SSS detected in M31N 2007-12b is also more consistent with that of the short-lived peak at around 40 days in V2491 Cyg than that of the SSS in RS Oph. On the other hand, the secondary maximum reported in the light curve of V2491 Cyg at around days is not apparent in our LT data for M31N 2007-12b.
Among the Galactic RNe, both U Sco and RS Oph sub-types have been proposed as progenitors of Type Ia SNe as MCh and it has been concluded that there is a net accumulation of mass on the WD over time (Kahabka et al., 1999; Hachisu et al., 2007). Determination of the true nature of Type Ia progenitors is of course a very important quest for contemporary astrophysics, but still remains a controversial area. recurrent novae have been one of the favored systems, but there are likely to be more problems in explaining the lack of H in SNIa spectra for RS Oph-like than for U Sco-like RNe. Certainly, the paucity of Galactic examples remains a hindrance to further progress. We have shown that it is now possible to identify RNe in M31, and even to determine their sub-type, via a suitable set of complementary observations. However, from our experience we caution that identifying RNe from positional (near) coincidence of two or more outbursts can be precarious (e.g., see Shafter et al., 2009b). All RN candidates should be thoroughly explored through precise astrometry of the original images, where available. Furthermore, ambiguities of distance and host stellar population are negated for novae in M31, and the soft X-ray absorbing column is low, compared to their Galactic counterparts. Thus the prospects are good for extending our studies of RNe, and in particular exploring any relationship to supernovae, from the Milky Way to potentially a much larger and better-defined sample of objects in the Andromeda galaxy.
References
- Anupama (2008) Anupama, G.C. 2008, in RS Ophiuchi (2006) and the Recurrent Nova Phenomenon, edited by A. Evans, M.F. Bode, T.J. O’Brien and M.J. Darnley, ASP Conf Series, 401, 31
- Balman et al. (1998) Balman, S., Krautter, J., & Ögelman, H. 1998, ApJ, 499, 395
- Bode (1987) Bode M. F., 1987, in RS Ophiuchi (1985) and the Recurrent Nova Phenomenon, ed M.F. Bode, VNU Science Press, 241
- Bode et al. (2006) Bode, M.F., et al. 2006, ApJ, 652, 629
- Burrows et al. (2005) Burrows, D.N., et al. 2005, Space Sci. Rev., 120, 165
- Cutri et al. (2003) Cutri, R. M., et al. 2003, The IRSA 2MASS All-Sky Point Source Catalog, NASA/IPAC Infrared Science Archive. http://irsa.ipac.caltech.edu/applications/Gator/
- Darnley (2005) Darnley M. J., 2005, PhD dissertation, Liverpool John Moores University, UK
- Darnley et al. (2006) Darnley, M.J., et al. 2006, MNRAS, 369, 257
- Darnley, Hounsell, & Bode (2008) Darnley M. J., Hounsell R. A., Bode M. F. 2008, in RS Ophiuchi (2006) and the Recurrent Nova Phenomenon, edited by A. Evans, M.F. Bode, T.J. O’Brien and M.J. Darnley, ASP Conf Series, 401, 203
- della Valle & Livio (1996) della Valle, M, & Livio, M. 1996, ApJ, 473, 240
- Dolphin (2000) Dolphin A. E., 2000, PASP, 112, 1383
- Evans et al. (2008) Evans, A., Bode, M.F., O’Brien T.J., & Darnley M.J. 2008, editors, RS Ophiuchi (2006) and the Recurrent Nova Phenomenon, ASP Conf Series, Volume 401
- Freedman & Madore (1990) Freedman W. L., Madore B. F., 1990, ApJ, 365, 186
- Hachisu & Kato (2006) Hachisu, I., & Kato, M. 2007, ApJS, 167, 59
- Hachisu & Kato (2009) Hachisu, I., & Kato, M. 2009, ApJ, 694, L103
- Hachisu et al. (2007) Hachisu, I., Kato, M., & Luna, G.J.M. 2007, ApJ, 659, L153
- Haiman et al. (1994) Haiman, Z., et al. 1994, A&A, 286, 725
- Henze et al. (2009) Henze, M., et al. 2009, A&A, 498, L13
- Hill et al. (1998) Hill, G.J., Nicklas, H.E., MacQueen, P.J., Tejada, C., Cobos Duenas, F.J., & Mitsch, W. 1998, Proc. SPIE, 3355, 375
- Holland (1998) Holland, S. 1998, AJ, 115, 1916
- Holwerda et al. (2005) Holwerda B. W., Gonzalez R. A., Allen R. J., van der Kruit P. C., 2005, AJ, 129, 1396
- Ibarra et al. (2009) Ibarra, A., et al. 2009, A&A, 497, L5
- Jurdana-Sepic & Munari (2008) Jurdana-Sepic, R., & Munari, U. 2008, IBVS, 5839
- Kahabka et al. (1999) Kahabka, P., Hartmann, H.W., Parmar, A.N., & Negueruela, I. 1999, A&A, 347, L43
- Kong & Di Stefano (2007) Kong, A.K.H., & Di Stefano, R. 2007, ATel 1360
- Kotak (2008) Kotak, R. 2008, in RS Ophiuchi (2006) and the Recurrent Nova Phenomenon, edited by A. Evans, M.F. Bode, T.J. O’Brien and M.J. Darnley, ASP Conf Series, 401, 150
- Krautter (2008) Krautter, J. 2008, in Classical Novae, 2nd Ed., edited by M.F. Bode and A. Evans, Cambridge University Press, p232
- Krautter et al. (1996) Krautter, J., Ögelman, H., Starrfield, S., Wichmann, R., & Pfeffermann, E. 1996, ApJ, 456, 788
- Landolt (1992) Landolt, A.U. 1992, AJ, 104,340
- Lee et al. (2007) Lee, C.-H., Ries, C., Riffeser, A., & Seitz, S. 2007, ATel 1324
- MacDonald (1996) MacDonald, J. 1996, in Cataclysmic Variable and Related Objects, editors A. Evans and J.H. Wood, Kluwer, Dordrecht, p281
- Magnier et al. (1992) Magnier, E. A., Lewin, W. H. G., van Paradijs, J., Hasinger, G., Jain, A., Pietsch, W., & Truemper, J. 1992, A&AS, 96, 379
- Munari et al. (1999) Munari, U, Zwitter, T., Tomov, T., Bonifacio, P., Molaro, P., Selvelli, P., Tomasella, L., Niedzielski, A., & Pearce, A. 1999, A&A, 347, L39
- Page et al. (2008) Page, K.L., Osborne, J.P., Beardmore, A.P., Goad, M.R., Wynn, G.A., Bode, M.F., & O’Brien, T.J. 2008, in RS Ophiuchi (2006) and the Recurrent Nova Phenomenon, edited by A. Evans, M.F. Bode, T.J. O’Brien and M.J. Darnley, ASP Conf Series, 401, 283
- Page et al. (2009) Page, K.L. et al. 2009, MNRAS, submitted
- Perryman & ESA (1997) Perryman, M. A. C., & ESA 1997, ESA Special Publication, 1200
- Pietsch et al. (2007) Pietsch, W., et al. 2007a, A&A, 465, 375
- Rosino & Iijima (1987) Rosino, L., & Iijima, T. 1987, in RS Ophiuchi (1985) and the Recurrent Nova Phenomenon, edited by M.F. Bode, VNU Science Press, Utrecht, p27
- Schlegel, Finkbeiner, & Davis (1998) Schlegel D. J., Finkbeiner D. P., Davis M., 1998, ApJ, 500, 525
- Sekiguchi et al. (1988) Sekiguchi, Feast, M.W., Whitelock, P.A., Overbeek, M.D., Wargau, W., & Spencer Jones, J. 1988, MNRAS, 234, 281
- Sekiguchi et al. (1989) Sekiguchi, K., Catchpole, R.M., Fairall, A.P., Feast, M.W., Kilkenny, D., Laney, C.D., Lloyd Evans, T., Marang, F., & Parker, Q.A. 1989, MNRAS, 236, 611
- Shafter (2008) Shafter, A.W. 2008, in Classical Novae, 2nd Ed., edited by M.F. Bode and A. Evans, Cambridge University Press, p335
- Shafter et al. (2009a) Shafter, A.W., Rau, A., Quimby, R.M., Kasliwal, M.M., Bode, M.F., Darnley, M.J., & K. A. Misselt, K.A. 2009a ApJ, 690, 1148
- Shafter et al. (2009b) Shafter, A.W., Rice, & Daub, 2009b, Proceedings of Tuscson CV Conference, “Wild Stars in the Old West”, in press (to be published on-line)
- Sharov & Alksnis (1991) Sharov, A.S., & Alksnis, A. 1991, ASS, 180, 273
- Sirianni et al. (2005) Sirianni M., et al., 2005, PASP, 117, 1049
- Snijders (1987) Snijders M. A. J., 1987, in RS Ophiuchi (1985) and the Recurrent Nova Phenomenon, ed M.F. Bode, VNU Science Press, 51
- Sokoloski et al. (2006) Sokoloski, J.L., Luna, G.J M., Mukai, K., & Kenyon, S.J. 2006, Nature 442, 276
- Stanek & Garnavich (1998) Stanek, K.Z., & Garnavich, P.M. 1998, ApJ, 503, L131
- Stark et al. (1992) Stark, A.A., et al. 1992, ApJS, 79, 77
- Starrfield et al. (1988) Starrfield, S., Sparks, W.M., & Shaviv, G. 1988, ApJ, 325, L35
- Starrfield et al. (1991) Starrfield, S., Truran, J.W., Sparks, W.M., & Krautter, J. 1991, in Extreme Ultraviolet Astronomy, edited by R.F. Malina and M. Livio, Pergamon, Oxford, p168
- Starrfield et al. (2008) Starrfield, S., Iliadis, C., & Hix, W.P. 2008, in Classical Novae, 2nd Ed., edited by M.F. Bode and A. Evans, Cambridge University Press, p77
- Steele et al. (2004) Steele, I.A., et al. 2004, Proc. SPIE, 5489, 679
- Warner (2008) Warner, B. 2008, in Classical Novae, 2nd Ed., edited by M.F. Bode and A. Evans, Cambridge University Press, p16
- Williams et al. (1991) Williams, R.E., Hamuy, M., Phillips, M.M., Heathcote, S.R., Wells, L., & Navarrete, M. 1991, ApJ, 376, 721
- Williams (1992) Williams, R.E. 1992, AJ, 104, 725