The Origin of the Silicate Emission Features in the Seyfert 2 Galaxy, NGC2110
Abstract
The unified model of active galactic nuclei (AGN) predicts silicate emission features at 10 and 18 m in type 1 AGN, and such features have now been observed in objects ranging from distant QSOs to nearby LINERs. More surprising, however, is the detection of silicate emission in a few type 2 AGN. By combining Gemini and Spitzer mid-infrared imaging and spectroscopy of NGC 2110, the closest known Seyfert 2 galaxy with silicate emission features, we can constrain the location of the silicate emitting region to within 32 pc of the nucleus. This is the strongest constraint yet on the size of the silicate emitting region in a Seyfert galaxy of any type. While this result is consistent with a narrow line region origin for the emission, comparison with clumpy torus models demonstrates that emission from an edge-on torus can also explain the silicate emission features and 2–20 m spectral energy distribution of this object. In many of the best-fitting models the torus has only a small number of clouds along the line of sight, and does not extend far above the equatorial plane. Extended silicate-emitting regions may well be present in AGN, but this work establishes that emission from the torus itself is also a viable option for the origin of silicate emission features in active galaxies of both type 1 and type 2.
1 Introduction
In the unified model of active galactic nuclei (AGN), the differences between objects of types 1 and 2 are explained by a torus of dust and gas that obscures the broad line gas from some viewing angles while leaving it exposed from others. Various lines of evidence, notably the detection of polarized broad emission lines in type 2 objects (Antonucci & Miller, 1985), support the hypothesis of anisotropic obscuration, but the chemistry, structure and origin of the torus, as well as the true extent of its role in unifying the various types of AGN, remain the subject of intense study.
The dust in the torus is expected to absorb short wavelength radiation from the nucleus and re-emit it in the mid-infrared (MIR), and a strong constraint on models aiming to explain and predict emission from the torus is the Si-O bond stretch near 10 m. In the simplest realisations of the unified model, an edge-on view through cool dust in the torus causes a prominent absorption feature in type 2 AGN. In type 1 AGN, where hot dust at the inner surface of the torus is revealed, models often predict strong silicate emission (e.g. Efstathiou & Rowan-Robinson, 1995; Granato & Danese, 1994), depending on the torus geometry (Pier & Krolik, 1992).
In practice, however, the situation has proved less straightforward than this. For instance, in a sample of 16 Seyfert 1 galaxies, Roche et al. (1991) detected silicate emission in only one. More recently, Spitzer observations of QSOs have established not only that the silicate emission feature is common in those objects (Hao et al., 2005, 2007; Siebenmorgen et al., 2005) but also - surprisingly - that silicate emission is present in the average type 2 QSO spectrum (Sturm et al., 2006). Shi et al. (2006) find that in a Spitzer/IRS sample of 100 AGN, X-ray column density roughly correlates with silicate feature strength, in agreement with unified schemes. However, there are some obvious anomalies: type 1 AGN with strong silicate absorption and type 2s with silicate emission. These observations are not readily explained by simple torus models.
Sturm et al. (2005) note that the dust temperature implied by the silicate bands in the QSO spectra is 200 K, suggestive of dust in the narrow- line region (NLR) rather than in the hot inner wall of the torus. NLR dust with a temperature of 200-300 K has been detected in mid-IR images of several AGN, extended over 1-2″ from the unresolved nucleus (e.g. Bock et al., 2000; Radomski et al., 2003; Gorjian et al., 2004; Packham et al., 2005). Such dust, heated by the central engine but not directly associated with the torus itself, could explain the unexpected silicate emission in type 2 objects. Alternatively, alterations to the basic torus models may enable them to match the observations. Several recent torus models have incorporated a clumpy dust distribution (Nenkova et al., 2002; Dullemond & van Bemmel, 2005; Hönig et al., 2006; Schartmann et al., 2008), which is expected from considerations of grain survival in the circumnuclear environment (Krolik & Begelman, 1988) and whose existence is suggested by interferometric observations of the Circinus galaxy (Tristram et al., 2007). In a clumpy torus, cool dust may be present close to the central engine. Nenkova et al. (2008b) find that in certain circumstances a clumpy torus can produce silicate emission features even for lines of sight close to the equatorial plane, especially if the optical depth per cloud or if the number of clouds along the line of sight is as low as . The silicate emission in type 2 AGN could therefore come from either the NLR or the torus.
While Spitzer’s excellent sensitivity is well suited to discovering silicate emission in AGN, its spatial resolution cannot pinpoint the location of the emitting dust. Ground-based mid-IR spectra of NGC 1068 show that spatial resolution is critical: the depth and profile of the silicate feature vary considerably on sub-arcsecond (70 pc) scales (Mason et al., 2006; Rhee & Larkin, 2006). Beyond that work, the spectral properties of the small-scale extended MIR emission have been explored in only a handful of Seyfert galaxies (Roche et al., 2006, 2007; Young et al., 2007). A detailed dissection of the nuclear regions is necessary to establish how — if at all — these results fit within AGN unified schemes.
At a distance of 32 Mpc ( km sec-1 Mpc-1; 1″=150 pc), NGC 2110 is the nearest known type 2 AGN (Bradt et al., 1978; McClintock et al., 1979) with silicate emission (Shi et al., 2006), and is unique in being both bright enough for ground-based mid-IR spectroscopy, and close enough for spatial resolution of a few 10 parsecs to be attainable. To investigate the nature and location of the region(s) giving rise to silicate emission in active galaxies, we present ground-based and Spitzer mid-IR imaging and spectroscopy of the nucleus of NGC 2110.
2 Observations
N band spectroscopy and an imaging observation in the 11.2 m N′ filter (m, 50% cut-on/off) were acquired using Michelle (Glasse et al., 1997), the mid-IR imager/spectrograph on the Gemini North telescope, on 20070318 and 20070320111Program ID: GN-2007A-Q-49. Conditions were clear and dry (PWV 1 mm) on both nights and a standard chop-nod observing scheme was employed for both imaging and spectroscopy. The 2-pixel (0.36″) slit was used, giving spectral resolution and spectral coverage of the whole N band atmospheric window. The slit was oriented at 160, approximately along the inner ionization cones of the galaxy (Pogge, 1989; Mulchaey et al., 1994). Because of an instrumental problem at the time of the observation, the galaxy was not optimally centered in the slit. Nonetheless, an adequate signal-to-noise ratio was achieved and the pointlike nature of the nucleus (below) means that the conclusions of this work are not affected. On-source exposure times were 1200 sec for the spectroscopy and 150 sec for the imaging.
The galaxy appears pointlike in the short imaging observation, with FWHM0″.42 (comparable to the FWHM of the photometric standard star) and radial profile well fit with a Moffat profile. There is no evidence of significant low-level extended emission in the smoothed data, implying that the Michelle spectrum represents the unresolved nuclear source. The total flux density of the nuclear point source was measured to be 286 mJy; variable atmospheric transmission in the mid-IR means that this value is likely accurate to 10%. The Michelle photometry agrees with the IRS spectrum (Fig. 1; Shi et al. 2006; Gorjian et al. 2009, in prep) to within the uncertainties 222IRS spectroscopic flux calibration is accurate to 5-10%; IRS Data Handbook, version 3.1.
Initial IRAF processing of the Michelle spectra involved combination of the chop- and nod-subtracted data, and use of a median subtraction algorithm to remove channel-channel offsets and low-level vertical striping. The spectrum was optimally extracted using the Starlink Figaro package and wavelength calibrated using sky emission lines in the raw frames. The galaxy spectrum was then divided by the spectrum of a G8III star (HR1784) to cancel telluric absorption lines, multiplied by a 4960 K blackbody curve, and flux calibrated using the imaging data.
3 Results and discussion
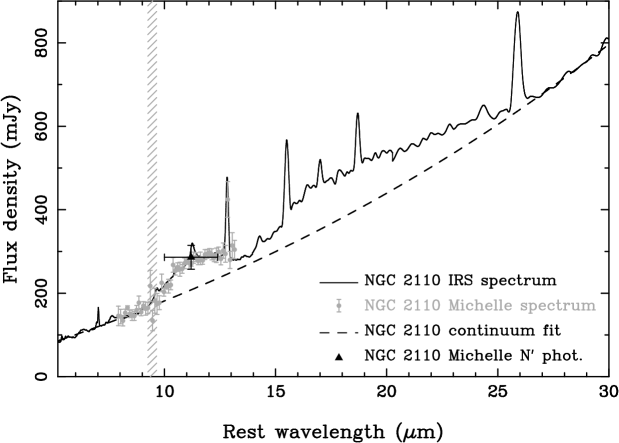
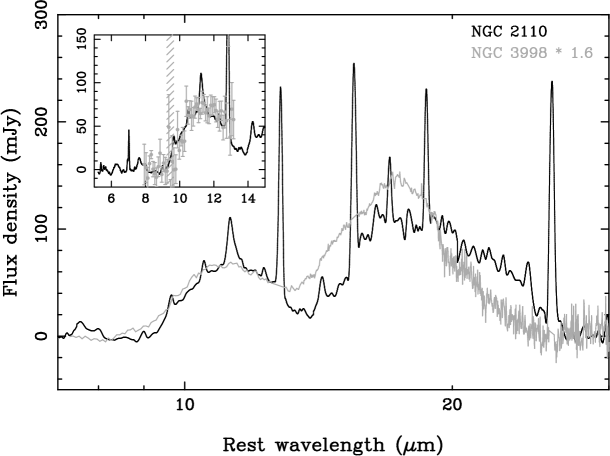
The Michelle and IRS data on NGC 2110 are presented in Fig. 1, with continuum-subtracted spectra in Fig. 2. The continuum shown in Fig. 1 is a spline fit to the IRS spectrum at 5 - 9 m and 24 - 30 m. Although fitting only to the extremes of the spectrum may exaggerate the strength of the silicate emission (Sirocky et al., 2008), we use this fit for ease of comparison with previous work. The same continuum was also subtracted from the Michelle spectrum after a slight scaling to match the flux density in that spectrum.
Outside the 11.3 m PAH band, the 8-13 m spectral region changes very little between the Michelle and IRS spectra; the flux densities of the continuum and silicate emission in the Michelle and IRS spectra agree to within the uncertainties (§2). The similarity of the strength and profile of the 10 m silicate feature in both spectra implies that the silicate emission in NGC 2110 arises within the point source detected in the ground-based imaging, whose FWHM 63 pc. At that distance the emission could arise in the torus itself, whose outer radius is thought to be no more than a few pc (Jaffe et al., 2004; Packham et al., 2005; Tristram et al., 2007), or in the inner part of the narrow line region, which extends to pc in the optical (Mulchaey et al., 1994). The compactness of the emission argues against an origin in mass-losing evolved stars, as detected in Virgo cluster galaxies (Bressan et al., 2006).
Fig. 2 also shows the silicate features in the LINER/type 1 Seyfert galaxy, NGC 3998 (Sturm et al., 2005). The features in NGC 3998 are weaker than those in NGC 2110 but the profiles and peak wavelengths of their 10 m bands are quite similar. However, the 18 m feature in NGC 2110 is weaker relative to the 10 m band than in NGC 3998, and NGC 2110 exhibits a more pronounced red wing on the 18 m feature. In this respect, NGC 2110 bears more resemblance to the QSOs in Hao et al. (2005), which also have strong red wings to their 18 m bands. The peak height of the 18 m feature is sensitive to the choice of continuum, but other reasonable continuum fits give similar 10 m profiles and also show the red wing on the 18 m band. The properties (profiles, peak wavelengths and relative strengths) of the silicate bands in NGC 2110 lie within the range exhibited by other AGN with silicate emission features. Sturm et al. (2005) note that the 10 m band in NGC 3998 is broadened and shifted to longer wavelengths than in the Galactic ISM, and discuss grain size and composition effects that could explain the observed spectrum. The similarity of the 10 m band in NGC 2110 to that in NGC 3998 suggests that such grain processing may also be at work in this Seyfert 2 nucleus.
Schweitzer et al. (2008) have modeled silicate emission arising from dust in the NLR of PG QSOs. The distance to the dust giving rise to the feature depends on various model parameters (e.g. NLR density, extinction), but on average , where and is in units of . For the silicate-emitting dust to be 32 pc from the nucleus would require . No 5100 continuum luminosity is available for NGC 2110, but Moran et al. (2007) find based on the extinction-corrected [OIII] 5007 line. This implies , consistent with the constraint on the distance to the silicate emitting dust imposed by the comparison of the Michelle and IRS data. This distance is clearly much smaller than the optical size of the NLR in NGC 2110, an observation also noted for their PG QSO sample by Schweitzer et al., who suggest that the silicate-emitting dust may be associated with highly ionised gas in the innermost regions of the NLR.
The calculations of Schweitzer et al. (2008) demonstrate that the silicate emission in AGN may arise in the NLR, but they do not rule out that some or all of it could be produced by dust in the torus (and there need not in fact be a physical difference between the outer edge of a clumpy torus and the beginning of the NLR). For clumpy tori, Nenkova et al. (2008b) find that if the optical depth per cloud or if the number of clouds along the line of sight is , a silicate feature can be produced even for lines of sight close to the equatorial plane.
We fit the clumpy torus models of Nenkova et al. (2008a) to the MIR spectra of NGC 2110. In these radiative transfer computations, the individual clouds have a fixed optical depth. The additional parameters detail the distribution of the clouds. They are radially distributed according to a power law, , from the dust sublimation radius, to an outer radius , which we parameterize with . The torus has width parameter with a Gaussian edge. The average number of clouds along an equatorial ray is . The number along a given line of sight declines with altitude, with along angle from the equator, and the emergent reprocessed emission is calculated for all viewing angles, .
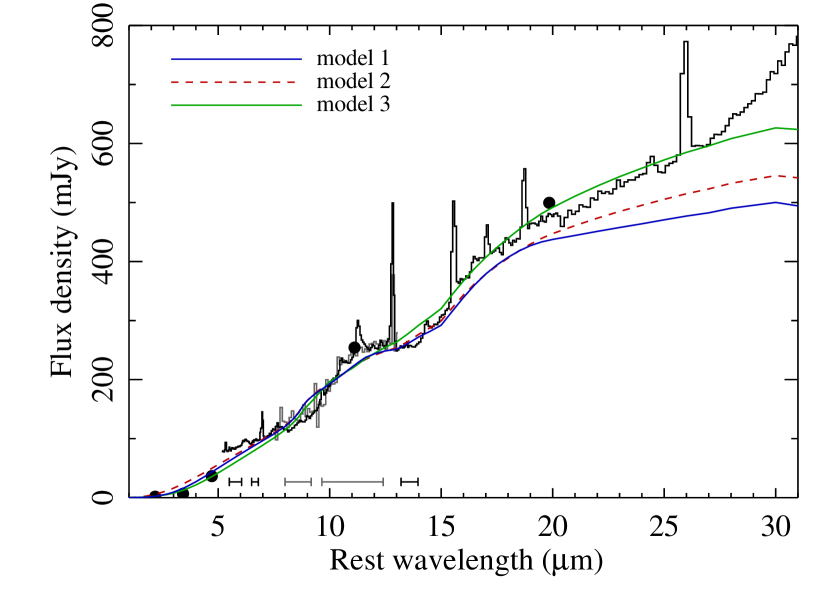
We fit only the MIR continuum, using the relatively line-free Michelle spectrum from 8 to 12.5 m (except the ozone region) and the IRS spectrum in regions indicated in Fig. 3. Because of uncertainties in starlight subtraction (Alonso-Herrero et al., 1996) and the possible variability of this object in the NIR (Lawrence et al., 1985), we do not fit the photometric data points. Neither do we fit to the LL spectrum of NGC 2110; although most of the 11.2 m flux arises in a source with FWHM0.42″, contributions from extended emission may become significant at longer wavelengths.
We allow all the model parameters to be free. One disadvantage of the models is that they are highly degenerate. Concentrating on the MIR, where only the clouds close to the AGN (within ) are relevant, a number of different models produce similar fits and spectral shapes. The total cloud distribution determines the MIR emission, so various combinations of total number of clouds, outer extent, and radial profile produce similar spectra. The best-fitting models all have near-equatorial views through the torus, which has a small width parameter. The inclination of the torus is driven by the NIR/MIR ratio in the data; more face-on models cannot fit the short end of the IRS spectrum without predicting less 14 m emission than is observed. Larger tori may produce a slightly lower NIR/MIR ratio (Nenkova et al., 2008b) but large tori are inconsistent with high resolution observations (Jaffe et al., 2004; Tristram et al., 2007, although see Kishimoto et al. 2009 for contrary evidence).
We plot the formally best-fitting model (“model 1”) in Figure 3, which has , , , , , and . A similar model (“model 2”) changes to 10 and to . The tori have smaller opening angles than required by the unified model to explain the relative numbers of types 1/2 AGN. However, slender tori are suggested by the disk-like broad line region (BLR) which is detected in polarized light (Moran et al., 2007). The apparent scarcity of type 2 AGN with silicate emission may also indicate that these objects are outliers in terms of torus properties. A somewhat different solution (“model 3”) has fewer clouds along a given line of sight, and the torus covers a larger angular extent (, , , , , and ). All these models obscure the central engine, with – along the line of sight, assuming a standard gas-to-dust ratio. This is within a factor of a few of that estimated by most authors (Malaguti et al., 1999; Risaliti, 2002; Evans et al., 2007)
The vertical scaling is a free parameter and sets the bolometric luminosity of the model source. We find , 3, and 0.7 in models 1, 2, and 3, respectively. These values are roughly consistent with the estimated from [OIII] 5007 (Moran et al., 2007). In all cases, the silicate-emitting region is small. For a standard AGN heating spectrum and a dust sublimation temperature of 1500 K, pc. Thus, the outer extent of the torus we model, at , is 8 pc.
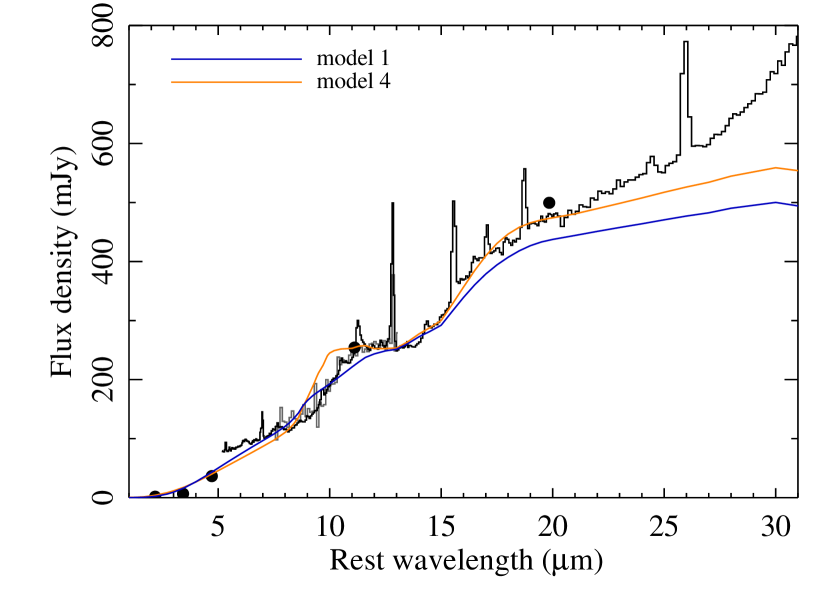
One problem with all these models is that they fail to capture the steep rise of the silicate feature longward of 10 m. The wavelength of the silicate peak is a function of the dust composition. All the models we present use the cold astronomical silicate of Ossenkopf et al. (1992), which has a maximum optical depth at 10.0 m. We do not experiment with alternate dust compositions, but we do demonstrate in Figure 4 that even an obscured AGN may exhibit strong silicate emission. “Model 4” is similar to models 1 and 2, with a slender torus (). The primary difference is that it contains fewer clouds along radial rays, but with nearly equatorial viewing () and , the average line-of-sight optical depth is still . Although this model is formally a poor fit, it has the advantage that the shape of the 10 m silicate feature does not show the “double-peaked,” self-absorbed structure seen in models 1–3. The dust composition determines the shape and strength of the silicate feature, while variations of the grain size affect the relative extinction of the continuum. A distribution favoring large grains does not alter these models significantly. Favoring small grains corresponds to smaller values of for the same silicate strength and profile. The NIR extinction is then reduced relative to the MIR, so the preference for edge-on views remains robust.
To summarize, these observations permit us for the first time to set tight limits (r32 pc) on the size of the silicate-emitting region in a Seyfert galaxy. This indicates that any silicate emission from the NLR must arise in its innermost regions. Alternatively, the silicate emission could come from the torus: we show that clumpy torus models give a reasonable fit to the silicate emission and the 2-20 m SED, while at the same time obscuring the BLR. We emphasize that in the context of a clumpy torus the distinction of the transition from the outer torus to the inner NLR is more semantic than physical. Simultaneous modeling of emission lines and silicate emission from the NLR, as proposed by Schweitzer et al. (2008), may further illuminate the origin of the silicate emission features. Measurements on small spatial scales remain essential to identify the emitting structures in the cores of active galaxies.
References
- Alonso-Herrero et al. (1996) Alonso-Herrero, A., Ward, M. J., & Kotilainen, J. K. 1996, MNRAS, 278, 902
- Antonucci & Miller (1985) Antonucci, R. R. J., & Miller, J. S. 1985, ApJ, 297, 621
- Bock et al. (2000) Bock, J. J., Neugebauer, G., Matthews, K., Soifer, B. T., Becklin, E. E., Ressler, M., Marsh, K., Werner, M. W., Egami, E., & Blandford, R. 2000, AJ, 120, 2904
- Bradt et al. (1978) Bradt, H. V., Burke, B. F., Canizares, C. R., Greenfield, P. E., Kelley, R. L., McClintock, J. E., Koski, A. T., & van Paradijs, J. 1978, ApJ, 226, L111
- Bressan et al. (2006) Bressan, A., Panuzzo, P., Buson, L., Clemens, M., Granato, G. L., Rampazzo, R., Silva, L., Valdes, J. R., Vega, O., & Danese, L. 2006, ApJ, 639, L55
- Dullemond & van Bemmel (2005) Dullemond, C. P., & van Bemmel, I. M. 2005, A&A, 436, 47
- Efstathiou & Rowan-Robinson (1995) Efstathiou, A., & Rowan-Robinson, M. 1995, MNRAS, 273, 649
- Evans et al. (2007) Evans, D. A., Lee, J. C., Turner, T. J., Weaver, K. A., & Marshall, H. L. 2007, ApJ, 671, 1345
- Glasse et al. (1997) Glasse, A. C., Atad-Ettedgui, E. I., & Harris, J. W. 1997, in Proc. SPIE Vol. 2871, p. 1197-1203, Optical Telescopes of Today and Tomorrow, Arne L. Ardeberg; Ed., 1197–1203
- Gorjian et al. (2004) Gorjian, V., Werner, M. W., Jarrett, T. H., Cole, D. M., & Ressler, M. E. 2004, ApJ, 605, 156
- Granato & Danese (1994) Granato, G. L., & Danese, L. 1994, MNRAS, 268, 235
- Hao et al. (2005) Hao, L., Spoon, H. W. W., Sloan, G. C., Marshall, J. A., Armus, L., Tielens, A. G. G. M., Sargent, B., van Bemmel, I. M., Charmandaris, V., Weedman, D. W., & Houck, J. R. 2005, ApJ, 625, L75
- Hao et al. (2007) Hao, L., Weedman, D. W., Spoon, H. W. W., Marshall, J. A., Levenson, N. A., Elitzur, M., & Houck, J. R. 2007, ApJ, 655, L77
- Hönig et al. (2006) Hönig, S. F., Beckert, T., Ohnaka, K., & Weigelt, G. 2006, A&A, 452, 459
- Jaffe et al. (2004) Jaffe, W., Meisenheimer, K., Röttgering, H. J. A., Leinert, C., Richichi, A., Chesneau, O., Fraix-Burnet, D., Glazenborg-Kluttig, A., Granato, G.-L., Graser, U., Heijligers, B., Köhler, R., Malbet, F., Miley, G. K., Paresce, F., Pel, J.-W., Perrin, G., Przygodda, F., Schoeller, M., Sol, H., Waters, L. B. F. M., Weigelt, G., Woillez, J., & de Zeeuw, P. T. 2004, Nature, 429, 47
- Krolik & Begelman (1988) Krolik, J. H., & Begelman, M. C. 1988, ApJ, 329, 702
- Lawrence et al. (1985) Lawrence, A., Ward, M., Elvis, M., Fabbiano, G., Willner, S. P., Carleton, N. P., & Longmore, A. 1985, ApJ, 291, 117
- Malaguti et al. (1999) Malaguti, G., Bassani, L., Cappi, M., Comastri, A., di Cocco, G., Fabian, A. C., Palumbo, G. G. C., Maccacaro, T., Maiolino, R., Blanco, P., Dadina, M., dal Fiume, D., Frontera, F., & Trifoglio, M. 1999, A&A, 342, L41
- Mason et al. (2006) Mason, R. E., Geballe, T. R., Packham, C., Levenson, N. A., Elitzur, M., Fisher, R. S., & Perlman, E. 2006, ApJ, 640, 612
- McClintock et al. (1979) McClintock, J. E., Remillard, R. A., Canizares, C. R., Veron, P., & van Paradijs, J. 1979, ApJ, 233, 809
- Moran et al. (2007) Moran, E. C., Barth, A. J., Eracleous, M., & Kay, L. E. 2007, ApJ, 668, L31
- Mulchaey et al. (1994) Mulchaey, J. S., Wilson, A. S., Bower, G. A., Heckman, T. M., Krolik, J. H., & Miley, G. K. 1994, ApJ, 433, 625
- Nenkova et al. (2002) Nenkova, M., Ivezić, Ž., & Elitzur, M. 2002, ApJL, 570, L9
- Nenkova et al. (2008a) Nenkova, M., Sirocky, M. M., Ivezic, Z., & Elitzur, M. 2008a, ArXiv e-prints, 806
- Nenkova et al. (2008b) Nenkova, M., Sirocky, M. M., Nikutta, R., Ivezic, Z., & Elitzur, M. 2008b, ArXiv e-prints, 806
- Ossenkopf et al. (1992) Ossenkopf, V., Henning, T., & Mathis, J. S. 1992, A&A, 261, 567
- Packham et al. (2005) Packham, C., Radomski, J. T., Roche, P. F., Aitken, D. K., Perlman, E., Alonso-Herrero, A., Colina, L., & Telesco, C. M. 2005, ApJL, 618, L17
- Pier & Krolik (1992) Pier, E. A., & Krolik, J. H. 1992, ApJ, 401, 99
- Pogge (1989) Pogge, R. W. 1989, ApJ, 345, 730
- Radomski et al. (2003) Radomski, J. T., Piña, R. K., Packham, C., Telesco, C. M., De Buizer, J. M., Fisher, R. S., & Robinson, A. 2003, ApJ, 587, 117
- Rhee & Larkin (2006) Rhee, J. H., & Larkin, J. E. 2006, ApJ, 640, 625
- Risaliti (2002) Risaliti, G. 2002, A&A, 386, 379
- Roche et al. (1991) Roche, P. F., Aitken, D. K., Smith, C. H., & Ward, M. J. 1991, MNRAS, 248, 606
- Roche et al. (2007) Roche, P. F., Packham, C., Aitken, D. K., & Mason, R. E. 2007, MNRAS, 375, 99
- Roche et al. (2006) Roche, P. F., Packham, C., Telesco, C. M., Radomski, J. T., Alonso-Hererro, A., Aitken, D. K., Colina, L., & Perlman, E. 2006, MNRAS, 258
- Schartmann et al. (2008) Schartmann, M., Meisenheimer, K., Camenzind, M., Wolf, S., Tristram, K. R. W., & Henning, T. 2008, A&A, 482, 67
- Schweitzer et al. (2008) Schweitzer, M., Groves, B., Netzer, H., Lutz, D., Sturm, E., Contursi, A., Genzel, R., Tacconi, L. J., Veilleux, S., Kim, D.-C., Rupke, D., & Baker, A. J. 2008, ApJ, 679, 101
- Shi et al. (2006) Shi, Y., Rieke, G. H., Hines, D. C., Gorjian, V., Werner, M. W., Cleary, K., Low, F. J., Smith, P. S., & Bouwman, J. 2006, ApJ, 653, 127
- Siebenmorgen et al. (2005) Siebenmorgen, R., Haas, M., Krügel, E., & Schulz, B. 2005, A&A, 436, L5
- Sirocky et al. (2008) Sirocky, M. M., Levenson, N. A., Elitzur, M., Spoon, H. W. W., & Armus, L. 2008, ApJ, 678, 729
- Sturm et al. (2006) Sturm, E., Hasinger, G., Lehmann, I., Mainieri, V., Genzel, R., Lehnert, M. D., Lutz, D., & Tacconi, L. J. 2006, ApJ, 642, 81
- Sturm et al. (2005) Sturm, E., Schweitzer, M., Lutz, D., Contursi, A., Genzel, R., Lehnert, M. D., Tacconi, L. J., Veilleux, S., Rupke, D. S., Kim, D.-C., Sternberg, A., Maoz, D., Lord, S., Mazzarella, J., & Sanders, D. B. 2005, ApJ, 629, L21
- Teplitz et al. (2006) Teplitz, H. I., Armus, L., Soifer, B. T., Charmandaris, V., Marshall, J. A., Spoon, H., Lawrence, C., Hao, L., Higdon, S., Wu, Y., Lacy, M., Eisenhardt, P. R., Herter, T., & Houck, J. R. 2006, ApJ, 638, L1
- Tristram et al. (2007) Tristram, K. R. W., Meisenheimer, K., Jaffe, W., Schartmann, M., Rix, H.-W., Leinert, C., Morel, S., Wittkowski, M., Röttgering, H., Perrin, G., Lopez, B., Raban, D., Cotton, W. D., Graser, U., Paresce, F., & Henning, T. 2007, A&A, 474, 837
- Young et al. (2007) Young, S., Packham, C., Mason, R. E., Radomski, J. T., & Telesco, C. M. 2007, MNRAS, 378, 888