2008 \SetConfTitleA Long Walk Through Astronomy: A Celebration of Luis Carrasco’s 60th Birthday
The energetic environment and the dense interstellar medium in ULIRGs
Abstract
We fit the near-infrared to radio spectral energy distributions of a sample of 30 luminous and ultra-luminous infrared galaxies with models that include both starburst and AGN components. The aim of the work was to determine important physical parameters for this kind of objects such as the optical depth towards the luminosity source, the star formation rate, the star formation efficiency and the AGN fraction. We found that although about half of our sample have best-fit models that include an AGN component, only 30% have an AGN which accounts for more than 10% of the infrared luminosity whereas all have an energetically dominant starburst. Our models also determine the mass of dense molecular gas. Assuming that this mass is that traced by the HCN molecule, we reproduce the observed linear relation between HCN luminosity and infrared luminosity found by Gao & Solomon (2004). However, our derived conversion factor between HCN luminosity and the mass of dense molecular gas is a factor of 2 smaller than that assumed by these authors. Finally, we find that the star formation efficiency falls as the starburst ages.
Presentamos los ajustes a la distribución espectral de energía, desde el cercano-infrarrojo hasta radio, de 30 galaxias luminosas y ultraluminosas en el infrarrojo con modelos que incluyen formación estelar (SB) y actividad nuclear (AGN). La motivación de este trabajo fue determinar importantes parámetros físicos para esta clase de objetos, como son: la profundidad óptica hacia la fuente infrarroja, el ritmo y la eficiencia de la formación estelar y la contribución del AGN. Encontramos que, aunque la mitad de la muestra necesita modelos combinados (i.e. AGN+SB), solo el 30% necesitó un AGN contribuyendo más del 10% a la luminosidad infrarroja. En todos los casos la contribución del SB es dominante. De nuestros modelos también pudimos obtener la masa de gas molecular denso. Si asumimos que esta masa es la misma que la que es trazada por la molécula de HCN, podemos reproducir la relación lineal entre la luminosidad de HCN y la masa de gas denso observada por Gao y Solomon (2004). Sin embargo, el factor de conversión entre la luminosidad de HCN y la masa de gas denso que derivamos es un factor 2 menor que el asumido por estos autores. Por último, también encontramos que la eficiencia de la formación estelar disminuye a medida que el brote de formación estelar envejece.
Ulirgs \addkeywordISM: dust extinction \addkeywordGalaxies: active \addkeywordInfrared: galaxies
0.1 Introduction
With total infrared luminosities between L⊙ and L⊙, respectively, Luminous and Ultraluminous Infrared galaxies, (U)LIRGs, are the most luminous objects in the local universe. Although scarce at low redshift, they may account for the bulk of all star formation activity at and dominate the far-infrared background (e.g. Blain et al. 2002). Many of them are found in merging systems (e.g. Sanders et al. 1988), suggesting that dynamical interaction has driven gas towards the nucleus, fueling a massive starburst (SB) and/or the central massive black hole (Mihos & Hernquist 1996). Despite extensive investigation over the last decades, there is still considerable uncertainty as to the nature of their power source. In order to analyze the power mechanism in these sources, tracers that do not suffer large extinction have been preferred recently, such as hard X-rays, and MIR to radio diagnostics. The weakness of the hard X-ray luminosity seen in most ULIRGs have been interpreted by Risaliti et al. (2006) as a real lack of AGN activity. MIR diagnostics such as the strengths of PAH emissions, the 9.7m absorption feature, the high ionization lines, and the MIR continuum slope indicate that the starburst is dominant in about 80% of ULIRGs. However, there are strong discrepancies in the results obtained with the different methods (e.g. Armus et al. 2007). This is in line with the recent finding that the strength of PAHs and the shape of the mid-infrared continuum cannot be safely used to disentangle AGN and SB contributions (Vega et al. 2005, Weedman et al. 2005). In the radio domain, the most direct way of distinguishing between AGN and starburst power sources in ULIRGs is to search for very compact radio continuum emission towards the nuclei. Nagar et al. (2003), by using 15 GHz radio continuum data with a resolution of 150 mas, concluded that most of the 83 ULIRGs of their sample are AGN powered. However, Smith et al. (1998) detected radio-SNe in the NW nucleus of Arp 220 in a region of and concluded that no AGN is necessary to explain the IR luminosity in this source.
We followed a different approach to examine the energetic environment in (U)LIRGs. Instead of considering a single spectral region, we base our study on the thorough analysis of the panchromatic spectral energy distribution (SED). Thus, we first determine the observed NIR - radio SED of a sample of 30 local (U)LIRGs and then, these data are compared with suitable models with SB and AGN components.
A Similar approach has been adopted by Farrah et al. (2003). They used SB and AGN templates to model the SED from the optical-submm range. We prefer to use models built on well calibrated star forming complexes instead of templates re-scaled to different luminosities because it avoids the dubious process of ”re-scaling” a ”template” to another luminosity, and because the use of models gives access to a more sound physical picture of the environment within which such objects evolve, that can be used for the study of even more extreme phases such as those likely found at high redshift (e.g. Mortier et al. 2005), which is one of the ultimate goals of the present investigation. We excluded from the analysis the optical data because, due to the large extinction, they are likely dominated by the underlying old stellar population and not by the starburst (e.g. Farrah et al. 2001). In contrast, the inclusion of radio data in the analysis gives us an independent constraint on the SB strength and age (Bressan, Silva & Granato 2002).
6
| ageb | r | |||||
|---|---|---|---|---|---|---|
| Myr | Myr | Myr | kpc | |||
| 5-80 | 1-315 | 1-2 | 5-80 | 9-180 | .1-.9 | 0.01-1 |
0.2 Sample
The selection criteria for our sample of 30 (U)LIRGs are summarized as follows: (a) The galaxies are compact (U)LIRGs from Condon et al. (1991) (i.e. brighter than at ) with radio data at 3 or more frequencies. (b) We also require the galaxies to have a well-sampled infrared SED, with data in the NIR, MIR and FIR spectral ranges. For all the sources of our sample we collected NIR data from the 2MASS All-Sky Extended Source Catalog and IRAS data from IRSA and NED, respectively. Radio data were taken from Clemens et al. (2008). Additional IR and sub-mm broad-band data were taken from the literature. We also found Spitzer IRS spectra in the SSC archive for eleven objects of our sample. Our objects are compact and isolated so that we are confident that our fluxes sample the entire starburst in all cases.
0.3 Models
In order to find the best fit model we adopt the following approach: we first test the null-hypothesis that our sample sources are pure SB. Then, if the observed SED shows an excess emission over the best fit in those wavelength regions that are more affected by the presence of an embedded AGN, typically in the NIR-FIR range, we reject the null-hypothesis and add an AGN component to the model. The AGN model is selected from a library generated with the radiative transfer code developed by Granato & Danese (1994) and added to the SB model in such a way that the total luminosity is
| (1) |
Notice that in this work our aim is just to assess the possible contribution of the warm AGN component to the total SED of ULIRGs, without any pretense of discriminating the precise AGN properties. The best fit is obtained by minimizing the merit function, , calculated as
| (2) |
where , , and are the model flux values, the observed fluxes and observational errors respectively. is the number of passbands used for the fit.
The SB models are selected from a library generated with GRASIL111GRASIL can be run via the WEB interface web.pd.astro.it/galsynth/ which is maintained at OAPD, INAF by L. Paoletti, A. Petrella & D. Selvestrel, and can also be downloaded from the webpage http://adlibitum.oats.inaf.it/silva/default.html (Silva et al. 1998) and involve seven main free parameters: the e-folding time and age of the burst, and , the sub-mm dust spectral index, , the escape time, , the molecular cloud (MC) optical depth at 1 m, , the fraction of gas in MCs, , and the core radius of the King profile for the dust-star distributions, . The range of values of these free parameters are listed in Table 1. For a complete description of models we refer the reader to Vega et al. (2008) and references therein.
0.4 Results and Conlusions
12 NAME log() r SFR LAGN/LIR (Myr) (yr) (Myr) (kpc) () (M⊙) Mrk 231∗ 35 7.572 2.00 26 33.13 0.65 0.40 1.07 436 10.1 16 IR 14348-1447 10 7.170 1.95 14 49.09 0.26 0.27 1.48 336 9.9 8 IR 12112+0305 25 6.880 2.00 7 45.80 0.35 0.20 0.30 503 10.0 – IR 05189-2524∗ 10 6.750 2.00 6 27.37 0.40 0.65 0.56 226 9.6 17 Arp 220∗ 35 7.340 1.80 20 64.93 0.14 0.55 0.62 235 9.8 – IR 08572+3915∗ 7 6.590 2.00 3 64.93 0.95 0.25 0.56 130 9.1 UGC 8696∗ 20 7.650 1.95 37 56.72 0.20 0.37 2.23 138 9.7 IR 15250+3609∗ 20 7.289 2.00 16 53.66 0.47 0.70 0.97 154 9.4 IR 10565+2448∗ 45 7.910 2.00 60 47.43 0.29 0.14 1.80 116 9.7 – UGC 5101∗ 7 7.440 1.95 22 50.85 0.18 0.20 3.93 71 9.8 1 IZW 107 30 7.770 2.00 40 33.13 0.17 0.27 1.96 87 9.5 – IR 01364-1042 10 7.290 2.00 14 116.1 0.53 0.50 1.95 92 9.4 IR 10173+0828 40 7.200 2.00 14 42.22 0.27 0.41 0.41 110 9.4 – Arp 299 25 7.756 2.00 43 31.75 0.17 0.70 2.28 67 9.4 – UGC 4881 40 7.986 2.00 44 49.97 0.22 0.20 2.42 54 9.4 – CGCG 436-30∗ 15 7.500 2.00 24 45.09 0.15 0.60 2.11 58 9.2 IC 1623 25 7.635 1.80 24 39.63 0.17 0.51 1.73 65 9.4 – NGC 1614 20 7.840 2.00 50 33.13 0.17 0.30 3.46 29 9.1 UGC 8387∗ 20 7.720 1.95 33 63.65 0.28 0.20 2.62 43 9.5 – NGC 7469 30 7.938 2.00 45 33.13 0.16 0.43 2.89 41 9.2 UGC 2369 25 7.840 2.00 36 31.70 0.12 0.67 2.77 47 9.4 – IIIZW 35 45 7.545 1.95 35 61.20 0.18 0.55 0.78 60 9.3 – IC 5298 20 7.900 2.00 60 30.88 0.10 0.42 4.00 25 9.3 – Arp 148 20 7.735 1.80 27 75.07 0.20 0.24 2.72 37 9.4 – NGC 2623∗ 35 7.726 2.00 30 71.94 0.32 0.35 1.52 47 9.3 Mrk 331 45 7.910 2.00 35 53.66 0.14 0.70 1.80 38 9.2 NGC 34 20 7.875 2.00 65 42.23 0.14 0.45 3.75 21 9.1 NGC 5256 15 7.630 1.75 15 45.09 0.30 0.60 2.84 40 9.3 5 UGC 6436 30 7.990 1.90 34 40.89 0.05 0.37 3.25 25 9.1 – NGC 6286 10 7.640 1.80 23 94.25 0.50 0.47 4.36 14 9.3 \tabnotetextaGalaxies with an ∗ have Spitzer spectra (projects IDs 105, and 14, P.I.: J. R. Houck, and ID 30323, P.I.: L. Armus).
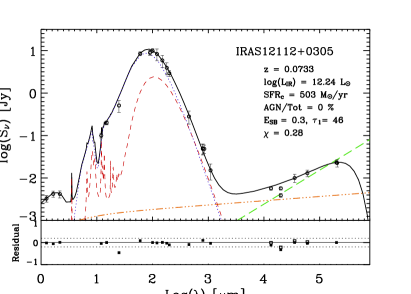
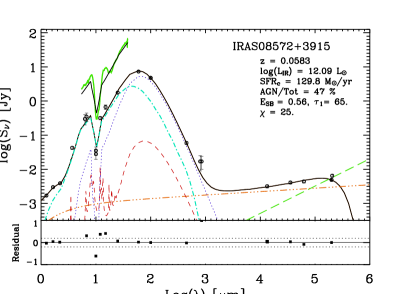
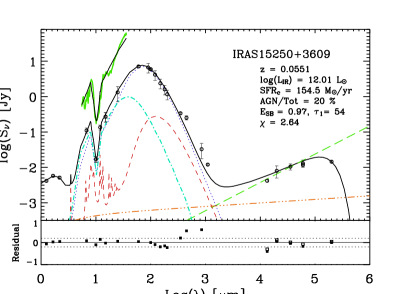
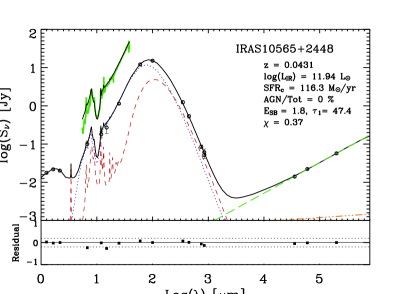
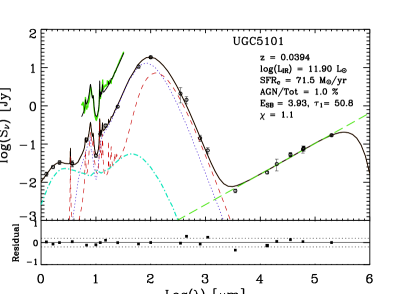
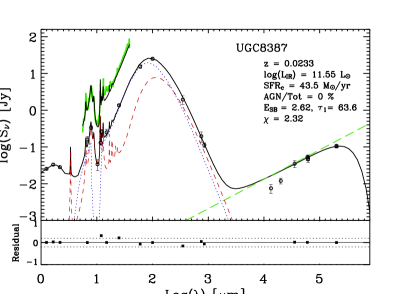
In Fig. 1 we show the SED fits for six galaxies of our sample. The corresponding best-fit parameters of the SB components for all the sample are shown in Table 2. The last four columns of the table display the value of the evolutionary phase of the SB, , the current star forming rate, SFR, the mass of the dense component, , and the fractional contribution of the AGN to the 8-1000 m flux indicated as AGN/Tot. The SED fits for all the sample can be seen in Vega et al. (2008) 222SED models and data are available in electronic form at http://www.aanda.org, and they can also be downloaded from http://www.adlibitum.oats.inaf.it/silva/default.html.. In Fig 2 we plot all the SED best-fit models of our sample of (U)LIRGs normalized to the 60 m flux density. The plot shows the large heterogeneity of (U)LIRGs SEDs. In particular, Arp 220, which is usually used as prototype of ULIRGs, has one of the most extreme SED.

0.4.1 Star formation versus AGN
The 53% of the sources show evidence for the presence of an AGN. However, only in 9/30 sources the contribution of the AGN to the total IR luminosity exceed 10%. Only one galaxy, IR 08572+3915, seems to be completely powered by an AGN. We therefore find that the fraction of SB dominated objects in our sample (i.e. pure SB galaxies and mixed galaxies with AGN contributions ) is 70%. Our measured AGN fractions are consistent with those reported by Armus et al. (2007) based on the MIR line ratios Ne[V]/Ne[II] and O[IV]/Ne[II]. But, the PAH equivalent widths and mid-infrared spectral slope overestimate (often by large factors) the AGN fraction. Therefore, our work supports the notion that neither the mid-infrared slope nor the PAH equivalent widths provide a good estimate of the AGN contribution (see conclusions in Vega et al. 2005). For two galaxies, our findings are markedly different to those of Armus et al., namely IR 14348-1447 and IR 15250+3609. For the former, we find an AGN contribution of , while they find no evidence of an AGN from the MIR analysis. Indeed, this AGN contribution is required by its red NIR colour, J-K which cannot be explained by stellar populations alone. The power source of IRAS 15250+3609 could not be determined by Armus et al., while our analysis indicates that it is a mixed object with a very obscured AGN, that contributes of the IR luminosity. This is where the combined analysis of the IRS spectra and panchromatic SED is most powerful.

0.4.2 Molecular masses
The MIR-FIR spectral region in our (U)LIRGs is dominated by the emission from the molecular clouds where the star formation is taking place. Therefore we can determine quite accurately the mass in dust associated with the star forming regions via the extinction required to reproduce the infrared part of the SED. The dust mass can be converted into molecular gas mass by using a typical dust/gas ratio (i.e. G/D =100). We find a relation between the infrared luminosity and molecular gas mass with the same slope as that derived by Gao & Solomon (2004, hereafter GS04) from observations of HCN emission, see Fig 3. However, we derived a constant of conversion between the HCN luminosity and the mass of dense molecular gas a factor of 2 smaller than that assumed by these authors for their global sample of galaxies, but in agreement with the conversion factor found by Graciá-Carpio et al. (2006) for their (U)LIRG population. Actually, an accurate determination of the conversion factor between HCN and the mass of the very dense molecular gas needs more extensive studies, including the combined analysis of the SED and the high excitation HCN transitions (Vega et al. 2009 in prep.).
0.4.3 The star formation efficiency
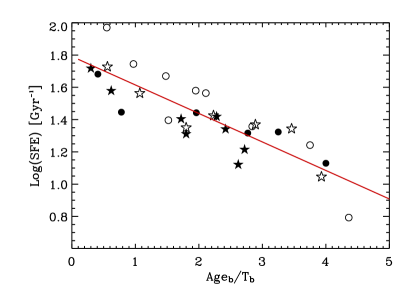
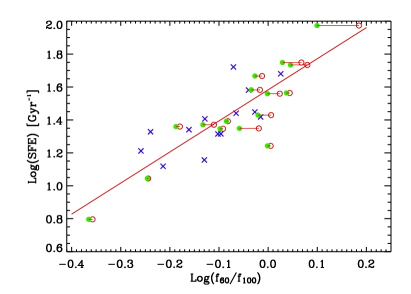
With the ratio between the SFR and the Mden, we obtain a quantity that measures the reciprocal of the SF time scale and that is usually called star formation efficiency (SFE, GS04). We do not find clear correlations between SFE and IR luminosity of the SB, or the mass of molecular gas. However we do find an evident anti-correlation between SFE and the SB phase (, see Vega et al. 2005, for a thorough discussion on the SB phases). The SFE decreases by about one order of magnitude as the SB evolves from its early phase to the more advanced phases (upper panel of Fig. 4). Such a rapid decrease of the SFE as the SB evolves suggests that feedback plays a major role in the evolution of these objects. is a quantity derived from models and it would be more desirable to put the above finding on observational grounds. Vega et al. (2005) found a tight correlation between and the FIR colour in the sense that as the SB evolves, i.e. increases, the decreases. Thus, by using the FIR colour instead of , we obtain the correlation shown in the lower panel of Fig. 4,
| (3) |
GS04 claim that the SFE is constant for all galaxies and that the star formation law in terms of dense molecular content is well represented by a power law with exponent 1.0. Instead of SFE we could have used the ratio LIR/LHCN and obtained a correlation analogous to that shown in Figure 9a of GS04. Considering only ULIRGs in that figure, a definite trend of decreasing efficiency at cooler colour, with slope , is seen. Therefore, this correlation between the observed colour and the observed SFE indicates that the variation of the SFE is real. The additional information on the evolutive phase of the SB and on the AGN contamination, allowed by a realistic modelling procedure, eliminates a large fraction of the dispersion in the SFE, found by GS04.
Acknowledgements. O.V. and M.C. acknowledge the support of the I.N.A.F. research fellowships. O.V. acknowledges the support of the INAOE. A.B., G.L.G. and L.S. acknowledge the warm hospitality of INAOE and the partial funding by the European Community by means of the Maria Curie contract MRTN-CT- 2004-503929, MAGPOP. Financial contribution from contract ASI-COFIS I/016/07/0 is also acknowledged. This work is based on data taken with the Spitzer Space Telescope, which is operated by the JPL,Caltech under a contract with NASA.
References
- Armus et al. (2007) Armus, L., et al. 2007, ApJ, 656, 148
- Blain et al. (2002) Blain, A. W., Smail, I., Ivison, R. J., Kneib, J.-P., & Frayer, D. T. 2002, Phys. Rep., 369, 111
- Bressan et al. (2002) Bressan, A., Silva, L., & Granato, G. L. 2002, A&A, 392, 377
- Clemens et al. (2008) Clemens, M. S., Vega, O., Bressan, A., Granato, G. L., Silva, L., & Panuzzo, P. 2008, A&A, 477, 95
- Condon et al. (1991) Condon, J. J., Huang, Z.-P., Yin, Q. F., & Thuan, T. X. 1991, ApJ, 378, 65
- Farrah et al. (2001) Farrah, D., et al. 2001, MNRAS, 326, 1333
- Farrah et al. (2003) Farrah, D., Afonso, J., Efstathiou, A., Rowan-Robinson, M., Fox, M., & Clements, D. 2003, MNRAS, 343, 585
- Gao & Solomon (2004) Gao, Y., & Solomon, P. M. 2004, ApJ, 606, 271, (GS04)
- Graciá-Carpio et al. (2006) Graciá-Carpio, J., García-Burillo, S., Planesas, P., & Colina, L. 2006, ApJ, 640, L135
- Granato & Danese (1994) Granato, G. L., & Danese, L. 1994, MNRAS, 268, 235
- Mihos & Hernquist (1996) Mihos, J. C., & Hernquist, L. 1996, ApJ, 464, 641
- Mortier et al. (2005) Mortier, A. M. J., et al. 2005, MNRAS, 363, 563
- Nagar et al. (2003) Nagar, N. M., Wilson, A. S., Falcke, H., Veilleux, S., & Maiolino, R. 2003, A&A, 409, 115
- Risaliti et al. (2006) Risaliti, G., et al. 2006, MNRAS, 365, 303
- Sanders et al. (1988) Sanders, D. B. et al. 1988, ApJ, 325, 74
- Silva et al. (1998) Silva, L., Granato, G. L., Bressan, A., & Danese, L. 1998, ApJ, 509, 103
- Smith et al. (1998) Smith, H. E., Lonsdale, C. J., Lonsdale, C. J., & Diamond, P. J. 1998, ApJ, 493, L17
- Vega et al. (2005) Vega, O., Silva, L., Panuzzo, P., Bressan, A., Granato, G. L., & Chavez, M. 2005, MNRAS, 364, 1286
- Vega et al. (2008) Vega, O., Clemens, M. S., Bressan, A., Granato, G. L., Silva, L., & Panuzzo, P. 2008, A&A, 484, 631
- Weedman et al. (2005) Weedman, D. W., et al. 2005, ApJ, 633, 706