Measurement of the Transverse Polarization of Electrons
Emitted in Free Neutron Decay
Abstract
Both components of the transverse polarization of electrons (, ) emitted in the -decay of polarized, free neutrons have been measured. The T-odd, P-odd correlation coefficient quantifying , perpendicular to the neutron polarization and electron momentum, was found to be 0.0080.0150.005. This value is consistent with time reversal invariance, and significantly improves limits on the relative strength of imaginary scalar couplings in the weak interaction. The value obtained for the correlation coefficient associated with , 0.0560.0110.005, agrees with the Standard Model expectation, providing an important sensitivity test of the experimental setup.
pacs:
24.80.+y, 23.40.Bw, 24.70.+s, 11.30.ErDespite the great success of the Standard Model (SM) of elementary particles and their interactions, several important questions remain open. One of these is the incomplete knowledge of physics of CP-violation, or via the CPT theorem, time reversal symmetry violation (TRV). The SM with the Cabbibo-Kobayashi-Maskawa (CKM) mixing scheme accounts for CP violation discovered in kaon Christenson et al. (1964) and B-meson Abe et al. (2002); Aubert et al. (2002) systems. It fails, however, to explain the basic observation of the dominance of matter in the present Universe. The discovery of new CP- or T-violating phenomena, especially in systems built of light quarks with vanishingly small contributions of CKM matrix induced mechanisms, would be a major breakthrough. Nuclear beta decay experiments test these systems and free neutron decay plays a particular role: due to its simplicity it is free of corrections associated with the nuclear and atomic structure. Further, final state interaction effects, which can mimic T violation, are minimal and can, in addition, be calculated with a relative precision better than 1% Vogel and Werner (1983).
In this Letter we report on the first experiment searching for the real and imaginary parts of scalar and tensor couplings via the measurement of the transverse polarization of electrons emitted in the decay of free neutrons. There exist very few measurements of this observable in general Danneberg et al. (2005); Abe et al. (2004), and only two in nuclear beta decays. One of them, for the 8Li system Huber et al. (2003), provides the most stringent limit on tensor coupling constants of the weak interaction.
According to Jackson et al. (1957), the decay rate distribution as a function of electron energy () and momentum (), from polarized neutrons is proportional to:
| (1) |
where is the neutron spin, is a unit vector onto which the electron spin is projected and is beta decay asymmetry parameter. and are correlation coefficients which, for neutron decay with the SM assumptions , , and allowing for a small admixture of scalar and tensor couplings , , , , can be expressed as:
| (2) | |||||
| (3) |
where , and is the electron mass. The correlation value vanishes to the lowest order within the SM. Including final state interactions it becomes different from zero, , still below the sensitivity of the present experiment. A larger measured value would provide a hint for the existence of exotic couplings, and a new source of TRV.
Applying the Mott polarimetry, both transverse components of the electron polarization can be measured simultaneously: perpendicular to the decay plane spanned by neutron spin and electron momentum, represented by , and contained in the decay plane and associated with . The SM value of is finite and well within reach of this experiment. Its determination provides an important sensitivity test of the experimental apparatus.
The experiment was performed at the FUNSPIN beam line at the neutron source SINQ of the Paul Scherrer Institute, Villigen, Switzerland. The detailed description of the design, operation and performance of the Mott polarimeter can be found in Ban et al. (2006); here a short overview is presented. The reported result comprises independent analyses of four data collection periods, featuring different basic conditions like beam polarization, Mott foil thickness and acquired statistics (see Table 2).
The Mott polarimeter consists of two identical modules, arranged symmetrically on both sides of the neutron beam (Fig. 1). The whole structure was mounted inside a large volume dipole magnet providing a homogeneous vertical holding field of 0.5 mT within the beam fiducial volume. An RF-spin flipper (not shown in Fig. 1) was used to reverse the orientation of the neutron beam polarization at regular time intervals, typically every 16 s. Going outwards from the beam, each module consists of a multi-wire proportional chamber (MWPC) for electron tracking, a removable Mott scatterer (1-2 m Pb layer evaporated on a 2.5 m thick Mylar foil, almost transparent to electrons from neutron decay) and a scintillator hodoscope for electron energy measurement.
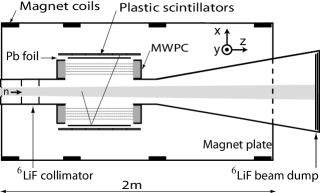
A 1 cm thick plastic scintillator allowed for the electron energy reconstruction with 33 keV FWHM resolution at 500 keV. The asymmetry of the light signal collected at both ends of the scintillator slab allowed for the determination of the vertical hit position with a resolution of about 6 cm, while the segmentation (10 cm) of the hodoscope in horizontal direction provided a crude estimate of the z-coordinate. Matching the information from the precise track reconstruction in the MWPC with that from the scintillator hodoscope considerably reduced background and random coincidences.
A 1.3 m long multi-slit collimator defined the beam cross section to 416 cm2 at the entrance of the Mott polarimeter. In order to minimize neutron scattering and capture, the entire beam volume, from the collimator to the beam dump, was enclosed in a chamber lined with 6LiF polymer and filled with pure helium at atmospheric pressure. The total flux of the collimated beam was typically about 1010 neutrons/sec. The beam divergence was 0.8∘ in horizontal and 1.5∘ in vertical direction. Thorough investigations of the beam polarization performed in a dedicated experiment Zejma et al. (2004) showed its substantial dependence on the position in the beam fiducial volume. The average beam polarization necessary for the evaluation of the - and -correlation coefficients has been extracted from the observed decay asymmetry using the precisely known beta decay asymmetry parameter Amsler et al. (2008). This approach automatically accounts for proper integration over the position dependent beam density, its polarization and detector acceptance. For this purpose single track events (only one reconstructed track segment on the hit scintillator side) have been recorded using a dedicated prescaled trigger. The main event trigger was used to find V-track candidates: events with two reconstructed segments on one side and one segment accompanied by a scintillator hit on the opposite side (Fig. 1).
To extract the beam polarization the following asymmetries were analyzed:
| (4) |
where are experimental, background corrected counts of single tracks, sorted in 4 bins of the electron velocity and 15 bins of the electron emission angle with respect to the neutron polarization direction. The sign in superscripts reflects the beam polarization direction. Background counts, i.e. number of electrons not originating from neutron decay, were determined by comparing energy spectra of two event classes: (i) the reconstructed electron direction crossed the neutron beam (“from beam”) and (ii) the electron origin was outside the neutron beam (“off beam”). The procedure relies on the assumption that the spectral shape of the background is the same for both event classes, while the characteristic neutron -decay spectrum with end-point energy of 782 keV is present only in the “from beam” class. For this assumption to hold, the “off beam” range has to be carefully chosen in both: inclination angle and extrapolated origin of the tracks on the opposite detector side Ban et al. (2006). The validity of this method was verified by comparing background-corrected energy spectra with simulated -decay spectra in which energy loss and detector resolution were taken into account.
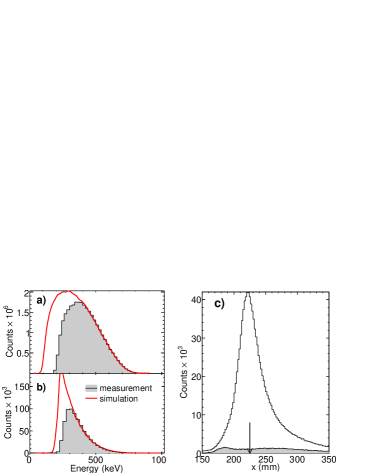
Such a comparison is shown in Fig. 2a. A similar background subtraction procedure was applied for the Mott scattering events (Fig. 2b). In the latter case the modification of the spectrum induced by the energy dependence of the Mott scattering cross section is clearly visible. Electronic thresholds are not included in the simulation — this is why the measured and simulated distributions do not match at the low energy side. The average neutron polarization values for the four data sets are collected in Table 2. The low polarization for the 2004 data set can be traced to a bug in the guiding field found post factum and verified in a dedicated experiment.
To extract the and correlation coefficients another set of asymmetries was considered:
| (5) |
where represent background-corrected experimental numbers of counts of V-track events, sorted in 12 bins of , defined as the angle between electron scattering and neutron decay planes. In the case of V-track events, beside the background discussed previously, events for which the scattering took place in the surrounding of the Mott-target provide an additional source of background. Fig. 2c presents the distribution of the reconstructed vertex positions in the -direction for data collected with and without Mott-foil. The distribution clearly peaks at the foil position. The “foil-out” distribution has been scaled appropriately by a factor deduced from the accumulated neutron beam.
It can be shown Ban et al. (2006) that:
| (6) |
where the kinematic factors , and represent the average values of the quantities , and , respectively, is the effective analyzing power of the electron Mott scattering, known in the literature as “Sherman function”, and the bar over a letter indicates event-by-event averaging. The term accounts for the -decay asymmetry induced nonuniform illumination of the Mott foil. Since the and are known precisely from event-by-event averaging, the uncertainty of this term is dominated by the error of the average beam polarization . To evaluate the influence of this term on the final result, the fit with the free parameters and was repeated with varied by one standard deviation. The obtained difference enters the budget of the systematic errors and is presented in Table 1.
| Source | ||
|---|---|---|
| term | 5 | 23 |
| effective Sherman function | 29 | 8 |
| guiding field misalignment | 3 | 6 |
| background subtraction | 46 | 53 |
| dead time variations | 8 | 0.3 |
| Total | 55 | 59 |
Mean values of the effective analyzing powers as a function of the electron energy as well as of scattering and incidence angles were calculated using the Geant 4 simulation framework Agostinelli et al. (2003), following guidelines presented in Salvat et al. (2005); Khakoo et al. (2001). This approach allows accounting properly for atomic structure, nuclear size effects as well as for the effects introduced by multiple scattering in thick foils. The accuracy of these calculations has been verified 111to be published elsewhere. by comparison with two experimental data sets: at low (120 keV Gellrich and Kessler (1991)) and high (14 MeV Sromicki et al. (1999)) electron energies.
Mapping of the spin holding magnetic field showed small nonuniformities in the beam fiducial volume. These were corrected for in the analysis. A residual systematic effect (see Table 1) was induced by the uncertainty of the field measurements.
The systematic uncertainty is dominated by effects introduced by the background subtraction procedure, connected with the choice of the geometrical cuts defining event classes “from-beam” and “off-beam”. In order to estimate this effect, the cuts were varied in a range limited solely by the geometry of the apparatus.
Since the radio–frequency of the spin flipper was a source of small noise in the readout electronics, tiny spin flipper correlated dead time variations were observed. Their influence on the result was corrected for. The residual effect is presented in Table 1.
The asymmetries as defined in Eqs. 4 and 5 have been calculated for events with energy larger than the neutron -decay end-point energy and for events originating outside the beam fiducial volume and were found to be consistent with zero within statistical accuracy. This proves that the data were not biased by, for instance, a spin flipper related false asymmetry.
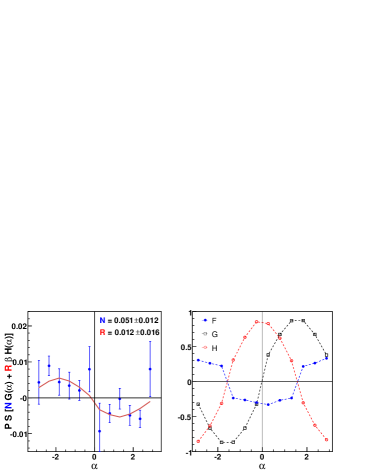
A fit of the experimental asymmetries , corrected for the term, to the experimental data set of 2007 is shown in Fig. 3. The and coefficient values extracted in this way from all data sets are listed in Table 2.
| Run | (m) | (keV) | (Eq. 7) | (Eq. 6) | ||||
|---|---|---|---|---|---|---|---|---|
| 2003 | 1 | 19000 | 80.31.31.6 | 3311.0 15 | 711 | 11010827 | 829731 | -8914338 |
| 2004 | 1 | 74000 | 44.20.41.5 | 3680.5 15 | 681 | 1449215 | 708617 | -11714026 |
| 2006 | 2 | 312000 | 80.01.01.5 | 3650.2 10 | 681 | 79327 | 86308 | -11429 |
| 2007 | 2 | 1747000 | 77.40.20.7 | 3700.1 10 | 681 | 54125 | 51126 | 12166 |
| Total | 2152000 | 59114 | 56115 | 8155 |
From the approximate symmetry of the detector with respect to the transformation it follows that , and the factors , are all symmetric while is antisymmetric function of (see Fig. 3). This allows the extraction of the coefficient from the expression Ban et al. (2006):
| (7) |
The advantage of this method is that the effect associated with the term is suppressed by a factor of about 60 as compared to Eq. 6. The good agreement between the values obtained in both ways enhances confidence in the extracted and coefficient values.
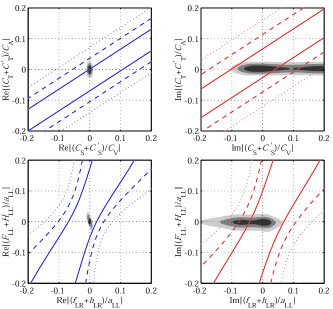
In Fig. 4 the new results have been included in exclusion plots containing all experimental information available from nuclear and neutron beta decays as surveyed in Ref. Severijns et al. (2006). The upper plots contain the normalized scalar and tensor coupling constants and (see Eq. 2), while the lower ones correspond to the helicity projection amplitudes in the leptoquark exchange model, as defined in Ref. Herczeg (2001). This is the first determination of the correlation coefficient. Although the present accuracy does not improve the already strong constraints on the real part of the couplings (left panels), the obtained result is consistent with the existing data and, in addition, adds confidence to the validity of the extraction of . As to the imaginary part (right panels), the new experimental value of the coefficient significantly constrains scalar couplings beyond the limits from all previous measurements. The result is consistent with the SM.
This work was supported in part by Polish Committee for Scientific Research under the Grant No. 2P03B11122 and by an Integrated Action Program Polonium (Contract No. 05843UJ). Part of the computation work was performed at ACK Cyfronet, Kraków. The collaboration is grateful to PSI for excellent support and kind hospitality.
References
- Christenson et al. (1964) J. H. Christenson et al., Phys. Rev. Lett. 13, 138 (1964).
- Abe et al. (2002) K. Abe et al., Phys. Rev. D66, 071102 (2002).
- Aubert et al. (2002) B. Aubert et al., Phys. Rev. Lett. 89, 011802 (2002).
- Vogel and Werner (1983) P. Vogel and B. Werner, Nucl. Phys. 404, 345 (1983).
- Danneberg et al. (2005) N. Danneberg et al., Phys. Rev. Lett. 94, 021802 (2005).
- Abe et al. (2004) M. Abe et al., Phys. Rev. Lett. 93, 131601 (2004).
- Huber et al. (2003) R. Huber et al., Phys. Rev. Lett. 90, 202301 (2003).
- Jackson et al. (1957) J. D. Jackson et al., Nucl. Phys. 4, 206 (1957).
- Ban et al. (2006) G. Ban et al., Nucl. Instrum. Methods Phys. Res., Sect. A 565, 711 (2006).
- Zejma et al. (2004) J. Zejma et al., Nucl. Instrum. Methods Phys. Res., Sect. A 539, 622 (2004).
- Amsler et al. (2008) C. Amsler et al., Phys. Lett. B667, 1 (2008).
- Agostinelli et al. (2003) S. Agostinelli et al., Nucl. Instrum. Methods Phys. Res., Sect. A 506, 250 (2003).
- Salvat et al. (2005) F. Salvat et al., Comp. Phys. Com. 165, 157 (2005).
- Khakoo et al. (2001) M. A. Khakoo et al., Phys. Rev. A 64, 052713 (2001).
- Gellrich and Kessler (1991) A. Gellrich and J. Kessler, Phys. Rev. A 43, 204 (1991).
- Sromicki et al. (1999) J. Sromicki et al., Phys. Rev. Lett. 82, 57 (1999).
- Severijns et al. (2006) N. Severijns et al., Rev. Mod. Phys. A 78, 991 (2006).
- Herczeg (2001) P. Herczeg, Prog. Part. Nucl. Phys. 46, 413 (2001).