11email: bianchin@iasfbo.inaf.it 22institutetext: INAF-Osservatorio Astronomico di Brera, via E. Bianchi 46, 23807 Merate, Italy 33institutetext: Dipartimento di Scienze, Università dell’Insubria, Como, Italy 44institutetext: George Mason University, 4400 University Drive, Fairfax, Va 22030, USA 55institutetext: INAF-Osservatorio Astronomico di Trieste, via G. B. Tiepolo 11, 34131 Trieste, Italy 66institutetext: NASA Goddard Space Flight Center, Code 661, Greenbelt, MD 20771, USA
The changing look of PKS 2149-306
Abstract
Aims. We study the blazar nature of the high-redshift Flat-Spectrum Radio Quasar PKS () by investigating its long-term behavior.
Methods. We analyzed all publicly available optical-to-X-ray observations performed by XMM-Newton, Swift, and INTEGRAL.
Results. PKS is one of four blazars at that have been observed in the hard-X-ray regime with both the BAT and ISGRI instruments. Observations acquired almost year apart in the keV energy band in the object rest frame, exhibit no noticeable change in spectral slope associated with a flux variation of more than a factor of two. Swift data appear to show a roll-off below keV, which becomes increasingly evident during a -day time-frame, that can be explained as the natural spectral break caused by the Inverse Compton onset. The broad-band spectra allow us to identify two different states. The SED modeling suggests that they can be interpreted by only a change in the bulk Lorentz factor of the jet.
Key Words.:
Quasars: general – Quasars: individual: PKS 2149-306 – X-rays: galaxies1 Introduction
PKS is a Flat Spectrum Radio Quasar (FSRQ) located at (Wilkes, 1986). In the radio maps, it exhibits a compact but non-point-like structure (e.g., Ojha et al. 2005) of Jy flux density over a wide radio frequency range ( GHz)111Data from NASA/IPAC Extragalactic Database (NED) http://nedwww.ipac.caltech.edu/index.html. The few observations of the optical counterpart show no significant changes in all filters with (e.g., Francis et al. 2000). The object hosts a bright X-ray source extensively observed in the past by ROSAT and ASCA (Siebert et al., 1996; Cappi et al., 1997), BeppoSAX (Elvis et al., 2000), Chandra (Fang et al., 2001), XMM-Newton (Ferrero & Brinkmann, 2003), and more recently by Swift (Sambruna et al., 2007). In the X-ray domain, the source exhibits a hard spectrum with variable photon index and flux. From early ASCA observations, the presence of an emission line at keV in the blazar frame was interpreted as a highly-blueshifted Fe K line produced by an outflow at speed (Yaqoob et al., 1999); however, Chandra high-resolution spectroscopy did not confirm this finding (Fang et al., 2001). Page et al. (2004) found no evidence for a disk/torus Fe K emission line.
As for other high- FSRQs, a controversial low-energy photon deficit has been claimed by some authors but not confirmed by others (Siebert et al., 1996; Cappi et al., 1997; Yaqoob et al., 1999; Sambruna et al., 2007; Elvis et al., 2000; Ferrero & Brinkmann, 2003; Page et al., 2005). This putative deficit was usually ascribed to an absorbing cloud in the quasar reference frame and modeled by additional intrinsic absorption in addition to the Galactic one. However, considering the blazar nature of PKS , it is difficult to explain how an absorbing cloud can survive in front of a jet. On the other hand, interpreting this flux deficit as a natural break in the Spectral Energy Distribution (SED) due to the low-energy tail of the electron population leads to a coherent explanation of the observed spectral changes in PKS (cf. the case of RBS , Tavecchio et al. 2007).
PKS is one of the few FSRQs observed in the hard-X-ray regime after the BeppoSAX era (Elvis et al., 2000). A recent Swift observation (Sambruna et al., 2007) confirmed that the source displays a Compton-dominated spectrum, typical of FSRQs, with a Compton peak probably located at approximately hundreds of keV (observer frame).
In this work, we present a serendipitous detection of PKS in INTEGRAL archival data. To date, the source catalog of the INTEGRAL/ISGRI detector (Lebrun et al., 2003) includes blazars, among which are located at (e.g., Bird et al. 2007). The AGN catalog of the Swift/BAT instrument (Barthelmy et al., 2005) contains comparable numbers, with high-redshift objects (Baumgartner et al., 2008). Including PKS , there are only four objects detected by both ISGRI and BAT. We performed a spectral analysis of INTEGRAL data reanalyzed all publicly available data for the source from the XMM-Newton and Swift archives. Here, we discuss the broad-band spectral variation of the source over several years.
2 Data analysis
| Instrument | ObsID | Start Date | Exposure |
|---|---|---|---|
| [YYYY-MM-DD] | [ks] | ||
| INTEGRAL/ISGRI | Rev. , | ||
| XMM/EPIC | |||
| Swift/XRT (OBS. 1) | |||
| Swift/XRT (OBS. 2) | |||
| Swift/BAT | 9-month Survey | mid Dec |
For each instrument, the table indicates the observation ID or the revolution number, the starting date of the observation, and the effective exposure for PKS . BAT data refer to the month survey, starting in mid-December . BAT exposure time is computed by integrating over all pointings with the source PKS within the FOV of the BAT instrument.
Table 1 lists all observations of PKS analyzed in this paper, including starting dates and exposure times. For all observatories, data were processed using the latest versions of the specific software and calibration files. The output spectra of XMM-Newton/EPIC and Swift/XRT were rebinned to contain at least counts per bin. Spectral analysis was carried out by means of xspec v.12.4.0. In all X-ray model fits, we included Galactic extinction and fixed the column density to be cm-2 (Kalberla et al., 2005). Our fit results are given in Table 2.
2.1 INTEGRAL
We achieved a serendipitous detection of PKS using the INTEGRAL public archive data; the source was in the IBIS (Ubertini et al., 2003) field of view during November (Revolutions , ), while pointing to NGC . Data were analyzed with the Off-line Scientific analysis Software OSA 7.0 (Courvoisier et al., 2003). The imaging analysis of IBIS/ISGRI data (Goldwurm et al., 2003) provided a source detection of signal-to-noise ratio S/N in the keV energy band with exposure of ks. The faint detections in single pointings did not allow us to inspect light curve variations. The total spectrum was extracted using a rebinned response matrix with energy bins in the energy range keV. The ISGRI spectrum can be modeled by a single power-law with photon index and flux erg cm-2 s-1 in the keV energy band (Table 2).
The source is below the capabilities of both JEM-X and PICsIT instruments, with upper limits of erg cm-2 s-1 in keV and erg cm-2 s-1 in keV respectively.
SPI data were not considered since the source NGC , the primary target of the observations, falls on the border of the instrument Point-Spread Function (PSF) ( degrees) centered on PKS .
OMC data were not included in the analysis because a contaminating source is located within the instrumental arcsec PSF FWHM of PKS (see the Swift/UVOT data analysis below).
2.2 XMM-Newton
XMM-Newton observed PKS on May , , starting at : UT (ObsID ). We reanalyzed these data, already presented by Ferrero & Brinkmann (2003). Data from EPIC-PN (Strüder et al., 2001), EPIC-MOS (Turner et al., 2001) and OM (Mason et al., 2001) were processed, screened, and analyzed using the same procedure described in Foschini et al. (2006), but with the SAS v 7.1.0 software and calibration file release of July , . No periods of high-background were detected, and the net exposures with the individual detectors were ks with PN and ks with MOS1 and MOS2.
The EPIC-PN light curve (not shown here) displays no significant flux changes ( probability of constancy ) with an upper limit to the fractional variability % ().
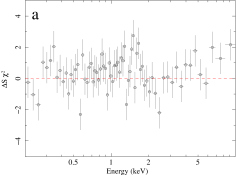
Our spectral analysis confirms the results of Ferrero & Brinkmann (2003) that the best-fit model was a single power-law function with parameters reported in Table 2. The normalization constants between the MOS instruments and PN are consistent with unity (, ). In panel a of Fig. 1, the residuals of the power-law model are plotted in units of and with error bars of size ; for a clearer visualization, only PN data are shown. We applied more complex models: a power-law function with Galactic extinction and an absorption excess in the source frame (wabs*zwabs*zpo) and an absorbed broken power-law function (wabs*bknpo). Both provided comparable values of , but the parameters were not well-constrained or they converged to unphysical quantities.
We also checked for the presence of neutral iron line emission in the quasar frame but we found no indication of such a feature (confirming Page et al. 2004).
The OM observed the blazar for s with filter (centered at nm): no detection was found, with a magnitude lower limit of (), corresponding to a flux erg cm-2 s-1.
2.3 Swift
Swift observed PKS twice in (Sambruna et al., 2007): ObsID started on December , : UT, and ObsID started on December , : UT with exposure times of ks and ks, respectively. For the reduction and analysis of the data from the three instruments onboard the Swift satellite, we used the HEASoft v. 6.4 package, together with the CALDB updated on February , .
The data from the BAT instrument (Barthelmy et al., 2005), optimized for the keV energy band, were binned, cleaned of hot pixels, and deconvolved. The intensity maps from the individual pointings were integrated by using the corresponding variance maps as a weighting factor, and the resulting exposure simultaneous to the XRT and UVOT observations was ks. No source was detected; the corresponding upper limits were erg cm-2 s-1 and erg cm-2 s-1 in the keV and keV energy band, respectively. However, the blazar was detected in the -month data survey (Tueller et al., 2008), and the source spectrum is publicly available online (Baumgartner et al., 2008). The fitting of a power-law model is optimal for a photon index of and a flux of erg cm-2 s-1 in the keV energy band.
The X-Ray Telescope (XRT, Burrows et al. 2005), operating in the keV energy band, was set to work in photon counting mode during the two pointings on PKS . Data were processed and screened by using the xrtpipeline task with the single to quadruple pixels events selected (grades ).
The spectral analysis of the XRT data was presented in Sambruna et al. (2007) as a joint fit of the two observations. Here, we consider the two data sets separately and we fit each with three models, all including Galactic extinction: a power-law (wabs*zpo), a power-law with an extra-absorption component in the source rest frame (wabs*zwabs*zpo) and a broken power-law (wabs*bknpo).
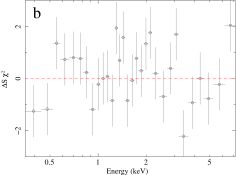
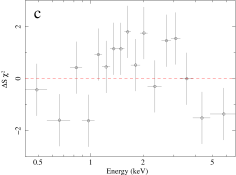
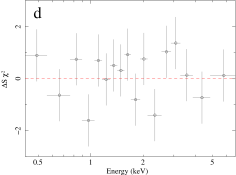
The spectrum of the first observation (--) is well described by a single power-law with Galactic absorption (Table 2). Residuals are shown in panel b of Fig. 1 (in units of ). Although the broken power-law and the power-law with extra absorption models yield (for and dof, respectively), the spectral parameters are not well constrained or they converge to unphysical values. For the second observation (--), we found that the broken power-law function provided the best-fit model, although both the power-law model and the power-law function with an extra-absorption component described the observational data accurately. In Table 2 we present the best-fit parameters for the three applied models. The residual plot of the power-law model (Fig. 1, panel c) shows a hint of curvature, which is not present when the broken power-law model is assumed (Fig. 1, panel d). The curved model is also supported by the F-test analysis, showing that the flatter power-law function below keV is required with a probability of . The quality of data acquired to date does not allow us to distinguish firmly between the intrinsically curvature (broken power-law) and the extra-absorption model.
UVOT (Roming et al., 2005) data analysis was performed by the uvotmaghist task using a source region of ” radius for the optical and ” for the UV filters. Since a contaminating source is located close to PKS , the background was evaluated from a nearby region of ” radius. The observed magnitudes were computed as the mean values of recorded data, since they do not exhibit significant variations: , , , , , and . The optical magnitudes are in accordance with values observed by Francis et al. (2000). With respect to the previous analysis of Sambruna et al. (2007), we obtain comparable magnitudes for all filters but and , for which we found an upper limit. The discrepancy is probably due to the use of updated calibration files.
2.4 Joint fits
We attempted a joint fit of the spectra provided by EPIC and ISGRI data. This is justified by the fact that the source shows a low flux level in both ISGRI and EPIC data and that the ISGRI data fall on the extrapolation of the EPIC spectrum (the normalization of the ISGRI spectrum with respect to the EPIC spectrum is ). We then argue that the blazar is in the same spectral state during the two observations, despite being separated by years. The joint fitting procedure found a single power-law function to be the best-fit model with parameters given in Table 2.
We performed a joint fit to the XRT observations and the BAT spectrum. Best-fit models are given in Table 2. We note that for the observation of -- the normalization of BAT with respect to XRT is higher than unity (): this probably reflects the flux variability of the source, given the fact that the BAT spectrum relates to data integrated over a period of 9 months. Since the XRT spectrum was retained as reference, we note that the model flux is comparable to that obtained for the EPIC+ISGRI spectrum.
3 Discussion
| X-rays ( keV) | ||||||
|---|---|---|---|---|---|---|
| Instrument | Model | or | Additional Parameters | /dof | ||
| XMM/EPIC | wabs*zpo | |||||
| Swift/XRT (OBS. 1) | wabs*zpo | |||||
| Swift/XRT (OBS. 2) | wabs*zpo | |||||
| wabs*zwabs*zpo | cm-2 | / | ||||
| wabs*bknpo | keV | |||||
| Hard X-rays ( keV) | ||||||
| Instrument | Model | /dof | ||||
| INTEGRAL/ISGRI | zpo | |||||
| Swift/BAT | zpo | |||||
| Joint fit ( keV) | ||||||
| Instrument | Model | or | Additional Parameters | /dof | ||
| EPIC+ISGRI | wabs*zpo | |||||
| XRT (OBS. 1) + BAT | wabs*zpo | |||||
| XRT (OBS. 2) + BAT | wabs*bknpo | keV | ||||
Models and parameters for single instruments and joint fit. Applied models are: a power-law in the source rest frame (zpo), a power-law with an absorption component in the object rest frame (zwabs*zpo) and a broken power-law (bknpo). All models include Galactic absorption (wabs) with column density cm-2 (Kalberla et al., 2005). Flux is given in units of erg cm-2 s-1.
3.1 Spectral variation
The present analysis, and past results, shows that the hard-X-ray emission in the keV interval (object rest frame) of PKS does not vary in spectral shape: indeed spectra obtained almost a year apart by INTEGRAL/ISGRI and Swift/BAT show a constant (within errors) photon index, which is also consistent with the slope previously inferred for data acquired by BeppoSAX in ( - Elvis et al. 2000). We recall that the spectra refer to an average state covering days for ISGRI and months for BAT. Despite the lack of spectral variability, the integrated flux in the keV band exhibits a variation of more than a factor of two from the lowest value of ISGRI to the highest value for BAT. A remarkable change in the hard-X-ray flux is not uncommon for blazars, and it was observed, for instance, in Swift J, although with a different spectral slope (Masetti et al., 2007).
In the keV energy band, our data analysis suggests a more complex behavior. As discussed in Ferrero & Brinkmann (2003), the source spectrum acquired in (XMM-Newton/EPIC data) is well described by a single power-law function with little evidence that a more complex model is necessary. Instead, the two observations with XRT in suggest a spectral change from a power-law model in the first observation (--), to a curved model in the second pointing (--), with a hint of curvature developing over days. As for other high-z radio-loud quasars, this feature is usually interpreted as an extra-absorption component. This absorbing cloud should be associated with the quasar frame, since no Damped Ly features reveal absorption by intervening material. Although short-term variability due to changes in the intrinsic absorption was observed in Seyfert galaxies (Risaliti et al., 2007), a variation on time intervals of days is difficult to reconcile with the blazar picture since the absorbing cloud should be located at a distance of cm from the black hole, below the length scale on which jet dissipation is supposed to occur in this class of objects. On the other hand, in the blazar scenario the soft photon deficit and its variation can be naturally interpreted as a spectral break due to the Inverse Compton regime onset (Tavecchio et al., 2007; Sambruna et al., 2007). Indeed a low-energy roll-off appears to be a common property of FSRQs, for distant objects such as MG J (, Maraschi et al. 2008, RBS (, Tavecchio et al. 2007), and nearby FSRQs such as C (, Ghisellini et al. 2007). For high-z FSRQs, the break signature falls in the soft X-ray band, where this feature can be blurred by contribution from the primary seed photon input and the bulk Comptonization of cold electrons in the jet (Celotti et al., 2007). Apart from spectral analysis, a variability study of simultaneous data in the optical to X-ray bands can provide clues to the origin of the intrinsic curvature in the continuum (Foschini, 2008).
3.2 SED modeling
| Parameter | Swift | EPIC+ISGRI |
|---|---|---|
| 15 | 15 | |
| 150 | 150 | |
| (deg) | 3 | 3 |
| 15 | 10 | |
| 8 | 8 | |
| 5 | 5 | |
| 1000 | 1000 | |
| (G) | 3.3 | 3.3 |
| 150 | 150 | |
| 1300 | 1300 |
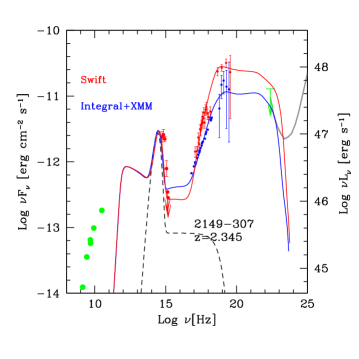
We define two different states of PKS : a “low-flux” state given by XMM-Newton and INTEGRAL points and a “high-flux” state studied with XRT and BAT data, for which we obtained a high flux level separately in the and keV band. We chose the second observation of XRT (on --), since the flux is comparable to the first one but exhibits spectral bending at low energies. In Fig.2 the SEDs for both states are depicted separately in blue and red. Optical/UV data were corrected for Galactic absorption according to Cardelli et al. (1989) and using the zero points given in the calibration files. X-ray points are corrected only for the Galactic absorption. The multiwavelength spectra are completed with radio and IR data taken from NED, and the EGRET upper limit (Fichtel et al., 1994).
We attempt to describe the two states in terms of changes in the physical parameters of the source. For both, we model the source as discussed in detail in Ghisellini et al. (2002). The model assumes synchrotron and Inverse Compton emission from a spherical region in the jet, of radius , at a distance from the disk, with bulk Lorentz factor and orientation with respect to the line of sight. The blob is populated by a tangled and homogeneous magnetic field and by relativistic electrons, injected with total power and a broken power-law energy distribution described by in , and up to . The model accounts for radiative losses and determines the cooling energy of particles after a dynamical time (see e.g., Maraschi et al. 2008). The primary emission is provided by a disk and a tenuous corona with a power-law spectrum of slope and cut-off at keV. The disk spectrum is described by a black-body peaking at Hz and with power , derived from the optical/UV spectral data. For the XMM-Newton+INTEGRAL state, we can place only weak constraints on the disk/corona emission, because of the lack of data from the optical monitors of both satellites. However, the upper limit of XMM-Newton/OM in the UV band and the almost constant archival optical data suggest that the soft photon input for the Inverse Compton regime does not vary significantly in the two states. The Broad Line Region (BLR), located at from the central black hole (see e.g., Ghisellini et al. 1996), reflects the primary emission toward the jet with luminosity (Kaspi et al., 2005).
We attempted to reproduce both states by varying as small a number of parameters as possible. This choice was also motivated by the limited energy range covered by the available simultaneous data. The absence of information above hundreds of keV makes the high energy electron distribution poorly determined. The synchrotron regime is also poorly constrained because of the lack of data. This is, however, unimportant for the SED modeling, since the radio-IR emission includes contributions from the outer regions of the jet and, therefore, is not considered in this model.
Input model parameters for both states are given in Table 3. The overall SED of PKS is typical of FSRQs at high redshift, with the Inverse Compton mechanism dominating the spectrum from X- to -rays and in accordance with the standard blazar sequence (Maraschi et al., 2008).
The two different SEDs can be explained in terms of a change only in the jet bulk Lorentz factor, being for the “high-flux” state and for the “low-flux” state. The different Lorentz factors of the emitting region can be interpreted in terms of the inner-shock model scenario (e.g., Spada et al. 2001), which assumes that subsequent colliding shells at different speed produce a new radiating shell with intermediate . The variation in the Lorentz factor accounts for the change in the total power of the source and for the spectral changes in the Inverse Compton regime, observed in the SEDs for the two states. In the “low-flux state” (found in XMM-Newton and INTEGRAL data), the “low” drives a “cooling branch” in the electron distribution with and a slope in . This cooling branch does not develop in the “high-flux” state, since we found that .
The present data quality and the partial simultaneous spectral coverage limit a careful inspection of all full model input parameter range. However, it is remarkable that the two spectral states are described by changing only the jet bulk Lorentz factor; this parameter accounts for both the flux variation and the spectral change of the Inverse Compton spectra. More complex solutions, changing more than one parameter, are not excluded, although we propose the simplest and physically consistent explanation of the state variation for the source.
4 Conclusions
We have investigated the long-term behavior of the blazar PKS (). All XMM-Newton, Swift, and INTEGRAL publicly available data have been reprocessed and analyzed with the latest software versions and calibration data bases. The SED, compiled with the data analyzed in the present work complemented with those available in the archives, is typical of FSRQs at the brightest end of the blazar sequence.
Swift observations suggest a hint of a roll-off below keV emerging on -day timescale, which can be explained as the natural spectral break due to the Inverse Compton onset. However, the present data quality does not allow us to distinguish firmly between the absorption/curvature dichotomy, and further multiband and simultaneous observations are necessary.
In the keV energy band (in the blazar frame), the flux levels derived from ISGRI and BAT data differ by more than a factor of two, without spectral slope variation. From the broad-band spectral analysis, we can identify two different states: one found in data until (XMM-Newton and INTEGRAL), and another referring to a Swift observation performed in . The SED modeling shows that the two states can be reproduced by changing only the bulk Lorentz factor of the jet.
Acknowledgements.
This research has made use of data obtained from the High Energy Astrophysics Science Archive Research Center (HEASARC), provided by NASA’s Goddard Space Flight Center. This research has made use of the NASA/IPAC Extragalactic Database (NED) which is operated by the Jet Propulsion Laboratory, California Institute of Technology, under contract with the National Aeronautics and Space Administration. We acknowledge the use of public data from the Swift data archive. We acknowledge partial support from ASI/INAF Contract I/088/06/0.References
- Barthelmy et al. (2005) Barthelmy, S. D., Barbier, L.M., Cummings, J.M., et al. 2005, Space Sci. Rev. 120, 143
- Baumgartner et al. (2008) Baumgartner, W., Tueller, J., Mushotzky, R., et al. 2008, ATel 1429
- Bird et al. (2008) Bird, A.J., Malizia, A., Bazzano, A., et al. 2007, ApJS 170, 175
- Burrows et al. (2005) Burrows, D.N., Hill, J.E., Nousek, J.A., et al. 2005, Space Sci. Rev. 120, 165
- Cappi et al. (1997) Cappi, M., Matsuoka, M., Comastri, A., et al. 1997, ApJ 478, 492
- Cardelli et al. (1989) Cardelli, J. A., Clayton, G. C. & Mathis, J. S. 1989, ApJ 345, 245
- Celotti et al. (2007) Celotti, A., Ghisellini, G. & Fabian, A.C. 2007, MNRAS 375, 417
- Courvoisier et al. (2003) Courvoisier, T. J. L., Walter, R., Beckmann, V., et al. 2003, A&A 411, L53
- Elvis et al. (2000) Elvis, M., Fiore, F., Siemiginowska, A., et al. 2000, ApJ 543, 545
- Fang et al. (2001) Fang, T., Marshall, H. L., Bryan, G. L. & Canizares, C. R. 2001, ApJ 555, 356
- Ferrero & Brinkmann (2003) Ferrero, E. & Brinkmann, W. 2003, A&A 402, 465
- Fichtel et al. (1994) Fichtel, C. E., Bertsch, D. L., Chiang, J., et al. 1994, ApJSS 94, 551
- Foschini et al. (2006) Foschini, L., Ghisellini, G., Raiteri, C. M., et al. 2006, A&A 453, 829
- Foschini (2008) Foschini, L. 2008, Adv. Space Res., accepted for publication, [arXiv:0807.2253v1]
- Francis et al. (2000) Francis, P. J., Whiting, M. T. & Webster, R. L. 2000, PASA 53, 56
- Ghisellini & Madau (1996) Ghisellini, G.& Madau, P. 1996, MNRAS, 280, 67
- Ghisellini et al. (2002) Ghisellini, G., Celotti, A. & Costamante, L. 2002, A&A 386, 842
- Ghisellini et al. (2007) Ghisellini, G., Foschini, L., Tavecchio, F. & Pian, E. 2007, MNRAS 382, L82
- Goldwurm et al. (2003) Goldwurm, A., David, P., Foschini, L., et al. 2003, A&A 411, L223
- Kalberla et al. (2005) Kalberla, P. M. W., Burton, W. B., Hartmann, D., et al. 2005, A&A 440, 775
- Kaspi et al. (2005) Kaspi, S., Maoz, D., Netzer, H., et al. 2005, ApJ, 629, 61
- Lebrun et al. (2003) Lebrun, F., Leray, J. P.,Lavocat, P. et al. 2003, A&A 411, L141
- Maraschi et al. (2008) Maraschi, L., Foschini, L., Ghisellini, G., et al. 2008, MNRAS, 391, 1981
- Masetti et al. (2007) Masetti, N., Mason, E., Landi, R., et al. 2008, A&A 480, 715
- Mason et al. (2001) Mason, K. O., Breeveld, A., Much, R., et al. 2001, A&A 365, L36
- Ojha et al. (2005) Ojha, R., Fey, A. L., Charlot, P., et al. 2005, AJ 130, 2529
- Page et al. (2004) Page, K. L., O’Brien, P. T., Reeves, J. N. & Turner, M. J. L. 2004, MNRAS 347, 316
- Page et al. (2005) Page, K. L., Reeves, J. N., O’Brien, P. T. & Turner, M. J. L. 2005, MNRAS 364, 195
- Risaliti et al. (2007) Risaliti, G., Elvis, M., & Fabbiano, G., et al. 2007, ApJ 659, L111
- Roming et al. (2005) Roming, P. W. A., Kennedy, T. E., Mason, K. O., et al. 2005, Space Sci. Rev. 120, 95
- Sambruna et al. (2007) Sambruna, R. M., Tavecchio, F., Ghisellini, G., et al. 2007, ApJ 669, 884
- Siebert et al. (1996) Siebert, J., Matsuoka, M., Brinkmann, W., et al. 1996, A&A 307, 8
- Spada et al. (2001) Spada, M., Ghisellini, G., Lazzati, D. & Celotti, A. 2001, MNRAS 325, 1559
- Strüder et al. (2001) Strüder, L., Briel, U., Dennerl, K., et al. 2001, A&A, 365, L18
- Tavecchio et al. (2007) Tavecchio, F., Maraschi, L., Ghisellini, G., et al. 2007, ApJ 665, 980
- Tueller et al. (2008) Tueller, J., Mushotzky, R. F., Barthelmy, S., et al. 2008, ApJ 681, 113
- Turner et al. (2001) Turner, M. J., Abbey, A., Arnaud, M., et al. 2001, A&A, 365, L27
- Ubertini et al. (2003) Ubertini P., Lebrun F., Di Cocco G., et al. 2003, A&A 411, L131
- Yaqoob et al. (1999) Yaqoob, T., George, I. M., Nandra, K. et al. 1999, ApJ 525, L9
- Wilkes (1986) Wilkes, B. J. 1986, MNRAS 218, 331